

The DOI matches its Crossref record; 50 of the 51 references it cites were found in a registry or an index.
Co-occurrence of anaerobic bacteria in colorectal carcinomas
Open accessAbstract
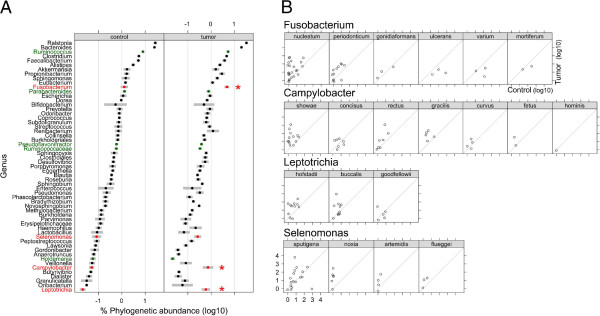
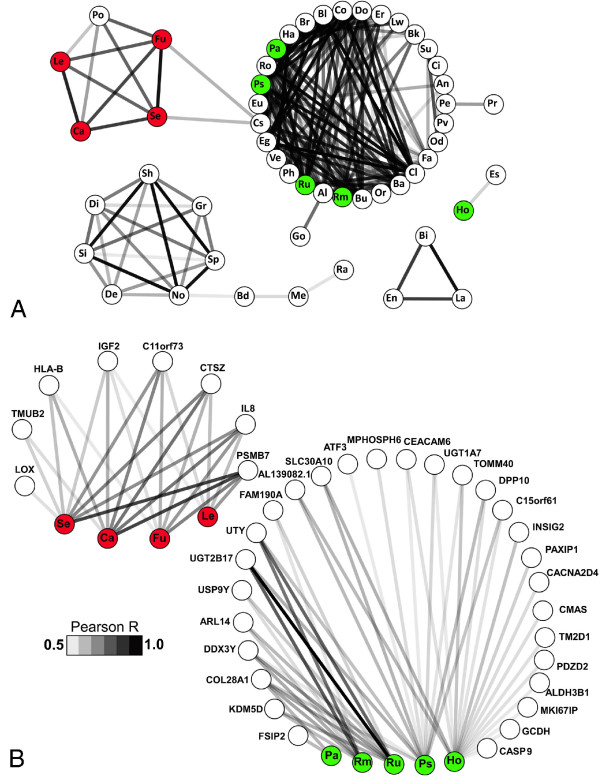
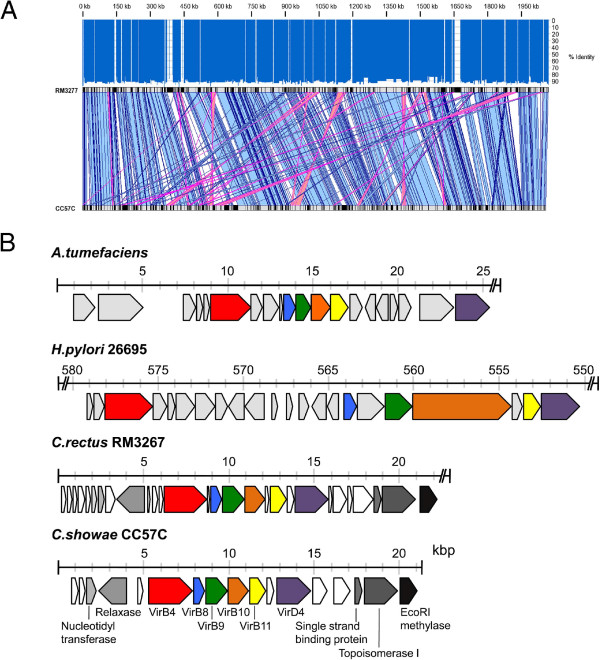
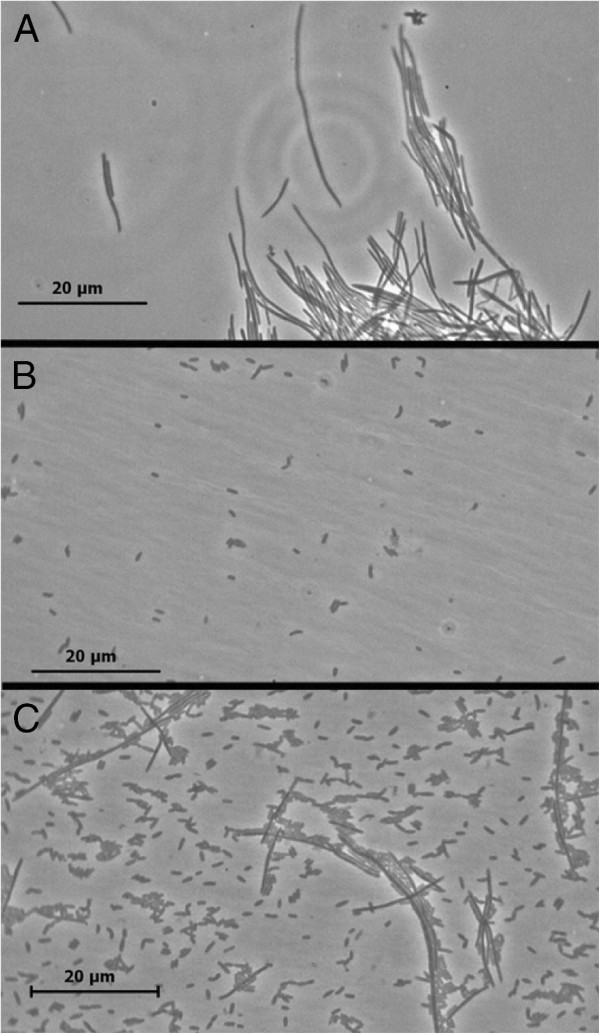
Background: Numerous cancers have been linked to microorganisms. Given that colorectal cancer is a leading cause of cancer deaths and the colon is continuously exposed to a high diversity of microbes, the relationship between gut mucosal microbiome and colorectal cancer needs to be explored. Metagenomic studies have shown an association between Fusobacterium species and colorectal carcinoma. Here, we have extended these studies with deeper sequencing of a much larger number (n = 130) of colorectal carcinoma and matched normal control tissues. We analyzed these data using co-occurrence networks in order to identify microbe-microbe and host-microbe associations specific to tumors. Results: We confirmed tumor over-representation of Fusobacterium species and observed significant co-occurrence within individual tumors of Fusobacterium, Leptotrichia and Campylobacter species. This polymicrobial signature was associated with over-expression of numerous host genes, including the gene encoding the pro-inflammatory chemokine Interleukin-8. The tumor-associated bacteria we have identified are all Gram-negative anaerobes, recognized previously as constituents of the oral microbiome, which are capable of causing infection. We isolated a novel strain of Campylobacter showae from a colorectal tumor specimen. This strain is substantially diverged from a previously sequenced oral Campylobacter showae isolate, carries potential virulence genes, and aggregates with a previously isolated tumor strain of Fusobacterium nucleatum. Conclusions: A polymicrobial signature of Gram-negative anaerobic bacteria is associated with colorectal carcinoma tissue.
Overview
The claims and statistics of this paper haven’t been checked yet.
Run the check — free, no account needed. It reads the open-access text and checks the sources it cites.
Integrity signals
Registry
Cites
Statistics
Figures
Verification
Claims the paper makes
The claims and statistics of this paper haven’t been checked yet.
Run the check — free, no account needed. It reads the open-access text and checks the sources it cites.
Claims other papers make about this one
Each is checked against this paper’s own text: does it say what the citing paper says it does?
In the citing paper
“CRCs have an increased enrichment of opportunistic pathogens and polymicrobial Gram-negative anaerobic bacteria91”
From The gut microbiota and host health: a new clinical frontier (2016) · cites this paper as [91]
Self-check
Percentages, sums and reported differences re-computed from the paper’s own numbers.
The self-check needs the paper’s full text.
Citations
Cites
Basic local alignment search tool
Altschul, S. F., Gish, W., Miller, W., Myers, E. W., & Lipman, D. J. (1990) · Journal of Molecular Biology · doi:10.1006/jmbi.1990.9999 · Cited by 98,669
Fast and accurate short read alignment with Burrows-Wheeler transform
Li, H., & Durbin, R. (2009) · Bioinformatics · doi:10.1093/bioinformatics/btp324 · Cited by 58,607
Fast and accurate long-read alignment with Burrows-Wheeler transform.
Li, H., & Durbin, R. (2010) · Bioinformatics · doi:10.1093/bioinformatics/btp698 · Cited by 12,063
A human gut microbial gene catalogue established by metagenomic sequencing
MetaHIT Consortium, Qin, J., Li, R., Raes, J., Arumugam, M., Burgdorf, K. S., Manichanh, C., Nielsen, T., Pons, N., Levenez, F., et al. (2010) · Nature · doi:10.1038/nature08821 · Cited by 11,624
Velvet: Algorithms for de novo short read assembly using de Bruijn graphsPreprint
Zerbino, D. R., & Birney, E. (2008) · Genome Research · doi:10.1101/gr.074492.107 · Cited by 9,587
Finishing the euchromatic sequence of the human genome
International Human Genome Sequencing Consortium (2004) · Nature · doi:10.1038/nature03001 · Cited by 4,971
Clonal Integration of a Polyomavirus in Human Merkel Cell Carcinoma
Feng, H., Shuda, M., Chang, Y., & Moore, P. S. (2008) · Science · doi:10.1126/science.1152586 · Cited by 3,208
The global health burden of infection‐associated cancers in the year 2002
Parkin, D. M. (2006) · International Journal of Cancer · doi:10.1002/ijc.21731 · Cited by 2,932
Integration of biological networks and gene expression data using Cytoscape
Cline, M. S., Smoot, M., Cerami, E., Kuchinsky, A., Landys, N., Workman, C., Christmas, R., Avila-Campilo, I., Creech, M., Gross, B., et al. (2007) · Nature Protocols · doi:10.1038/nprot.2007.324 · Cited by 2,507
The NIH Human Microbiome ProjectPreprint
The NIH HMP Working Group, Peterson, J. L., Garges, S., Giovanni, M. Y., McInnes, P., Wang, L., Schloss, J. A., Bonazzi, V. R., McEwen, J. E., Wetterstrand, K. A., et al. (2009) · Genome Research · doi:10.1101/gr.096651.109 · Cited by 2,168
Cited by
Sorted by citations
Items 201–300 of 349
Bacterial Infection and Associated Cancers
Zhu, C., Wang, Y., Cai, C., & Cai, Q. (2017) · Advances in experimental medicine and biology · doi:10.1007/978-981-10-5765-6_11 · Cited by 21
Arabameri, A., Asemani, D., & Teymourpour, P. (2018) · IEEE Transactions on Computational Biology and Bioinformatics · doi:10.1109/tcbb.2018.2870124 · Cited by 20
Srivastava, A., Mishra, S., Garg, P. K., Dubey, A. K., Deo, S. V. S., & Verma, D. (2022) · Applied Microbiology and Biotechnology · doi:10.1007/s00253-022-11980-5 · Cited by 22
Waqas, M. S., Halim, S. A., Ullah, A., Ali, A. A. M., Khalid, A., Abdalla, A. N., Khan, A., & Al‐Harrasi, A. (2023) · Cancers · doi:10.3390/cancers15030901 · Cited by 20
Determination of the Role of Fusobacterium Nucleatum in the Pathogenesis in and Out the Mouth
Tefiku, U., Поповска, М., Cana, A., Bedhxeti, L. Z., Bilbil, R., Spasovska-Gjorgovska, A., & Spasovski, S. (2020) · PRILOZI · doi:10.2478/prilozi-2020-0026 · Cited by 22
Greathouse, K. L., Stone, J. K., Vargas, A. J., Choudhury, A., Padgett, R. N., White, J. R., Jung, A., & Harris, C. C. (2024) · Scientific Reports · doi:10.1038/s41598-023-48862-3 · Cited by 21
Folic Acid Absorption Characteristics and Effect on Cecal Microbiota of Laying Hens
Bai, Y., Wang, R., Yang, Y., Li, R., & Wu, X. (2021) · Frontiers in Veterinary Science · doi:10.3389/fvets.2021.720851 · Cited by 19
Phipps, A. I., Hill, C. M., Lin, G. I., Malen, R. C., Reedy, A. M., Kahsai, O. J., Ammar, H., Curtis, K. R., Ma, N., Randolph, T. W., et al. (2025) · Gastro Hep Advances · doi:10.1016/j.gastha.2025.100644 · Cited by 19
Exploring the Mechanisms and Association between Oral Microflora and Systemic Diseases
Issrani, R., Reddy, J., El‐Metwally, T. H., Prabhu, N., Alruwaili, M. K., Munisekhar, M. S., Alshammari, S. M., & Alghumaiz, S. F. (2022) · Diagnostics · doi:10.3390/diagnostics12112800 · Cited by 19
The rise and evolving role of Fusobacterium nucleatum subspecies
Wolf, M., Steinberg, T., Scholz, K. J., Kruse, A., Rezasoltani, S., Conrads, G., Al‐Ahmad, A., & Cieplik, F. (2025) · Current Research in Microbial Sciences · doi:10.1016/j.crmicr.2025.100414 · Cited by 15
Janati, A. I., Karp, I., Sabri, H., & Emami, E. (2019) · Systematic Reviews · doi:10.1186/s13643-019-1031-7 · Cited by 16
Fusobacteria: physiology, form, and function
Robinson, A. V., Wilde, J., & Allen‐Vercoe, E. (2020) · Elsevier eBooks · doi:10.1016/b978-0-12-819672-4.00006-4 · Cited by 17
Self-citationVillar-Ortega, P., Ruíz, M. E., Gutiérrez-Soto, M., Jiménez, M. R.-C., Navarro‐Marí, J. M., & Fernández, J. G. (2022) · Enfermedades infecciosas y microbiologia clinica (English ed ) · doi:10.1016/j.eimce.2022.02.007 · Cited by 17
Bacteria-Mediated Oncogenesis and the Underlying Molecular Intricacies: What We Know So Far
Prasad, S. K., Bhat, S., Shashank, D., Akshatha, C. R., Sindhu, R., Rachtanapun, P., Devegowda, D., Santhekadur, P. K., & Sommano, S. R. (2022) · Frontiers in Oncology · doi:10.3389/fonc.2022.836004 · Cited by 15
Wang, P., Shang, R., Ma, Y., Wang, D., Zhao, W., Chen, F., Hu, X., & Zhao, X. (2022) · Critical Reviews in Food Science and Nutrition · doi:10.1080/10408398.2022.2106180 · Cited by 15
Exploring the oral microbiome: an updated multidisciplinary oral healthcare perspective
Chowdhry, A., Kapoor, P., Bhargava, D., & Bagga, D. K. (2023) · Discoveries · doi:10.15190/d.2023.4 · Cited by 15
Feng, K., Ren, F., Shang, Q., Wang, X., & Wang, X. (2024) · Thoracic Cancer · doi:10.1111/1759-7714.15280 · Cited by 14
Lesiów, M. K., Pietrzyk, P., Kyzioł, A., & Komarnicka, U. K. (2019) · Chemical Research in Toxicology · doi:10.1021/acs.chemrestox.9b00269 · Cited by 15
The multi-kingdom cancer microbiome
Dohlman, A. B., Pan, X., Zitvogel, L., & Iliev, I. D. (2025) · Nature Microbiology · doi:10.1038/s41564-025-02103-7 · Cited by 16
Liu, Z., Sun, Y., Li, Y., Ma, A., Willaims, N. F., Jahanbahkshi, S., Hoyd, R., Wang, X., Zhang, S., Zhu, J., et al. (2024) · Advanced Science · doi:10.1002/advs.202403393 · Cited by 15
Comparative genomics and genome biology of Campylobacter showae
Hsu, T. Y., Gemmell, M., Franzosa, E. A., Berry, S., Mukhopadhya, I., Hansen, R., Michaud, M., Nielsen, H. L., Miller, W. G., Nielsen, H. I., et al. (2019) · Emerging Microbes & Infections · doi:10.1080/22221751.2019.1622455 · Cited by 16
Fusobacterium nucleatum—The Cause of Human Colorectal Cancer
Barukčić, I. (2018) · Journal of Biosciences and Medicines · doi:10.4236/jbm.2018.63004 · Cited by 20
Tissue-associated microbial detection in cancer using human sequencing data
Rodriguez, R. M., Khadka, V. S., Menor, M., Hernandez, B. Y., & Deng, Y. (2020) · BMC Bioinformatics · doi:10.1186/s12859-020-03831-9 · Cited by 13
Oncogenic potential of Campylobacter infection in the gastrointestinal tract: narrative review
Kato, I., Minkevitch, J., & Sun, J. (2023) · Scandinavian Journal of Gastroenterology · doi:10.1080/00365521.2023.2228954 · Cited by 13
Intestinal Organoids: New Tools to Comprehend the Virulence of Bacterial Foodborne Pathogens
Garcia, M. A., Hillion, K., Cappelier, J.-M., Neunlist, M., Mahé, M. M., & Haddad, N. (2022) · Foods · doi:10.3390/foods11010108 · Cited by 13
Oral microbiota and gastric cancer: recent highlights and knowledge gaps
Xia, R., Jiang, Z., Zhou, Y., Pan, L., Wang, Y., Ma, Y., Fan, L., Yuan, L., & Cheng, X. (2024) · Journal of Oral Microbiology · doi:10.1080/20002297.2024.2391640 · Cited by 13
Bacterial Toxins Are a Never-Ending Source of Surprises: From Natural Born Killers to Negotiators
Chiloeches, M. L., Bergonzini, A., & Frisan, T. (2021) · Toxins · doi:10.3390/toxins13060426 · Cited by 14
Piazzesi, A., & Putignani, L. (2022) · Frontiers in Microbiology · doi:10.3389/fmicb.2022.958346 · Cited by 12
The Function of the Oral Microbiome in Health and Disease
Frias‐Lopez, J., & Duran-Pinedo, A. E. (2020) · Springer eBooks · doi:10.1007/978-3-030-42990-4_10 · Cited by 12
Intratumoral microorganisms in tumors of the digestive system
Xuan, M., Gu, X., Liu, Y., Li, Y., Li, Y., Huang, D., Li, J., & Xue, C. (2024) · Cell Communication and Signaling · doi:10.1186/s12964-023-01425-5 · Cited by 13
Liu, Z., Wang, Y., Zhang, C., Yang, Y., & Zhang, J. (2024) · ACS Infectious Diseases · doi:10.1021/acsinfecdis.4c00387 · Cited by 10
Strain specificity in fusobacterial co-aggregation with colorectal cancer-relevant species
Robinson, A. V., & Allen‐Vercoe, E. (2023) · Anaerobe · doi:10.1016/j.anaerobe.2023.102758 · Cited by 11
Self-citationMonson, K. R., Peters, B. A., Usyk, M., Um, C. Y., Oberstein, P. E., McCullough, M. L., Purdue, M. P., Freedman, N. D., Hayes, R. B., & Ahn, J. (2022) · Cancer Research Communications · doi:10.1158/2767-9764.crc-22-0323 · Cited by 10
Spigaglia, P., Barbanti, F., Germinario, E. A. P., Criscuolo, E. M., Bruno, G., Sanchez-Mete, L., Porowska, B., Stigliano, V., Accarpio, F., Oddi, A., et al. (2023) · Anaerobe · doi:10.1016/j.anaerobe.2023.102757 · Cited by 9
Mothersole, R. G., Macdonald, M., Kolesnikov, M., Murphy, M. E. P., & Wolthers, K. R. (2019) · Protein Science · doi:10.1002/pro.3661 · Cited by 9
Sociodemographic patterning in the oral microbiome of a diverse sample of New YorkersPreprint
Renson, A., Jones, H. E., Beghini, F., Segata, N., Zolnik, C. P., Usyk, M., Moody, T. U., Thorpe, L. E., Burk, R. D., Waldron, L., et al. (2017) · bioRxiv (Cold Spring Harbor Laboratory) · doi:10.1101/189225 · Cited by 9
Editorial: The Microbiome in Hepatobiliary and Intestinal Disease
Hartmann, P. (2022) · Frontiers in Physiology · doi:10.3389/fphys.2022.893074 · Cited by 9
Microbial Therapy with Indigenous Bacteria: From Idea to Clinical Evidence
Ермоленко, Е. И., Koroleva, I., & Suvorov, A. N. (2023) · Advances in predictive, preventive and personalised medicine · doi:10.1007/978-3-031-19564-8_9 · Cited by 8
Adem, Y., Biadgelign, M. G., Yassin, M. O., & Zenebe, Y. (2021) · Gut Pathogens · doi:10.1186/s13099-021-00415-7 · Cited by 8
Mezerová, K., Starý, L., Zbořil, P., Klementa, I., Stašek, M., Špička, P., Skalický, P., & Raclavský, V. (2021) · Life · doi:10.3390/life11111165 · Cited by 9
Fan, Y., Gu, X., Yang, H., Chen, Y., Fang, C., Deng, H., & Dai, L. (2025) · Molecular Biomedicine · doi:10.1186/s43556-025-00376-2 · Cited by 8
de Deus, A., Gonçalves, G., da Silva, J., de Jesus, L. C. L., dos Santos, A. P. S. D. A., Dall'Agnol, H. M. B., & Pereira, S. R. F. (2023) · Andrology · doi:10.1111/andr.13545 · Cited by 7
Campylobacter jejuni induces differentiation of human neutrophils to the CD16hi/CD62Llo subtype
Dolislager, C. G., Callahan, S. M., Donohoe, D. R., & Johnson, J. G. (2022) · Journal of Leukocyte Biology · doi:10.1002/jlb.4a0322-155rr · Cited by 7
He, X., Ma, X., Meng, Z., Han, Z., & Chen, W. (2023) · PubMed · doi:10.14670/hh-18-560 · Cited by 7
Burns, M. B., Montassier, E., Abrahante, J., Priya, S., Niccum, D. E., Khoruts, A., Starr, T. K., Knights, D., & Blekhman, R. (2016) · bioRxiv (Cold Spring Harbor Laboratory) · doi:10.1101/090795 · Cited by 7
Bayesian Modeling of Microbiome Data for Differential Abundance AnalysisPreprint
Li, Q., Jiang, S., Koh, A. Y., Xiao, G., & Zhan, X. (2019) · arXiv (Cornell University) · doi:10.48550/arxiv.1902.08741 · Cited by 10
González, A., Fullaondo, A., Navarro, D., Rodríguez, J., Tîrnȃucȃ, C., & Odriozola, A. (2024) · Cancers · doi:10.3390/cancers16234008 · Cited by 6
Guan, Z., Qi, H., & Feng, Q. (2025) · Open Research (University of Surrey) · doi:10.1002/viw.20240153 · Cited by 6
Campylobacteriosis in Africa: A neglected demon
Ahmed, A. O., Ameh, J. A., Abubakar, M. B., & Raufu, I. A. (2025) · The Microbe · doi:10.1016/j.microb.2025.100409 · Cited by 6
The oral - X axis: from periodontal dysbiosis to systemic disease
Jin, W., Tang, L., Yang, J., Hu, X., Guo, W., Ai, H., Zuo, Y., & Jin, Z. (2026) · Frontiers in Immunology · doi:10.3389/fimmu.2026.1806445 · Cited by 7
Kim, H., Cheon, G. Y., Kim, J. H., Choi, R., Kim, I.-W., Suh, H. J., Hong, K., & Han, S. (2024) · Applied Biological Chemistry · doi:10.1186/s13765-024-00937-z · Cited by 6
Characterization of Outer Membrane Vesicles from Fusobacterium nucleatum
Munshi, R. M. (2020) · Indian Journal of Science and Technology · doi:10.17485/ijst/2020/v13i02/148492 · Cited by 5
Villar-Ortega, P., Ruíz, M. E., Gutiérrez-Soto, M., Jiménez, M. R.-C., Navarro‐Marí, J. M., & Fernández, J. G. (2021) · Enfermedades Infecciosas y Microbiología Clínica · doi:10.1016/j.eimc.2021.01.005 · Cited by 6
Oral Microbiota Associated with Oral and Gastroenteric Cancer
Robayo, D. A. G., Flores-Hernández, R., Erira, H. A. T., Kandaurova, L., Juarez, C. L., Juárez, V., & Arregui, A. C. (2020) · The Open Microbiology Journal · doi:10.2174/1874285802014010001 · Cited by 7
Metatranscriptomic analysis of the microbiota of tumor tissue in colon cancer
Buetas, E., Conde‐Pérez, K., Concha, Á., Celeiro‐Muñoz, C., Noguera, J. F., Bou, G., López, S. P., Vallejo, J. A., Poza, M., Carda‐Diéguez, M., et al. (2026) · Microbiome · doi:10.1186/s40168-026-02372-2 · Cited by 5
The Role of the Intestinal Microbiome in the Immunotherapy of Colon Cancer
Хакимова, Г. Г., Tryakin, A. A., Заботина, Т. Н., Цуканов, А. С., Алиев, В. А., & Гуторов, С. Л. (2019) · Malignant tumours · doi:10.18027/2224-5057-2019-9-2-5-11 · Cited by 5
The Intestinal Microbiome in Humans: Its Role for a Healthy Life and in the Onset of Diseases
Gașpar, B. S., Profir, M., Roşu, O. A., Ionescu, R. F., & Creţoiu, S. M. (2024) · Physiology · doi:10.5772/intechopen.113719 · Cited by 5
Oral Bacteria and Bowel Diseases – Mini Review
Yoneda, M., & Suzuki, N. (2016) · Journal of Gastrointestinal & Digestive System · doi:10.4172/2161-069x.1000404 · Cited by 5
Microbial Metabolites as Molecular Mediators of Host-Microbe Symbiosis in Colorectal Cancer
Keane, J. M., Joyce, S. A., Gahan, C. G. M., Hyland, N. P., & Houston, A. M. (2020) · Results and problems in cell differentiation · doi:10.1007/978-3-030-51849-3_22 · Cited by 5
Colorectal microenvironment determines the prognosis of colorectal cancer
Bang, Y. H., Choi, J. H., Park, K., Lee, B., Han, K. Y., Pyo, D. H., Cho, Y. B., Kim, T. M., Park, K. J., Ryoo, S., et al. (2026) · Experimental & Molecular Medicine · doi:10.1038/s12276-025-01599-7 · Cited by 4
Characterization of microbial associations in human oral microbiome
Lee, M. S., Oh, S., & Tang, H. (2014) · Bio-Medical Materials and Engineering · doi:10.3233/bme-141202 · Cited by 4
The Impact of the Intestinal Microbiota in Therapeutic Responses Against Cancer
Bonvalet, M., Daillère, R., Roberti, M. P., Rauber, C., & Zitvogel, L. (2017) · Springer eBooks · doi:10.1007/978-3-319-62431-0_27 · Cited by 4
Microorganism-regulated autophagy in gastrointestinal cancer
Xu, J.-Y., Fan, J., Hu, M., & Zeng, J. (2023) · PeerJ · doi:10.7717/peerj.16130 · Cited by 4
Zhu, J., Li, M., Li, J., & Wu, J. (2024) · Carbohydrate Research · doi:10.1016/j.carres.2024.109172 · Cited by 4
Microbes involving in carcinogenesis; growing state of the art
Alizadeh, N., Mousavi, M. N. S., Hajibonabi, F., Memar, M. Y., Mehramuz, B., Aziziyan, K., Shiralizadeh, S., Yousefi, M., & Kafil, H. S. (2018) · Microbial Pathogenesis · doi:10.1016/j.micpath.2018.08.061 · Cited by 4
Robinson, W., Stone, J. K., Schischlik, F., Gasmi, B., Kelly, M. C., Seibert, C., Dadkhah, K., Gertz, E. M., Lee, J. S., Zhu, K., et al. (2020) · bioRxiv (Cold Spring Harbor Laboratory) · doi:10.1101/2020.05.14.096230 · Cited by 4
McGregor, A. K., Do, L. T. M., Gauvin, A., & Wolthers, K. R. (2025) · Archives of Biochemistry and Biophysics · doi:10.1016/j.abb.2025.110520 · Cited by 2
Nowak, M., Rak, K., Kłosowska, W., Błaszczyszyn, K., Gaweł-Dąbrowska, D., & Paluch, E. (2024) · Quality in Sport · doi:10.12775/qs.2024.17.52220 · Cited by 3
Rhoades, N. S., Cinco, I. R., Hendrickson, S. M., Prongay, K., Haertel, A. J., Flores, G. E., Slifka, M. K., & Messaoudi, I. (2024) · Communications Biology · doi:10.1038/s42003-023-05695-0 · Cited by 3
Bi, D., Yang, X., Yong, J., Huang, J., Liu, Z., & Gong, R. (2025) · Frontiers in Microbiology · doi:10.3389/fmicb.2025.1637272 · Cited by 3
Visualizing genome synteny with xmatchview
Warren, R. L. (2018) · The Journal of Open Source Software · doi:10.21105/joss.00497 · Cited by 3
Self-citationMolecular Signatures for Microbe-Associated Colorectal CancersPreprint
Sayed, I. M., Vo, D. T., Alcantara, J. A., Inouye, K., Pranadinata, R. F., Luo, L., Boland, C. R., Goyal, N. P., Kuo, D. J., Huang, S. C., et al. (2024) · bioRxiv (Cold Spring Harbor Laboratory) · doi:10.1101/2024.05.26.595902 · Cited by 3
Won, K., Jin, P.-R., Davis, L., Orjala, J., Armstrong, A. T., Wang, W. H., Kothandaraman, H., Utturkar, S. M., Bae, D., Jeong, B., et al. (2025) · bioRxiv (Cold Spring Harbor Laboratory) · doi:10.1101/2025.09.25.678601 · Cited by 3
Improved Key Microbial Biomarker Discovery Using Ensemble Statistical Methods
Pirovano, W., Gangopadhyay, Y., Baak, M. L., de Leeuw, C., Bongoni, R., & Klaassens, E. S. (2025) · Advanced Gut & Microbiome Research · doi:10.1155/agm3/9676659 · Cited by 3
Gopalakrishnan, V., Saravanan, V., Mahendran, M. I. M. S., Boopathy, V., Vaithianathan, R., Srinivasan, S., & Krishnamurthy, S. (2025) · Apmis · doi:10.1111/apm.70041 · Cited by 2
He, J., Jia, J., Qu, W., Zhang, S., Fan, K., Lin, R., Zhao, W., Niu, Y., Huang, Y.-Q., & Jia, L. (2025) · Frontiers in Immunology · doi:10.3389/fimmu.2025.1696701 · Cited by 2
Jemimah, S., Majdalawieh, A. F., Hamad, M. A., & Mahasneh, A. (2025) · Computers in Biology and Medicine · doi:10.1016/j.compbiomed.2025.111346 · Cited by 2
Gut microbiota and diet in colorectal cancer: Converging determinants of carcinogenesis
Thakur, B. K., Choudhury, S. R., Turpin, W., & Martín, A. (2026) · Gut Microbes · doi:10.1080/19490976.2026.2664684 · Cited by 4
Fusobacterium nucleatum in cancer: from bystander to driver
Zhong, Z.-W., Lu, Y.-Q., Duan, Y., Ma, J. Y., & Liu, N. (2026) · Gut · doi:10.1136/gutjnl-2025-338000 · Cited by 2
Oral Microbiota Associated with Clinical Efficacy of Ustekinumab in Crohn’s Disease
Xu, F., Xie, R., He, L., Wang, H., Zhu, Y., Yang, X., & Yu, H. (2025) · Endocrine Metabolic & Immune Disorders - Drug Targets · doi:10.2174/0118715303363951241209060903 · Cited by 2
Infections à Campylobacter : tableaux cliniques, prise en charge diagnostique et thérapeutique
Munier, A., & Leflon‐Guibout, V. (2016) · Journal des Anti-infectieux · doi:10.1016/j.antinf.2016.09.004 · Cited by 2
The Microbiome in Gastrointestinal Cancers
White, M. G., & Wargo, J. A. (2022) · Gastroenterology Clinics of North America · doi:10.1016/j.gtc.2022.06.007 · Cited by 2
Zeddou, M. (2023) · Asian Pacific Journal of Cancer Prevention · doi:10.31557/apjcp.2023.24.10.3629 · Cited by 2
Chen, C., Huang, Z., Huang, P., Li, K., Zeng, J., Wen, Y., Li, B., Zhao, J., & Wu, P. (2021) · Research Square · doi:10.21203/rs.3.rs-745184/v1 · Cited by 2
Eisenberg, T., Glaeser, S. P., Blom, J., & Kämpfer, P. (2018) · Bergey's Manual of Systematics of Archaea and Bacteria · doi:10.1002/9781118960608.gbm00771.pub2 · Cited by 2
Comparative Genomic Analysis of Campylobacter rectus and Closely Related SpeciesPreprint
Hughes, C. A., Blackburn, D., Pavlicek, M. K., & Threadgill, D. S. (2024) · bioRxiv (Cold Spring Harbor Laboratory) · doi:10.1101/2024.07.26.605372 · Cited by 2
Tu, S., Yin, Y., Ma, L., Chen, H., & Ye, M. (2025) · Frontiers in Cellular and Infection Microbiology · doi:10.3389/fcimb.2025.1602883 · Cited by 1
Intratumoral microbiota in colorectal cancer: roles, therapeutic potential, and challenges
Zhang, X., Qi, J., Dong, C., Zhang, L., Chen, J., Li, M., Jiang, T., & Song, J. (2025) · Journal of Advanced Research · doi:10.1016/j.jare.2025.11.067 · Cited by 2
Campylobacter jejuni infection impacts host-derived miRNAs targeting bacterial and host genes
Chitre, S., Gharaibeh, R. Z., Newsome, R. C., Jiang, J., Brock, A. A., Schmittgen, T. D., & Jobin, C. (2026) · Microbiology Spectrum · doi:10.1128/spectrum.03184-25 · Cited by 1
Liu, X., Cai, R., Meng, Y., Xu, Y., Wang, B., Liu, M., Wang, Y., Yu, Y., Lu, C., Wei, Y., et al. (2026) · Critical Reviews in Oncology/Hematology · doi:10.1016/j.critrevonc.2026.105220 · Cited by 1
Analysis of intratumoural bacteria: Opportunities and challenges for cancer therapy
Jiang, X., Zhang, C., Cao, S., Peng, Y., Zhao, M., Zhang, X., & Gao, Y. (2026) · Acta Pharmaceutica Sinica B · doi:10.1016/j.apsb.2026.03.022 · Cited by 1
Dysbiosis of the Oral Microbiome: Association with and Prevention of Human Diseases
Zhang, Z., Yang, W., & Omaye, S. T. (2019) · Food and Nutrition Sciences · doi:10.4236/fns.2019.107058 · Cited by 1
Gradings of periodontitis in relation with systemic disease
Albeshr, A. G., Alhabdan, Y. A., Aljasem, R. M., Munshi, M. A., Bagasi, A. M. H., Khars, M. Y. A., Alrasheedi, N. M., Alodiani, M. B., Alnefaie, M. A., Alibrahim, W. Y., et al. (2021) · International Journal of Community Medicine and Public Health · doi:10.18203/2394-6040.ijcmph20212630 · Cited by 1
Association of Fusobacterium nucleatum in the Progression of Colorectal Cancer
Rafique, A., & Koh, Y.-S. (2021) · Journal of Bacteriology and Virology · doi:10.4167/jbv.2021.51.2.039 · Cited by 2
Gut microbial metabolites and colorectal cancer
Masood, M., & Nasser, M. I. (2023) · Elsevier eBooks · doi:10.1016/b978-0-323-99476-7.00011-9 · Cited by 1
Kogoj, R., Bosilj, M., Šturm, A. C., Korva, M., Smrdel, K. S., Kvas, E., Pirš, M., Lepen, L., & Triglav, T. (2025) · Journal of Biomedical Informatics · doi:10.1016/j.jbi.2025.104841 · Cited by 1
Kothari, V., Joshi, C., Patel, P., Shahi, D., Mehta, C., Prajapati, B., Patel, S. J., Mandaliya, D. K., & Seshadri, S. (2018) · Elsevier eBooks · doi:10.1016/b978-0-12-813667-6.00008-5 · Cited by 1
Bairi, K. E., Amrani, M., & Maleb, A. (2020) · Springer eBooks · doi:10.1007/978-3-030-53821-7_5 · Cited by 1
Dysbiosis in Microbiome Leading to Colitis-Associated Cancer
Priyamvada, P. (2021) · Advances in medical diagnosis, treatment, and care (AMDTC) book series · doi:10.4018/978-1-7998-3580-6.ch007 · Cited by 1
Emergência de Campylobacter jejuni no setor avícola e na saúde pública do Brasil
de Melo, R. T. (2017) · doi:10.14393/ufu.te.2017.133 · Cited by 1
Metadata
- Authors
- Warren, R. L., Freeman, D. J., Pleasance, S., Watson, P., Moore, R. A., Cochrane, K., Allen-Vercoe, E., & Holt, R. A.
- Affiliations
- BC Cancer Agency (CA)
- University of Guelph (CA)
- Corresponding author
- Holt, Robert A
- Venue
- Microbiome
- Published
- 2013-05-15
- Volume
- 1
- Issue
- 1
- Pages
- 16-16
- ISSN
- 2049-2618 (ISSN-L)
- PMC
- PMC3971631
- OpenAlex
- W2122131141
- Cited by
- 348
- References
- 50
- Citations by year
- 2026: 18 · 2025: 24 · 2024: 30 · 2023: 28 · 2022: 37 · 2021: 35 · 2020: 39 · 2019: 33 · 2018: 26 · 2017: 20 · 2016: 27 · 2015: 21 · 2014: 8 · 2013: 1
- FWCI
- 8.52
- Type
- journal article
- Language
- en
- Open access
- gold
- doi.org
- Licence
- cc-by
- Locations
- Microbiome (publishedVersion, cc-by)
- Europe PMC (PubMed Central) (publishedVersion, cc-by)
- PubMed Central (publishedVersion, cc-by)
- PubMed (publishedVersion)
- Summit (Simon Fraser University) (submittedVersion, cc-by)
- Funders
- Genome British Columbia (SOF128)
- Canadian Institutes of Health Research
- Topics
- Life Sciences › Biochemistry, Genetics and Molecular Biology › Molecular Biology › Gut microbiota and health
- Health Sciences › Dentistry › Periodontics › Oral microbiology and periodontitis research
- Health Sciences › Medicine › Infectious Diseases › Clostridium difficile and Clostridium perfringens research
- Keywords
- colorectal cancer, anaerobic bacteria, Fusobacterium, Campylobacter showae, Leptotrichia, host-microbe interactions, co-occurrence networks, interleukin-8, Gram-negative bacteria, gut microbiota, Fusobacterium nucleatum, virulence genes, oral microbiota
About these checks
Registry, retraction, Cites and statistics results are computed, not judged, with one exception: a printed reference that no index lists is read once by a model before it counts as a citation error. Claims are extracted by a model and kept only when their quote appears verbatim in the text; each cited source is then checked, with a model’s help, for whether it says what the claim relies on. Those verdicts can be wrong — read the claim’s quote and the cited source before relying on one.
Statistics and arithmetic are recomputed, not judged.
Confidence bands are shown only for fields calibrated on our annotated test set. None is calibrated yet, so no band is shown.
What counts as a claim ›How we measure confidence ›How we check this ›
Are you an author, or do you see a problem with this page? Request a review
