

The DOI matches its Crossref record; 99 of the 99 references it cites were found in a registry or an index.
Large-scale analysis of transcriptional cis-regulatory modules reveals both common features and distinct subclasses
Abstract
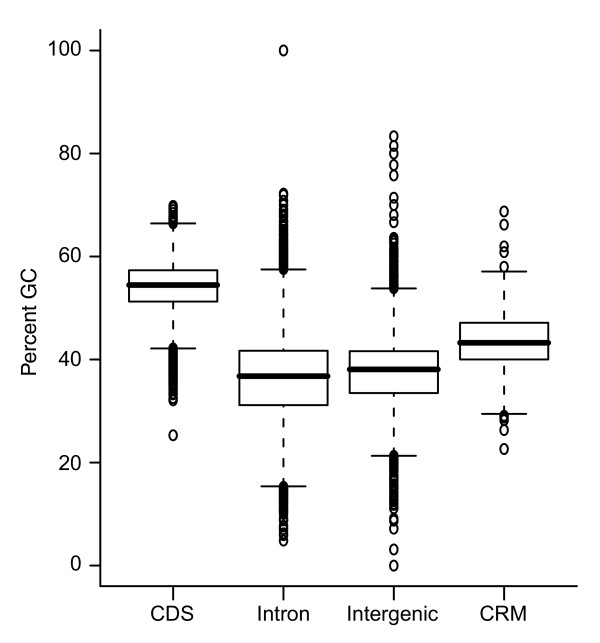
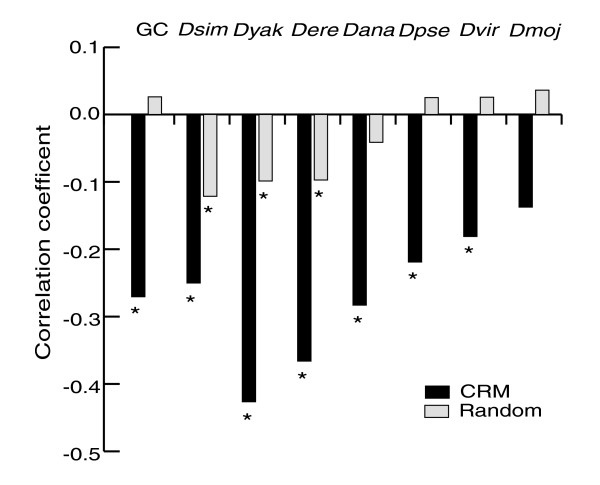
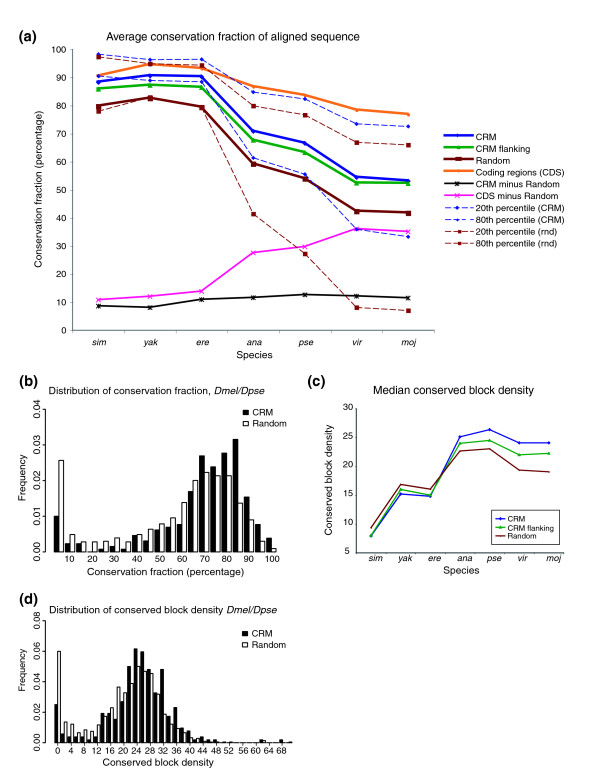
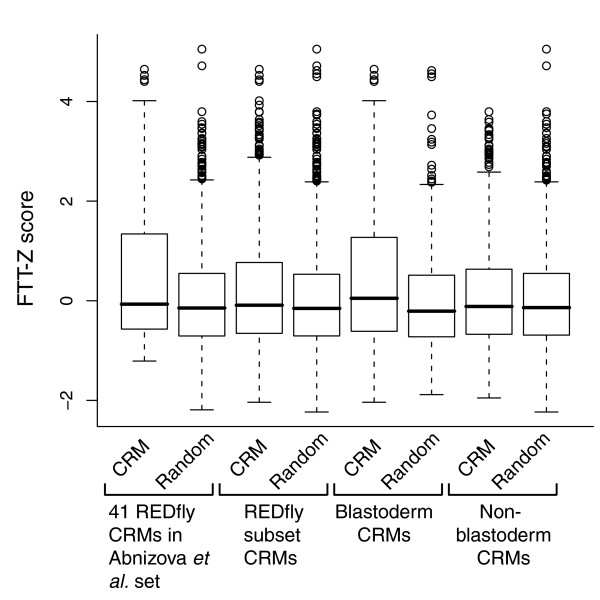
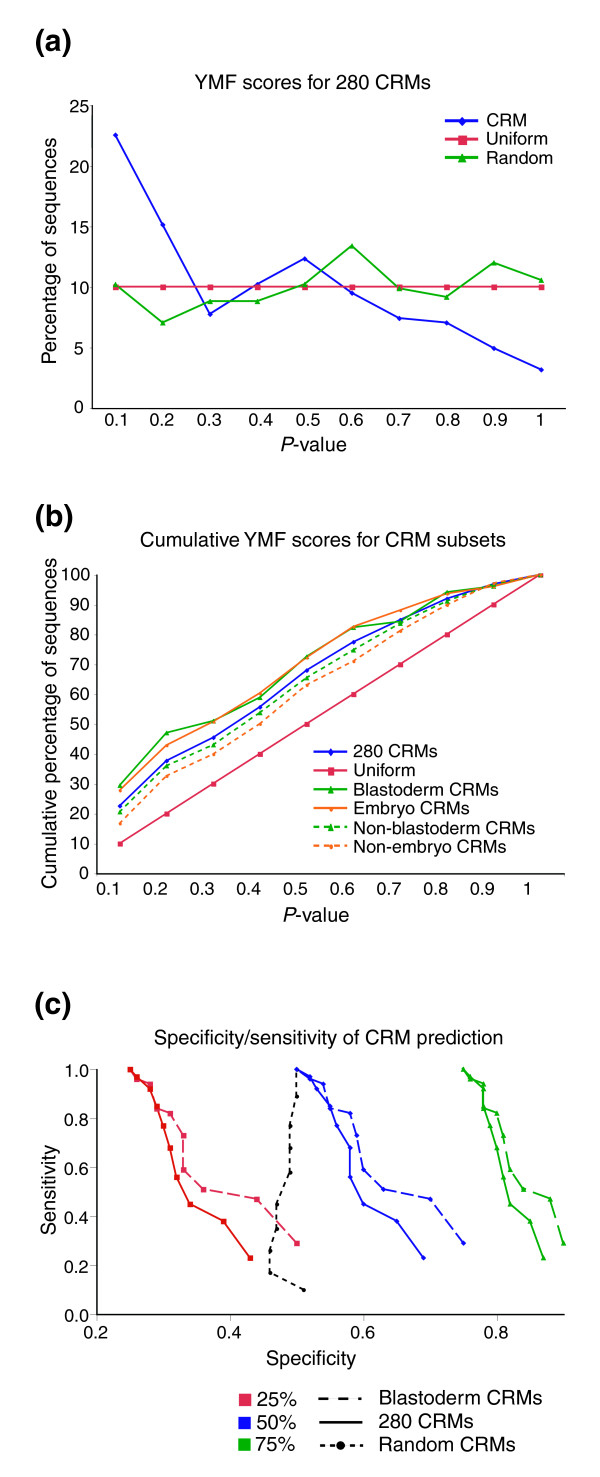
Background: Transcriptional cis -regulatory modules (for example, enhancers) play a critical role in regulating gene expression. While many individual regulatory elements have been characterized, they have never been analyzed as a class. Results: We have performed the first such large-scale study of cis -regulatory modules in order to determine whether they have common properties that might aid in their identification and contribute to our understanding of the mechanisms by which they function. A total of 280 individual, experimentally verified cis -regulatory modules from Drosophila were analyzed for a range of sequence-level and functional properties. We report here that regulatory modules do indeed share common properties, among them an elevated GC content, an increased level of interspecific sequence conservation, and a tendency to be transcribed into RNA. However, we find that dense clustering of transcription factor binding sites, especially homotypic clustering, which is commonly believed to be a general characteristic of regulatory modules, is rather a feature that belongs chiefly to a specific subclass. This has important implications for current computational approaches, many of which are biased toward this subset. We explore two new strategies to assess binding site clustering and gauge their performances with respect to their ability to detect all 280 modules and various functionally coherent subsets. Conclusion: Our findings demonstrate that cis -regulatory modules share common features that help to define them as a class and that may lead to new insights into mechanisms of gene regulation. However, these properties alone may not be sufficient to reliably distinguish regulatory from non-regulatory sequences. We also demonstrate that there are distinct subclasses of cis -regulatory modules that are more amenable to in silico detection than others and that these differences must be taken into account when attempting genome-wide regulatory element discovery.
Overview
The claims and statistics of this paper haven’t been checked yet.
Run the check — free, no account needed. It reads the open-access text and checks the sources it cites.
Integrity signals
Registry
Cites
Statistics
Figures
Verification
Claims the paper makes
The claims and statistics of this paper haven’t been checked yet.
Run the check — free, no account needed. It reads the open-access text and checks the sources it cites.
Claims other papers make about this one
Each is checked against this paper’s own text: does it say what the citing paper says it does?
In the citing paper
“Li et al. (92) reported greater homotypic TF binding site clustering in blastoderm-stage (early) enhancers than in those for other developmental programs, possibly reflecting the greater complexity of cell fate decisions driven by positional information in the early Drosophila embryo.”
From Behavior-related gene regulatory networks: A new level of organization in the brain (2020) · cites this paper as [92]
Self-check
Percentages, sums and reported differences re-computed from the paper’s own numbers.
The self-check needs the paper’s full text.
Citations
Cites
Tandem repeats finder: a program to analyze DNA sequences
Benson, G. (1999) · Nucleic Acids Research · doi:10.1093/nar/27.2.573 · Cited by 9,374
Evolutionarily conserved elements in vertebrate, insect, worm, and yeast genomes
Siepel, A., Bejerano, G., Pedersen, J. S., Hinrichs, A. S., Hou, M., Rosenbloom, K., Clawson, H., Spieth, J., Hillier, L. W., Richards, S., et al. (2005) · Genome Research · doi:10.1101/gr.3715005 · Cited by 3,971 · cited 1×
“Ultraconserved elements are overrepresented in CRMs Several recent studies have remarked on the presence of 'ultraconserved' elements and other highly conserved regions in both vertebrate and invertebrate genomes [19,53,54].”
The Transcriptional Landscape of the Mammalian Genome
Carninci, P., Kasukawa, T., Katayama, S., Gough, J., Frith, M. C., Maeda, N., Oyama, R., Ravasi, T., Lenhard, B., Wells, C. A., et al. (2005) · Science · doi:10.1126/science.1112014 · Cited by 3,492
Ultraconserved Elements in the Human Genome
Bejerano, G., Pheasant, M., Makunin, I., Stephen, S., Kent, W. J., Mattick, J. S., & Haussler, D. (2004) · Science · doi:10.1126/science.1098119 · Cited by 1,732
A genomic regulatory network for development
Davidson, E. H., Rast, J. P., Oliveri, P., Ransick, A., Calestani, C., Yuh, C.-H., Minokawa, T., Amore, G., Hinman, V., Arenas-Mena, C., et al. (2002) · Science · doi:10.1126/science.1069883 · Cited by 1,567
The evolutionary significance of cis-regulatory mutations
Wray, G. A. (2007) · Nature Reviews Genetics · doi:10.1038/nrg2063 · Cited by 1,521
Applied bioinformatics for the identification of regulatory elements
Wasserman, W. W., & Sandelin, A. (2004) · Nature Reviews Genetics · doi:10.1038/nrg1315 · Cited by 1,228
Transcriptional Maps of 10 Human Chromosomes at 5-Nucleotide Resolution
Cheng, J., Kapranov, P., Drenkow, J., Dike, S., Brubaker, S., Patel, S., Long, J., Stern, D., Tammana, H., Helt, G., et al. (2005) · Science · doi:10.1126/science.1108625 · Cited by 1,178
The RNA Polymerase II Core Promoter
Smale, S. T., & Kadonaga, J. T. (2003) · Annual Review of Biochemistry · doi:10.1146/annurev.biochem.72.121801.161520 · Cited by 1,133
The Regulatory Genome: Gene Regulatory Networks In Development And Evolution
Davidson, E. H. (2006) · Thammasat University Digital Collections · Cited by 1,048
Cited by
Behavior-related gene regulatory networks: A new level of organization in the brain
Sinha, S., Jones, B. M., Traniello, I. M., Bukhari, S. A., Halfon, M. S., Hofmann, H. A., Huang, S., Katz, P. S., Keagy, J., Lynch, V. J., et al. (2020) · Proceedings of the National Academy of Sciences · doi:10.1073/pnas.1921625117 · Cited by 85
Self-citationDynamic CRM occupancy reflects a temporal map of developmental progression
Wilczyński, B., & Furlong, E. E. M. (2010) · Molecular Systems Biology · doi:10.1038/msb.2010.35 · Cited by 44
An Enhancer's Length and Composition Are Shaped by Its Regulatory Task
Li, L., & Wunderlich, Z. (2017) · Frontiers in Genetics · doi:10.3389/fgene.2017.00063 · Cited by 42
“…if it consists of a cluster of TF binding sites within a short distance (Wasserman and Fickett, 1998; Berman et al., 2002; Frith et al., 2002; Halfon et al., 2002; Markstein et al., 2002; Rebeiz et al., 2002; Li et al., 2007; Wunderlich and Mirny, 2009; Hardison and Taylor, 2012).”
BackgroundSelf-citation
Metadata
- Authors
- Li, L., Zhu, Q., He, X., Sinha, S., & Halfon, M. S.
- Venue
- Genome Biology
- Published
- 2007-06-05
- Volume
- 8
- Issue
- 6
- ISSN
- 1474-760X
- PMC
- PMC2394749
- Cited by
- 69
- References
- 99
- Language
- en
- Licence
- creativecommons.org/licenses/by/2.0/ (tdm)
- creativecommons.org/licenses/by/2.0/ (vor)
About these checks
Registry, retraction, Cites and statistics results are computed, not judged, with one exception: a printed reference that no index lists is read once by a model before it counts as a citation error. Claims are extracted by a model and kept only when their quote appears verbatim in the text; each cited source is then checked, with a model’s help, for whether it says what the claim relies on. Those verdicts can be wrong — read the claim’s quote and the cited source before relying on one.
Statistics and arithmetic are recomputed, not judged.
Confidence bands are shown only for fields calibrated on our annotated test set. None is calibrated yet, so no band is shown.
What counts as a claim ›How we measure confidence ›How we check this ›
Are you an author, or do you see a problem with this page? Request a review
How to cite
Cite CoChat for the checks on this page, and the paper for its own findings.
- This page
- CoChat. (2026). Citation check: Large-scale analysis of transcriptional cis-regulatory modules reveals both common features and distinct subclasses. https://app.cochat.ai/papers/10.1186/gb-2007-8-6-r101
- The paper
- Li, L., Zhu, Q., He, X., Sinha, S., & Halfon, M. S. (2007). Large-scale analysis of transcriptional cis-regulatory modules reveals both common features and distinct subclasses. Genome Biology. https://doi.org/10.1186/gb-2007-8-6-r101
Data sources
Bibliographic data: Semantic Scholar, OpenAlex, Crossref.
Contains information from the Semantic Scholar Academic Graph Datasets, made available under the ODC Attribution License (ODC-BY 1.0).
Semantic Scholar’s data is described in: Kinney, R., et al. (2023). The Semantic Scholar Open Data Platform. arXiv:2301.10140.
