

The DOI matches its Crossref record; 25 of the 25 references it cites were found in a registry or an index.
A scaling normalization method for differential expression analysis of RNA-seq data
Open accessAbstract
The fine detail provided by sequencing-based transcriptome surveys suggests that RNA-seq is likely to become the platform of choice for interrogating steady state RNA. In order to discover biologically important changes in expression, we show that normalization continues to be an essential step in the analysis. We outline a simple and effective method for performing normalization and show dramatically improved results for inferring differential expression in simulated and publicly available data sets.
Overview
The claims and statistics of this paper haven’t been checked yet.
Run the check — free, no account needed. It reads the open-access text and checks the sources it cites.
Integrity signals
Registry
Cites
Statistics
Figures
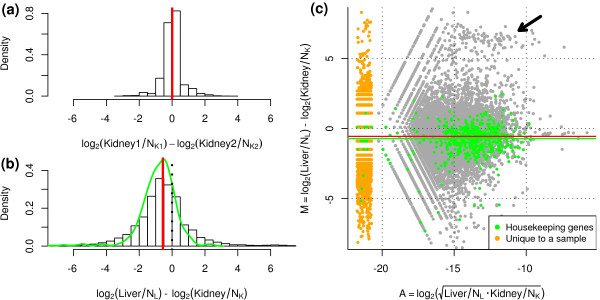
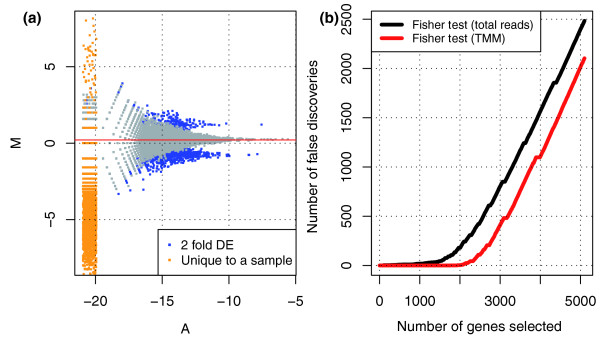
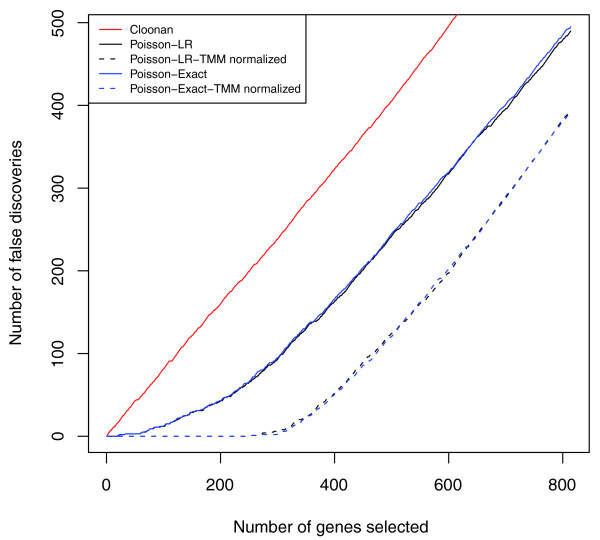
Verification
Claims the paper makes
The claims and statistics of this paper haven’t been checked yet.
Run the check — free, no account needed. It reads the open-access text and checks the sources it cites.
Claims other papers make about this one
Each is checked against this paper’s own text: does it say what the citing paper says it does?
The cited source says what the claim attributes to it.
In the citing paper
“Alternatively, voom has the ability to respect normalization factors computed outside of limma by methods such as trimmed mean of M-values (41) or conditional quantile normalization (42).”
From limma powers differential expression analyses for RNA-sequencing and microarray studies (2015) · cites this paper as [41]
In the citing paper
“Normalization methods that take this into account are TMM [47], DESeq [48], PoissonSeq [49] and UpperQuartile [45], which ignore highly variable and/or highly expressed features.”
From A survey of best practices for RNA-seq data analysis (2016) · cites this paper as [47]
Self-check
Percentages, sums and reported differences re-computed from the paper’s own numbers.
The self-check needs the paper’s full text.
Citations
Cites
Robinson, M. D., McCarthy, D. J., & Smyth, G. K. (2010) · Bioinformatics · doi:10.1093/bioinformatics/btp616 · Cited by 41,364
Self-citationMapping and quantifying mammalian transcriptomes by RNA-Seq
Mortazavi, A., Williams, B. A., McCue, K., Schaeffer, L., & Wold, B. (2008) · Nature Methods · doi:10.1038/nmeth.1226 · Cited by 13,696
RNA-Seq: a revolutionary tool for transcriptomics
Wang, Z., Gerstein, M., & Snyder, M. (2009) · Nature Reviews Genetics · doi:10.1038/nrg2484 · Cited by 13,174
Bioconductor: open software development for computational biology and bioinformatics
Gentleman, R. C., Carey, V. J., Bates, D. M., Bolstad, B., Dettling, M., Dudoit, S., Ellis, B., Gautier, L., Ge, Y., Gentry, J., et al. (2004) · Genome biology · doi:10.1186/gb-2004-5-10-r80 · Cited by 12,082
Exploration, normalization, and summaries of high density oligonucleotide array probe level data
Irizarry, R. A. (2003) · Biostatistics · doi:10.1093/biostatistics/4.2.249 · Cited by 10,603
Bolstad, B. M., Irizarry, R. A., Åstrand, M., & Speed, T. P. (2003) · Bioinformatics · doi:10.1093/bioinformatics/19.2.185 · Cited by 8,328
Alternative isoform regulation in human tissue transcriptomes
Wang, E. T., Sandberg, R., Luo, S., Khrebtukova, I., Zhang, L., Mayr, C., Kingsmore, S. F., Schroth, G. P., & Burge, C. B. (2008) · Nature · doi:10.1038/nature07509 · Cited by 5,181
Yang, Y., Dudoit, S., Luu, P., Lin, D., Peng, V., Ngai, J., & Speed, T. (2002) · Nucleic Acids Research · doi:10.1093/nar/30.4.e15 · Cited by 3,722
RNA-seq: An assessment of technical reproducibility and comparison with gene expression arrays
Marioni, J. C., Mason, C. E., Mane, S. M., Stephens, M., & Gilad, Y. (2008) · Genome Research · doi:10.1101/gr.079558.108 · Cited by 2,771
BioMart and Bioconductor: a powerful link between biological databases and microarray data analysis
Durinck, S., Moreau, Y., Kasprzyk, A., Davis, S. R., Moor, B. D., Brāzma, A., & Huber, W. K. (2005) · Computer applications in the biosciences · doi:10.1093/bioinformatics/bti525 · Cited by 2,327
Sultan, M., Schulz, M. H., Richard, H., Magen, A., Klingenhoff, A., Scherf, M., Seifert, M., Borodina, T., Soldatov, A., Parkhomchuk, D., et al. (2008) · Science · doi:10.1126/science.1160342 · Cited by 1,293
Small-sample estimation of negative binomial dispersion, with applications to SAGE data
Robinson, M. D., & Smyth, G. K. (2007) · Biostatistics · doi:10.1093/biostatistics/kxm030 · Cited by 1,073
Self-citationStem cell transcriptome profiling via massive-scale mRNA sequencing
Cloonan, N., Forrest, A. R. R., Kolle, G., Gardiner, B. B. A., Faulkner, G. J., Brown, M. K., Taylor, D. F., Steptoe, A. L., Wani, S., Bethel, G., et al. (2008) · Nature Methods · doi:10.1038/nmeth.1223 · Cited by 1,035 · cited 5×
“[12] dataset (Figure S3 in Additional file 1) gives an estimated TMM scaling factor of 1.”
InfluentialModerated statistical tests for assessing differences in tag abundance
Robinson, M. D., & Smyth, G. K. (2007) · Bioinformatics · doi:10.1093/bioinformatics/btm453 · Cited by 856
Self-citationEvidence Based Selection of Housekeeping Genes
de Jonge, H. J. M., Fehrmann, R. S. N., de Bont, E. S. J. M., Hofstra, R. M. W., Gerbens, F., Kamps, W. A., de Vries, E. G. E., van der Zee, A. G. J., Meerman, G. J. T., & ter Elst, A. (2007) · PLoS ONE · doi:10.1371/journal.pone.0000898 · Cited by 748
't Hoen, P. A. C., Ariyurek, Y., Thygesen, H. H., Vreugdenhil, E., Vossen, R. H. A. M., de Menezes, R. X., Boer, J. M., van Ommen, G.-J. B., & den Dunnen, J. T. (2008) · Nucleic Acids Research · doi:10.1093/nar/gkn705 · Cited by 742
Human housekeeping genes are compact
Eisenberg, E., & Levanon, E. Y. (2003) · Trends in Genetics · doi:10.1016/s0168-9525(03)00140-9 · Cited by 699
PeakSeq enables systematic scoring of ChIP-seq experiments relative to controls
Rozowsky, J. S., Euskirchen, G. M., Auerbach, R. K., Zhang, Z. D., Gibson, T., Bjornson, R. D., Carriero, N., Snyder, M. P., & Gerstein, M. (2009) · Nature Biotechnology · doi:10.1038/nbt.1518 · Cited by 569
Transcript length bias in RNA-seq data confounds systems biology
Oshlack, A., & Wakefield, M. J. (2009) · Biology Direct · doi:10.1186/1745-6150-4-14 · Cited by 497 · cited 1×
“However, it has been well established that gene length biases are prominent in the analysis of gene expression [15].”
Self-citationTranscriptome-Wide Identification of Novel Imprinted Genes in Neonatal Mouse Brain
Wang, X., Sun, Q., McGrath, S. D., Mardis, E. R., Soloway, P. D., & Clark, A. G. (2008) · PLoS ONE · doi:10.1371/journal.pone.0003839 · Cited by 184
In-depth characterization of the microRNA transcriptome in a leukemia progression modelPreprint
Kuchenbauer, F. C., Morin, R. D., Argiropoulos, B., Petriv, O. I., Griffith, M., Heuser, M., Yung, E., Piper, J., Delaney, A. D., Prabhu, A., et al. (2008) · Genome Research · doi:10.1101/gr.077578.108 · Cited by 173
Balwierz, P. J., Carninci, P., Daub, C. O., Kawai, J., Hayashizaki, Y., Belle, W. V., Beisel, C., & van Nimwegen, E. (2009) · Genome biology · doi:10.1186/gb-2009-10-7-r79 · Cited by 127
Li, H., Lovci, M., Kwon, Y., Rosenfeld, M. G., Fu, X., & Yeo, G. W.-M. (2008) · Proceedings of the National Academy of Sciences · doi:10.1073/pnas.0807121105 · Cited by 94
Oshlack, A., Emslie, D., Corcoran, L. M., & Smyth, G. K. (2007) · Genome biology · doi:10.1186/gb-2007-8-1-r2 · Cited by 69
Self-citationVêncio, R. Z. N., Brentani, H., Patrão, D. F. D. C., & Pereira, C. A. D. B. (2004) · BMC Bioinformatics · doi:10.1186/1471-2105-5-119 · Cited by 65
Research works printed but not linked: 3
- Bullard JH, Purdom EA, Hansen KD, Durinck S, Dudoit S: Statistical inference in mRNA-Seq: exploratory data analysis and differential expression. UC Berkeley Division of Biostatistics Working Paper Series. 2009, paper 247
- Casella G, Berger RL: Statistical Inference. 2002, Pacific Grove, CA: Duxbury Press
- Team RDC: R: A Language and Environment for Statistical Computing. 2009
Cited by
Sorted by citations
limma powers differential expression analyses for RNA-sequencing and microarray studies
Ritchie, M. E., Phipson, B., Wu, D., Hu, Y., Law, C. W., Shi, W., & Smyth, G. K. (2015) · Nucleic Acids Research · doi:10.1093/nar/gkv007 · Cited by 40,458
Differential expression analysis for sequence count data
Anders, S., & Huber, W. (2010) · Genome Biology · doi:10.1186/gb-2010-11-10-r106 · Cited by 15,581
Gene ontology analysis for RNA-seq: accounting for selection bias
Young, M. D., Wakefield, M. J., Smyth, G. K., & Oshlack, A. (2010) · Genome Biology · doi:10.1186/gb-2010-11-2-r14 · Cited by 7,107
Self-citationvoom: precision weights unlock linear model analysis tools for RNA-seq read counts
Law, C. W., Chen, Y., Shi, W., & Smyth, G. K. (2014) · Genome Biology · doi:10.1186/gb-2014-15-2-r29 · Cited by 6,155
The GTEx Consortium atlas of genetic regulatory effects across human tissues
The GTEx Consortium, Aguet, F., Anand, S., Ardlie, K. G., Gabriel, S., Getz, G. A., Graubert, A., Hadley, K., Handsaker, R. E., Huang, K. H., et al. (2020) · Science · doi:10.1126/science.aaz1776 · Cited by 5,547
Metadata
- Authors
- Robinson, M. D., & Oshlack, A.
- Affiliations
- Garvan Institute of Medical Research (AU)
- Walter and Eliza Hall Institute of Medical Research (AU)
- Corresponding author
- Robinson, Mark D
- Oshlack, Alicia
- Venue
- Genome Biology
- Published
- 2010-03-02
- Volume
- 11
- Issue
- 3
- Pages
- R25-R25
- ISSN
- 1465-6906 (ISSN-L)
- 1474-760X
- PMC
- PMC2864565
- OpenAlex
- W2107018762
- Cited by
- 7,876
- References
- 25
- Citations by year
- 2026: 452 · 2025: 604 · 2024: 832 · 2023: 700 · 2022: 773 · 2021: 1010 · 2020: 730 · 2019: 610 · 2018: 540 · 2017: 440 · 2016: 348 · 2015: 285 · 2014: 222 · 2013: 153 · 2012: 100
- FWCI
- 41.77
- Type
- journal article
- Language
- en
- Open access
- gold
- doi.org
- Locations
- Genome biology (publishedVersion, cc-by)
- Europe PMC (PubMed Central) (publishedVersion, cc-by)
- PubMed Central (publishedVersion, cc-by)
- PubMed (publishedVersion)
- Minerva Access (University of Melbourne) (submittedVersion, cc-by)
- Funders
- Medical Research Council
- National Health and Medical Research Council (490037)
- Topics
- Life Sciences › Biochemistry, Genetics and Molecular Biology › Molecular Biology › Gene expression and cancer classification
- Life Sciences › Biochemistry, Genetics and Molecular Biology › Molecular Biology › Genomics and Phylogenetic Studies
- Life Sciences › Biochemistry, Genetics and Molecular Biology › Molecular Biology › Single-cell and spatial transcriptomics
- Keywords
- RNA-seq, normalization, differential gene expression, transcriptome, gene expression, read count normalization
- MeSH terms
- Base Sequence, Computer Simulation, RNA, Models, Statistical, Gene Library, Gene Expression Profiling
About these checks
Registry, retraction, Cites and statistics results are computed, not judged, with one exception: a printed reference that no index lists is read once by a model before it counts as a citation error. Claims are extracted by a model and kept only when their quote appears verbatim in the text; each cited source is then checked, with a model’s help, for whether it says what the claim relies on. Those verdicts can be wrong — read the claim’s quote and the cited source before relying on one.
Statistics and arithmetic are recomputed, not judged.
Confidence bands are shown only for fields calibrated on our annotated test set. None is calibrated yet, so no band is shown.
What counts as a claim ›How we measure confidence ›How we check this ›
Are you an author, or do you see a problem with this page? Request a review
