

The DOI matches its Crossref record; 25 of the 25 references it cites were found in a registry or an index.
A scaling normalization method for differential expression analysis of RNA-seq data
Open accessAbstract
The fine detail provided by sequencing-based transcriptome surveys suggests that RNA-seq is likely to become the platform of choice for interrogating steady state RNA. In order to discover biologically important changes in expression, we show that normalization continues to be an essential step in the analysis. We outline a simple and effective method for performing normalization and show dramatically improved results for inferring differential expression in simulated and publicly available data sets.
Overview
The claims and statistics of this paper haven’t been checked yet.
Run the check — free, no account needed. It reads the open-access text and checks the sources it cites.
Integrity signals
Registry
Cites
Statistics
Figures
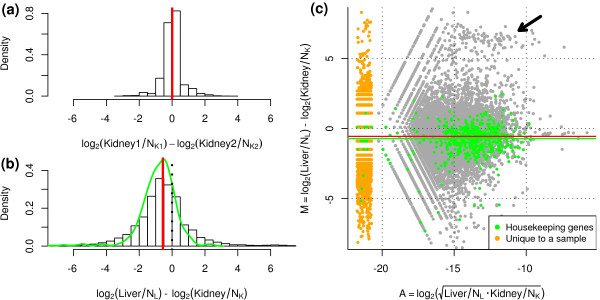
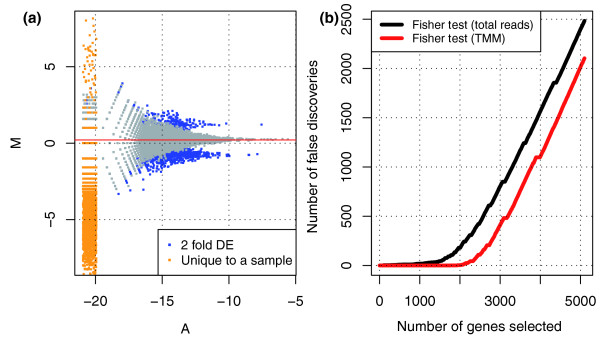
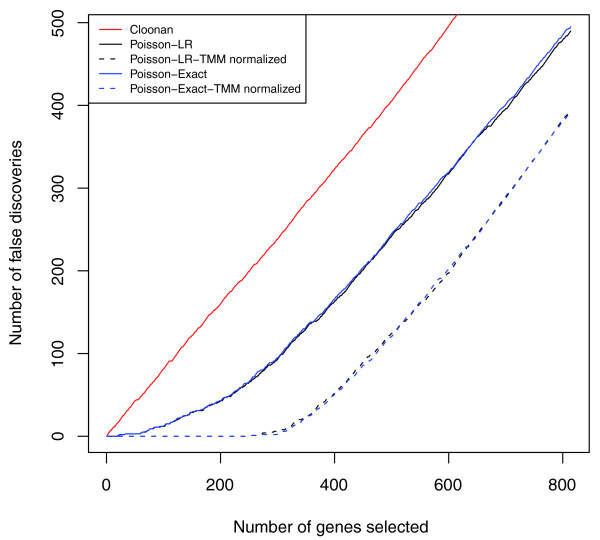
Verification
Claims the paper makes
The claims and statistics of this paper haven’t been checked yet.
Run the check — free, no account needed. It reads the open-access text and checks the sources it cites.
Claims other papers make about this one
Each is checked against this paper’s own text: does it say what the citing paper says it does?
The cited source says what the claim attributes to it.
In the citing paper
“Alternatively, voom has the ability to respect normalization factors computed outside of limma by methods such as trimmed mean of M-values (41) or conditional quantile normalization (42).”
From limma powers differential expression analyses for RNA-sequencing and microarray studies (2015) · cites this paper as [41]
In the citing paper
“Normalization methods that take this into account are TMM [47], DESeq [48], PoissonSeq [49] and UpperQuartile [45], which ignore highly variable and/or highly expressed features.”
From A survey of best practices for RNA-seq data analysis (2016) · cites this paper as [47]
Self-check
Percentages, sums and reported differences re-computed from the paper’s own numbers.
The self-check needs the paper’s full text.
Citations
Cites
Robinson, M. D., McCarthy, D. J., & Smyth, G. K. (2010) · Bioinformatics · doi:10.1093/bioinformatics/btp616 · Cited by 41,364
Self-citationMapping and quantifying mammalian transcriptomes by RNA-Seq
Mortazavi, A., Williams, B. A., McCue, K., Schaeffer, L., & Wold, B. (2008) · Nature Methods · doi:10.1038/nmeth.1226 · Cited by 13,696
RNA-Seq: a revolutionary tool for transcriptomics
Wang, Z., Gerstein, M., & Snyder, M. (2009) · Nature Reviews Genetics · doi:10.1038/nrg2484 · Cited by 13,174
Bioconductor: open software development for computational biology and bioinformatics
Gentleman, R. C., Carey, V. J., Bates, D. M., Bolstad, B., Dettling, M., Dudoit, S., Ellis, B., Gautier, L., Ge, Y., Gentry, J., et al. (2004) · Genome biology · doi:10.1186/gb-2004-5-10-r80 · Cited by 12,082
Exploration, normalization, and summaries of high density oligonucleotide array probe level data
Irizarry, R. A. (2003) · Biostatistics · doi:10.1093/biostatistics/4.2.249 · Cited by 10,603
Bolstad, B. M., Irizarry, R. A., Åstrand, M., & Speed, T. P. (2003) · Bioinformatics · doi:10.1093/bioinformatics/19.2.185 · Cited by 8,328
Alternative isoform regulation in human tissue transcriptomes
Wang, E. T., Sandberg, R., Luo, S., Khrebtukova, I., Zhang, L., Mayr, C., Kingsmore, S. F., Schroth, G. P., & Burge, C. B. (2008) · Nature · doi:10.1038/nature07509 · Cited by 5,181
Yang, Y., Dudoit, S., Luu, P., Lin, D., Peng, V., Ngai, J., & Speed, T. (2002) · Nucleic Acids Research · doi:10.1093/nar/30.4.e15 · Cited by 3,722
RNA-seq: An assessment of technical reproducibility and comparison with gene expression arrays
Marioni, J. C., Mason, C. E., Mane, S. M., Stephens, M., & Gilad, Y. (2008) · Genome Research · doi:10.1101/gr.079558.108 · Cited by 2,771
BioMart and Bioconductor: a powerful link between biological databases and microarray data analysis
Durinck, S., Moreau, Y., Kasprzyk, A., Davis, S. R., Moor, B. D., Brāzma, A., & Huber, W. K. (2005) · Computer applications in the biosciences · doi:10.1093/bioinformatics/bti525 · Cited by 2,327
Research works printed but not linked: 3
- Bullard JH, Purdom EA, Hansen KD, Durinck S, Dudoit S: Statistical inference in mRNA-Seq: exploratory data analysis and differential expression. UC Berkeley Division of Biostatistics Working Paper Series. 2009, paper 247
- Casella G, Berger RL: Statistical Inference. 2002, Pacific Grove, CA: Duxbury Press
- Team RDC: R: A Language and Environment for Statistical Computing. 2009
Cited by
Sorted by citations
limma powers differential expression analyses for RNA-sequencing and microarray studies
Ritchie, M. E., Phipson, B., Wu, D., Hu, Y., Law, C. W., Shi, W., & Smyth, G. K. (2015) · Nucleic Acids Research · doi:10.1093/nar/gkv007 · Cited by 40,458
Differential expression analysis for sequence count data
Anders, S., & Huber, W. (2010) · Genome Biology · doi:10.1186/gb-2010-11-10-r106 · Cited by 15,581
Gene ontology analysis for RNA-seq: accounting for selection bias
Young, M. D., Wakefield, M. J., Smyth, G. K., & Oshlack, A. (2010) · Genome Biology · doi:10.1186/gb-2010-11-2-r14 · Cited by 7,107
Self-citationvoom: precision weights unlock linear model analysis tools for RNA-seq read counts
Law, C. W., Chen, Y., Shi, W., & Smyth, G. K. (2014) · Genome Biology · doi:10.1186/gb-2014-15-2-r29 · Cited by 6,155
The GTEx Consortium atlas of genetic regulatory effects across human tissues
The GTEx Consortium, Aguet, F., Anand, S., Ardlie, K. G., Gabriel, S., Getz, G. A., Graubert, A., Hadley, K., Handsaker, R. E., Huang, K. H., et al. (2020) · Science · doi:10.1126/science.aaz1776 · Cited by 5,547
McCarthy, D. J., Chen, Y., & Smyth, G. K. (2012) · Nucleic Acids Research · doi:10.1093/nar/gks042 · Cited by 5,195
Microbiome Datasets Are Compositional: And This Is Not Optional
Gloor, G. B., Macklaim, J. M., Pawlowsky-Glahn, V., & Egozcue, J. J. (2017) · Frontiers in Microbiology · doi:10.3389/fmicb.2017.02224 · Cited by 3,044
“There are a number of count normalization methods used and two, the trimmed mean of M values (TMM) (Robinson and Oshlack, 2010), and the median method (Anders and Huber, 2010) are similar to a logratio transformations, but are less suitable in highly asymmetrical or sparse datasets (Fernandes et…”
MethodA survey of best practices for RNA-seq data analysis
Conesa, A., Madrigal, P., Tarazona, S., Gomez-Cabrero, D., Cervera, A., McPherson, A., Szcześniak, M. W., Gaffney, D. J., Elo, L. L., Zhang, X., et al. (2016) · Genome Biology · doi:10.1186/s13059-016-0881-8 · Cited by 2,794
Multivariable association discovery in population-scale meta-omics studies
Mallick, H., Rahnavard, A., McIver, L. J., Ma, S., Zhang, Y., Nguyen, L. H., Tickle, T. L., Weingart, G., Ren, B., Schwager, E. H., et al. (2021) · PLOS Computational Biology · doi:10.1371/journal.pcbi.1009442 · Cited by 2,596
Võsa, U., Claringbould, A., Westra, H.-J., Bonder, M. J., Deelen, P., Zeng, B., Kirsten, H., Saha, A., Kreuzhuber, R., Yazar, S., et al. (2021) · Nature Genetics · doi:10.1038/s41588-021-00913-z · Cited by 2,607
McCarthy, D. J., Campbell, K. R., Lun, A. T. L., & Wills, Q. F. (2017) · Bioinformatics · doi:10.1093/bioinformatics/btw777 · Cited by 1,852
ComBat-seq: batch effect adjustment for RNA-seq count data
Zhang, Y., Parmigiani, G., & Johnson, W. E. (2020) · NAR Genomics and Bioinformatics · doi:10.1093/nargab/lqaa078 · Cited by 1,566
Differential expression in RNA-seq: A matter of depth
Tarazona, S., García-Alcalde, F., Dopazo, J., Ferrer, A., & Conesa, A. (2011) · Genome Research · doi:10.1101/gr.124321.111 · Cited by 1,632
The human transcriptome across tissues and individuals
Melé, M., Ferreira, P. G., Reverter, F., DeLuca, D. S., Monlong, J., Sammeth, M., Young, T. R., Goldmann, J. M., Pervouchine, D. D., Sullivan, T. J., et al. (2015) · Science · doi:10.1126/science.aaa0355 · Cited by 1,304
Gene expression elucidates functional impact of polygenic risk for schizophrenia
Fromer, M., Roussos, P., Sieberts, S. K., Johnson, J. S., Kavanagh, D. H., Perumal, T. M., Ruderfer, D. M., Oh, E. C., Topol, A., Shah, H. R., et al. (2016) · Nature Neuroscience · doi:10.1038/nn.4399 · Cited by 1,091
Computational and analytical challenges in single-cell transcriptomics
Stegle, O., Teichmann, S. A., & Marioni, J. C. (2015) · Nature Reviews Genetics · doi:10.1038/nrg3833 · Cited by 1,170
An atlas of the protein-coding genes in the human, pig, and mouse brain
Sjöstedt, E., Zhong, W., Fagerberg, L., Karlsson, M., Mitsios, N., Adori, C., Oksvold, P., Edfors, F., Limiszewska, A., Hikmet, F., et al. (2020) · Science · doi:10.1126/science.aay5947 · Cited by 1,151
The NASA Twins Study: A multidimensional analysis of a year-long human spaceflight
Garrett-Bakelman, F. E., Darshi, M., Green, S. J., Gur, R. C., Lin, L., Macias, B. R., McKenna, M. J., Meydan, C., Mishra, T., Nasrini, J., et al. (2019) · Science · doi:10.1126/science.aau8650 · Cited by 1,128
Proteomics of SARS-CoV-2-infected host cells reveals therapy targets
Bojkova, D., Klann, K., Koch, B., Widera, M., Krause, D., Ciesek, S., Cinatl, J., & Münch, C. (2020) · Nature · doi:10.1038/s41586-020-2332-7 · Cited by 1,010
Pooling across cells to normalize single-cell RNA sequencing data with many zero counts
L. Lun, A. T., Bach, K., & Marioni, J. C. (2016) · Genome Biology · doi:10.1186/s13059-016-0947-7 · Cited by 1,108
SEQC/MAQC-III Consortium (2014) · Nature Biotechnology · doi:10.1038/nbt.2957 · Cited by 983
Gene co-expression analysis for functional classification and gene–disease predictions
van Dam, S., Võsa, U., van der Graaf, A., Franke, L., & de Magalhães, J. P. (2017) · Briefings in Bioinformatics · doi:10.1093/bib/bbw139 · Cited by 995
Computational methods for transcriptome annotation and quantification using RNA-seq
Garber, M., Grabherr, M. G., Guttman, M., & Trapnell, C. (2011) · Nature Methods · doi:10.1038/nmeth.1613 · Cited by 1,042
Differential abundance testing on single-cell data using k-nearest neighbor graphs
Dann, E., Henderson, N. C., Teichmann, S. A., Morgan, M. D., & Marioni, J. C. (2022) · Nature Biotechnology · doi:10.1038/s41587-021-01033-z · Cited by 938
Schurch, N. J., Schofield, P., Gierliński, M., Cole, C., Sherstnev, A., Singh, V., Wrobel, N., Gharbi, K., Simpson, G. G., Owen-Hughes, T., et al. (2016) · RNA · doi:10.1261/rna.053959.115 · Cited by 966
Monaco, G., Lee, B., Xu, W., Mustafah, S., Hwang, Y. Y., Carré, C., Burdin, N., Visan, L., Ceccarelli, M., Poidinger, M., et al. (2019) · Cell Reports · doi:10.1016/j.celrep.2019.01.041 · Cited by 958
Kukurba, K. R., & Montgomery, S. B. (2015) · Cold Spring Harbor Protocols · doi:10.1101/pdb.top084970 · Cited by 924
Bias, robustness and scalability in single-cell differential expression analysis
Soneson, C., & Robinson, M. D. (2018) · Nature Methods · doi:10.1038/nmeth.4612 · Cited by 770
Self-citationA comparison of methods for differential expression analysis of RNA-seq data
Soneson, C., & Delorenzi, M. (2013) · BMC Bioinformatics · doi:10.1186/1471-2105-14-91 · Cited by 887
GC-Content Normalization for RNA-Seq Data
Risso, D., Schwartz, K., Sherlock, G., & Dudoit, S. (2011) · BMC Bioinformatics · doi:10.1186/1471-2105-12-480 · Cited by 867
Llorens-Bobadilla, E., Zhao, S., Baser, A., Saiz-Castro, G., Zwadlo, K., & Martin-Villalba, A. (2015) · Cell Stem Cell · doi:10.1016/j.stem.2015.07.002 · Cited by 778
Comprehensive evaluation of differential gene expression analysis methods for RNA-seq data
Rapaport, F., Khanin, R., Liang, Y., Pirun, M., Krek, A., Zumbo, P., Mason, C. E., Socci, N. D., & Betel, D. (2013) · Genome Biology · doi:10.1186/gb-2013-14-9-r95 · Cited by 733
House, I. G., Savas, P., Lai, J., Chen, A. X. Y., Oliver, A. J., Teo, Z. L., Todd, K. L., Henderson, M. A., Giuffrida, L., Petley, E. V., et al. (2020) · Clinical Cancer Research · doi:10.1158/1078-0432.ccr-19-1868 · Cited by 790
TREM2 regulates microglial cholesterol metabolism upon chronic phagocytic challenge
Nugent, A. A., Lin, K., van Lengerich, B., Lianoglou, S., Przybyla, L., Davis, S. S., Llapashtica, C., Wang, J., Kim, D. J., Xia, D., et al. (2020) · Neuron · doi:10.1016/j.neuron.2019.12.007 · Cited by 745
A general and flexible method for signal extraction from single-cell RNA-seq data
Risso, D., Perraudeau, F., Gribkova, S., Dudoit, S., & Vert, J.-P. (2018) · Nature Communications · doi:10.1038/s41467-017-02554-5 · Cited by 718
The m1A landscape on cytosolic and mitochondrial mRNA at single-base resolution
Safra, M., Sas-Chen, A., Nir, R., Winkler, R., Nachshon, A., Bar-Yaacov, D., Erlacher, M., Rossmanith, W., Stern-Ginossar, N., & Schwartz, S. (2017) · Nature · doi:10.1038/nature24456 · Cited by 646
Removing technical variability in RNA-seq data using conditional quantile normalization
Hansen, K. D., Irizarry, R. A., & WU, Z. (2012) · Biostatistics · doi:10.1093/biostatistics/kxr054 · Cited by 607
A genome-wide transcriptomic analysis of protein-coding genes in human blood cells
Uhlen, M., Karlsson, M. J., Zhong, W., Tebani, A., Pou, C., Mikes, J., Lakshmikanth, T., Forsström, B., Edfors, F., Odeberg, J., et al. (2019) · Science · doi:10.1126/science.aax9198 · Cited by 594
Multi-omic machine learning predictor of breast cancer therapy response
Sammut, S.-J., Crispin-Ortuzar, M., Chin, S.-F., Provenzano, E., Bardwell, H. A., Ma, W., Cope, W., Dariush, A., Dawson, S.-J., Abraham, J. E., et al. (2022) · Nature · doi:10.1038/s41586-021-04278-5 · Cited by 654
Rodig, S. J., Gusenleitner, D., Jackson, D. G., Gjini, E., Giobbie-Hurder, A., Jin, C., Chang, H., Lovitch, S. B., Horak, C., Weber, J. S., et al. (2018) · Science Translational Medicine · doi:10.1126/scitranslmed.aar3342 · Cited by 579
Sexual-dimorphism in human immune system aging
Márquez, E. J., Chung, C.-H., Marches, R., Rossi, R. J., Nehar-Belaid, D., Eroglu, A., Mellert, D. J., Kuchel, G. A., Banchereau, J., & Ucar, D. (2020) · Nature Communications · doi:10.1038/s41467-020-14396-9 · Cited by 584
Tsuchida, T., Lee, Y. A., Fujiwara, N., Ybanez, M., Allen, B., Martins, S., Fiel, M. I., Goossens, N., Chou, H.-I., Hoshida, Y., et al. (2018) · Journal of Hepatology · doi:10.1016/j.jhep.2018.03.011 · Cited by 583
HDAC8 mutations in Cornelia de Lange syndrome affect the cohesin acetylation cycle
Deardorff, M. A., Bando, M., Nakato, R., Watrin, E., Itoh, T., Minamino, M., Saitoh, K., Komata, M., Katou, Y., Clark, D., et al. (2012) · Nature · doi:10.1038/nature11316 · Cited by 577
Predicting drug response and synergy using a deep learning model of human cancer cells
Kuenzi, B. M., Park, J., Fong, S. H., Sanchez, K. S., Lee, J., Kreisberg, J. F., Ma, J., & Ideker, T. (2020) · Cancer Cell · doi:10.1016/j.ccell.2020.09.014 · Cited by 544
Leeman, D. S., Hebestreit, K., Ruetz, T., Webb, A. E., McKay, A., Pollina, E. A., Dulken, B. W., Zhao, X., Yeo, R. W., Ho, T. T., et al. (2018) · Science · doi:10.1126/science.aag3048 · Cited by 528
Normalizing single-cell RNA sequencing data: challenges and opportunities
Vallejos, C. A., Risso, D., Scialdone, A., Dudoit, S., & Marioni, J. C. (2017) · Nature Methods · doi:10.1038/nmeth.4292 · Cited by 436
Benchmarking of cell type deconvolution pipelines for transcriptomics data
Avila Cobos, F., Alquicira-Hernandez, J., Powell, J. E., Mestdagh, P., & De Preter, K. (2020) · Nature Communications · doi:10.1038/s41467-020-19015-1 · Cited by 446
Inheritable silencing of endogenous genes by hit-and-run targeted epigenetic editing
Amabile, A., Migliara, A., Capasso, P., Biffi, M., Cittaro, D., Naldini, L., & Lombardo, A. (2016) · Cell · doi:10.1016/j.cell.2016.09.006 · Cited by 516
the BIOS Consortium, van Iterson, M., van Zwet, E. W., & Heijmans, B. T. (2017) · Genome biology · doi:10.1186/s13059-016-1131-9 · Cited by 421
Tsoi, L. C., Rodriguez, E., Degenhardt, F., Baurecht, H., Wehkamp, U., Volks, N., Szymczak, S., Swindell, W. R., Sarkar, M. K., Raja, K., et al. (2019) · Journal of Investigative Dermatology · doi:10.1016/j.jid.2018.12.018 · Cited by 469
Loss of p53 drives neuron reprogramming in head and neck cancer
Amit, M., Takahashi, H., Dragomir, M. P., Lindemann, A., Gleber-Netto, F. O., Pickering, C. R., Anfossi, S., Osman, A. A., Cai, Y., Wang, R., et al. (2020) · Nature · doi:10.1038/s41586-020-1996-3 · Cited by 483
WRN helicase is a synthetic lethal target in microsatellite unstable cancers
Chan, E. M., Shibue, T., McFarland, J. M., Gaeta, B., Ghandi, M., Dumont, N., Gonzalez, A., McPartlan, J. S., Li, T., Zhang, Y., et al. (2019) · Nature · doi:10.1038/s41586-019-1102-x · Cited by 458
IRE1α–XBP1 controls T cell function in ovarian cancer by regulating mitochondrial activity
Song, M., Sandoval, T. A., Chae, C.-S., Chopra, S., Tan, C., Rutkowski, M. R., Raundhal, M., Chaurio, R. A., Payne, K. K., Konrad, C., et al. (2018) · Nature · doi:10.1038/s41586-018-0597-x · Cited by 413
Quiescence Modulates Stem Cell Maintenance and Regenerative Capacity in the Aging Brain
Kalamakis, G., Brüne, D., Ravichandran, S., Bolz, J., Fan, W., Ziebell, F., Stiehl, T., Catalá-Martinez, F., Kupke, J., Zhao, S., et al. (2019) · Cell · doi:10.1016/j.cell.2019.01.040 · Cited by 399
Chen, Y.-J., Roumeliotis, T. I., Chang, Y.-H., Chen, C.-T., Han, C.-L., Lin, M.-H., Chen, H.-W., Chang, G.-C., Chang, Y.-L., Wu, C.-T., et al. (2020) · Cell · doi:10.1016/j.cell.2020.06.012 · Cited by 382
Normalization, testing, and false discovery rate estimation for RNA-sequencing data
Li, J., Witten, D. M., Johnstone, I. M., & Tibshirani, R. (2012) · Biostatistics · doi:10.1093/biostatistics/kxr031 · Cited by 369
Robustly detecting differential expression in RNA sequencing data using observation weights
Zhou, X., Lindsay, H., & Robinson, M. D. (2014) · Nucleic Acids Research · doi:10.1093/nar/gku310 · Cited by 387
Self-citationAnalysis of microbial compositions: a review of normalization and differential abundance analysis
Lin, H., & Peddada, S. D. (2020) · npj Biofilms and Microbiomes · doi:10.1038/s41522-020-00160-w · Cited by 341
Fang, G., Munera, D., Friedman, D. I., Mandlik, A., Chao, M. C., Banerjee, O., Feng, Z., Losic, B., Mahajan, M. C., Jabado, O. J., et al. (2012) · Nature Biotechnology · doi:10.1038/nbt.2432 · Cited by 360
MicroRNAs and their isomiRs function cooperatively to target common biological pathways
Cloonan, N., Wani, S., Xu, Q., Gu, J., Lea, K., Heater, S., Barbacioru, C., Steptoe, A. L., Martin, H. C., Nourbakhsh, E., et al. (2011) · Genome Biology · doi:10.1186/gb-2011-12-12-r126 · Cited by 345
Walter, M., Teissandier, A., Pérez-Palacios, R., & Bourc'his, D. (2016) · eLife · doi:10.7554/elife.11418 · Cited by 303
LC3-Associated Phagocytosis in Myeloid Cells Promotes Tumor Immune Tolerance
Cunha, L. D., Yang, M., Carter, R., Guy, C., Harris, L., Crawford, J. C., Quarato, G., Boada-Romero, E., Kalkavan, H., Johnson, M. D. L., et al. (2018) · Cell · doi:10.1016/j.cell.2018.08.061 · Cited by 334
Microglial NF-κB drives tau spreading and toxicity in a mouse model of tauopathy
Wang, C., Fan, L., Khawaja, R. R., Liu, B., Zhan, L., Kodama, L., Chin, M., Li, Y., Le, D., Zhou, Y., et al. (2022) · Nature Communications · doi:10.1038/s41467-022-29552-6 · Cited by 333
Robertson, C. C., Inshaw, J. R. J., Onengut-Gumuscu, S., Chen, W.-M., Santa Cruz, D. F., Yang, H., Cutler, A. J., Crouch, D. J. M., Farber, E., Bridges, S. L., et al. (2021) · Nature Genetics · doi:10.1038/s41588-021-00880-5 · Cited by 302
RNA-seq: technical variability and sampling
McIntyre, L. M., Lopiano, K. K., Morse, A. M., Amin, V., Oberg, A. L., Young, L. J., & Nuzhdin, S. V. (2011) · BMC Genomics · doi:10.1186/1471-2164-12-293 · Cited by 285
Aanes, H., Winata, C. L., Lin, C. H., Chen, J. P., Srinivasan, K. G., Lee, S. G. P., Lim, A. Y. M., Hajan, H. S., Collas, P., Bourque, G., et al. (2011) · Genome Research · doi:10.1101/gr.116012.110 · Cited by 285
Power analysis and sample size estimation for RNA-Seq differential expression
Ching, T., Huang, S., & Garmire, L. X. (2014) · RNA · doi:10.1261/rna.046011.114 · Cited by 263
QoRTs: a comprehensive toolset for quality control and data processing of RNA-Seq experiments
Hartley, S. W., & Mullikin, J. C. (2015) · BMC Bioinformatics · doi:10.1186/s12859-015-0670-5 · Cited by 259
Franzén, O., Ermel, R., Cohain, A., Akers, N. K., Di Narzo, A., Talukdar, H. A., Foroughi-Asl, H., Giambartolomei, C., Fullard, J. F., Sukhavasi, K., et al. (2016) · Science · doi:10.1126/science.aad6970 · Cited by 288
SCnorm: robust normalization of single-cell RNA-seq data
Bacher, R., Chu, L.-F., Leng, N., Gasch, A. P., Thomson, J. A., Stewart, R. M., Newton, M., & Kendziorski, C. (2017) · Nature Methods · doi:10.1038/nmeth.4263 · Cited by 282
A comparison of statistical methods for detecting differentially expressed genes from RNA‐seq data
Kvam, V. M., Liu, P., & Si, Y. (2012) · American Journal of Botany · doi:10.3732/ajb.1100340 · Cited by 281
Cell-Type-Based Analysis of MicroRNA Profiles in the Mouse Brain
He, M., Liu, Y., Wang, X., Zhang, M. Q., Hannon, G. J., & Huang, Z. J. (2012) · Neuron · doi:10.1016/j.neuron.2011.11.010 · Cited by 277
Sequencing of 640,000 exomes identifies GPR75 variants associated with protection from obesity
Akbari, P., Gilani, A., Sosina, O., Kosmicki, J. A., Khrimian, L., Fang, Y.-Y., Persaud, T., Garcia, V., Sun, D., Li, A., et al. (2021) · Science · doi:10.1126/science.abf8683 · Cited by 276
de Klein, N., Tsai, E. A., Vochteloo, M., Baird, D., Huang, Y., Chen, C.-Y., van Dam, S., Oelen, R., Deelen, P., Bakker, O. B., et al. (2023) · Nature Genetics · doi:10.1038/s41588-023-01300-6 · Cited by 272
Translation control of the immune checkpoint in cancer and its therapeutic targeting
Xu, Y., Poggio, M., Jin, H. Y., Shi, Z., Forester, C. M., Wang, Y., Stumpf, C. R., Xue, L., Devericks, E., So, L., et al. (2019) · Nature Medicine · doi:10.1038/s41591-018-0321-2 · Cited by 261
The genetic basis of parental care evolution in monogamous mice
Bendesky, A., Kwon, Y.-M., Lassance, J.-M., Lewarch, C. L., Yao, S., Peterson, B. K., He, M. X., Dulac, C., & Hoekstra, H. E. (2017) · Nature · doi:10.1038/nature22074 · Cited by 268
An autoimmune stem-like CD8 T cell population drives type 1 diabetes
Gearty, S. V., Dündar, F., Zumbo, P., Espinosa-Carrasco, G., Shakiba, M., Sanchez-Rivera, F. J., Socci, N. D., Trivedi, P., Lowe, S. W., Lauer, P., et al. (2022) · Nature · doi:10.1038/s41586-021-04248-x · Cited by 257
A systematic evaluation of single cell RNA-seq analysis pipelines
Vieth, B., Parekh, S., Ziegenhain, C., Enard, W., & Hellmann, I. (2019) · Nature Communications · doi:10.1038/s41467-019-12266-7 · Cited by 265
Partial exhaustion of CD8 T cells and clinical response to teplizumab in new-onset type 1 diabetes
Long, S. A., Thorpe, J., DeBerg, H. A., Gersuk, V., Eddy, J. A., Harris, K. M., Ehlers, M., Herold, K. C., Nepom, G. T., & Linsley, P. S. (2016) · Science Immunology · doi:10.1126/sciimmunol.aai7793 · Cited by 250
A broken promise: microbiome differential abundance methods do not control the false discovery rate
Hawinkel, S., Mattiello, F., Bijnens, L., & Thas, O. (2019) · Briefings in Bioinformatics · doi:10.1093/bib/bbx104 · Cited by 199
Short, A. K., Fennell, K. A., Perreau, V. M., Fox, A., O’Bryan, M. K., Kim, J. H., Bredy, T. W., Pang, T. Y., & Hannan, A. J. (2016) · Translational Psychiatry · doi:10.1038/tp.2016.109 · Cited by 230
Microglia affect α-synuclein cell-to-cell transfer in a mouse model of Parkinson’s disease
George, S., Rey, N. L., Tyson, T., Esquibel, C., Meyerdirk, L., Schulz, E., Pierce, S., Burmeister, A. R., Madaj, Z., Steiner, J. A., et al. (2019) · Molecular Neurodegeneration · doi:10.1186/s13024-019-0335-3 · Cited by 229
Craig, D. W., O'Shaughnessy, J. A., Kiefer, J. A., Aldrich, J., Sinari, S., Moses, T. M., Wong, S., Dinh, J., Christoforides, A., Blum, J. L., et al. (2013) · Molecular Cancer Therapeutics · doi:10.1158/1535-7163.mct-12-0781 · Cited by 220
Dual targeting of p53 and c-MYC selectively eliminates leukaemic stem cells
Abraham, S. A., Hopcroft, L. E. M., Carrick, E., Drotar, M. E., Dunn, K., Williamson, A. J. K., Korfi, K., Baquero, P., Park, L. E., Scott, M. T., et al. (2016) · Nature · doi:10.1038/nature18288 · Cited by 225
Dynamics and genomic landscape of CD8+ T cells undergoing hepatic priming
Bénéchet, A. P., De Simone, G., Di Lucia, P., Cilenti, F., Barbiera, G., Le Bert, N., Fumagalli, V., Lusito, E., Moalli, F., Bianchessi, V., et al. (2019) · Nature · doi:10.1038/s41586-019-1620-6 · Cited by 222
“Pearson’s correlation was computed for each couple of samples on log transformed RPKM. Read counts were normalized with the Trimmed Mean of M-values (TMM) method 54 using calcNormFactors function and dispersion was estimated with the estimateDisp function.”
Tutorial: guidelines for the experimental design of single-cell RNA sequencing studies
Lafzi, A., Moutinho, C., Picelli, S., & Heyn, H. (2018) · Nature Protocols · doi:10.1038/s41596-018-0073-y · Cited by 218
Roberts, M. D., McCarthy, J. J., Hornberger, T. A., Phillips, S. M., Mackey, A. L., Nader, G. A., Boppart, M. D., Kavazis, A. N., Reidy, P. T., Ogasawara, R., et al. (2023) · Physiological Reviews · doi:10.1152/physrev.00039.2022 · Cited by 214
Best, S. A., De Souza, D. P., Kersbergen, A., Policheni, A. N., Dayalan, S., Tull, D., Rathi, V., Gray, D. H., Ritchie, M. E., McConville, M. J., et al. (2018) · Cell Metabolism · doi:10.1016/j.cmet.2018.02.006 · Cited by 217
Overcoming confounding plate effects in differential expression analyses of single-cell RNA-seq data
Lun, A. T. L., & Marioni, J. C. (2017) · Biostatistics · doi:10.1093/biostatistics/kxw055 · Cited by 159
Transcriptional profiling and therapeutic targeting of oxidative stress in neuroinflammation
Mendiola, A. S., Ryu, J. K., Bardehle, S., Meyer-Franke, A., Ang, K. K.-H., Wilson, C., Baeten, K. M., Hanspers, K., Merlini, M., Thomas, S., et al. (2020) · Nature Immunology · doi:10.1038/s41590-020-0654-0 · Cited by 199
Spatial sorting enables comprehensive characterization of liver zonation
Ben-Moshe, S., Shapira, Y., Moor, A. E., Halpern, K. B., & Itzkovitz, S. (2019) · doi:10.1101/529784 · Cited by 205
Spatial sorting enables comprehensive characterization of liver zonation
Ben-Moshe, S., Shapira, Y., Moor, A. E., Manco, R., Veg, T., Bahar Halpern, K., & Itzkovitz, S. (2019) · Nature Metabolism · doi:10.1038/s42255-019-0109-9 · Cited by 205
Ullman, J. C., Arguello, A., Getz, J. A., Bhalla, A., Mahon, C. S., Wang, J., Giese, T., Bedard, C., Kim, D. J., Blumenfeld, J. R., et al. (2020) · Science Translational Medicine · doi:10.1126/scitranslmed.aay1163 · Cited by 205
The chromatin accessibility signature of human immune aging stems from CD8+ T cells
Ucar, D., Márquez, E. J., Chung, C.-H., Marches, R., Rossi, R. J., Uyar, A., Wu, T.-C., George, J., Stitzel, M. L., Palucka, A. K., et al. (2017) · Journal of Experimental Medicine · doi:10.1084/jem.20170416 · Cited by 200
Robles, J. A., Qureshi, S. E., Stephen, S. J., Wilson, S. R., Burden, C. J., & Taylor, J. M. (2012) · BMC Genomics · doi:10.1186/1471-2164-13-484 · Cited by 198
Intermuscular adipose tissue directly modulates skeletal muscle insulin sensitivity in humans
Sachs, S., Zarini, S., Kahn, D. E., Harrison, K. A., Perreault, L., Phang, T., Newsom, S. A., Strauss, A., Kerege, A., Schoen, J. A., et al. (2019) · American Journal of Physiology-Endocrinology and Metabolism · doi:10.1152/ajpendo.00243.2018 · Cited by 192
Inhibiting glutaminase in acute myeloid leukemia: metabolic dependency of selected AML subtypes
Matre, P., Velez, J., Jacamo, R., Qi, Y., Su, X., Cai, T., Chan, S. M., Lodi, A., Sweeney, S. R., Ma, H., et al. (2016) · Oncotarget · doi:10.18632/oncotarget.12944 · Cited by 185
He, L., Davila-Velderrain, J., Sumida, T. S., Hafler, D. A., Kellis, M., & Kulminski, A. M. (2021) · Communications Biology · doi:10.1038/s42003-021-02146-6 · Cited by 181
A Comprehensive Mouse Transcriptomic BodyMap across 17 Tissues by RNA-seq
Li, B., Qing, T., Zhu, J., Wen, Z., Yu, Y., Fukumura, R., Zheng, Y., Gondo, Y., & Shi, L. (2017) · Scientific Reports · doi:10.1038/s41598-017-04520-z · Cited by 184
Messmer, T., von Meyenn, F., Savino, A., Santos, F., Mohammed, H., Lun, A. T. L., Marioni, J. C., & Reik, W. (2019) · Cell Reports · doi:10.1016/j.celrep.2018.12.099 · Cited by 156
Metadata
- Authors
- Robinson, M. D., & Oshlack, A.
- Affiliations
- Garvan Institute of Medical Research (AU)
- Walter and Eliza Hall Institute of Medical Research (AU)
- Corresponding author
- Robinson, Mark D
- Oshlack, Alicia
- Venue
- Genome Biology
- Published
- 2010-03-02
- Volume
- 11
- Issue
- 3
- Pages
- R25-R25
- ISSN
- 1465-6906 (ISSN-L)
- 1474-760X
- PMC
- PMC2864565
- OpenAlex
- W2107018762
- Cited by
- 7,876
- References
- 25
- Citations by year
- 2026: 452 · 2025: 604 · 2024: 832 · 2023: 700 · 2022: 773 · 2021: 1010 · 2020: 730 · 2019: 610 · 2018: 540 · 2017: 440 · 2016: 348 · 2015: 285 · 2014: 222 · 2013: 153 · 2012: 100
- FWCI
- 41.77
- Type
- journal article
- Language
- en
- Open access
- gold
- doi.org
- Locations
- Genome biology (publishedVersion, cc-by)
- Europe PMC (PubMed Central) (publishedVersion, cc-by)
- PubMed Central (publishedVersion, cc-by)
- PubMed (publishedVersion)
- Minerva Access (University of Melbourne) (submittedVersion, cc-by)
- Funders
- Medical Research Council
- National Health and Medical Research Council (490037)
- Topics
- Life Sciences › Biochemistry, Genetics and Molecular Biology › Molecular Biology › Gene expression and cancer classification
- Life Sciences › Biochemistry, Genetics and Molecular Biology › Molecular Biology › Genomics and Phylogenetic Studies
- Life Sciences › Biochemistry, Genetics and Molecular Biology › Molecular Biology › Single-cell and spatial transcriptomics
- Keywords
- RNA-seq, normalization, differential gene expression, transcriptome, gene expression, read count normalization
- MeSH terms
- Base Sequence, Computer Simulation, RNA, Models, Statistical, Gene Library, Gene Expression Profiling
About these checks
Registry, retraction, Cites and statistics results are computed, not judged, with one exception: a printed reference that no index lists is read once by a model before it counts as a citation error. Claims are extracted by a model and kept only when their quote appears verbatim in the text; each cited source is then checked, with a model’s help, for whether it says what the claim relies on. Those verdicts can be wrong — read the claim’s quote and the cited source before relying on one.
Statistics and arithmetic are recomputed, not judged.
Confidence bands are shown only for fields calibrated on our annotated test set. None is calibrated yet, so no band is shown.
What counts as a claim ›How we measure confidence ›How we check this ›
Are you an author, or do you see a problem with this page? Request a review
