

The DOI matches its Crossref record; 30 of the 31 references it cites were found in a registry or an index.
Population-specificity of human DNA methylation
Open accessAbstract
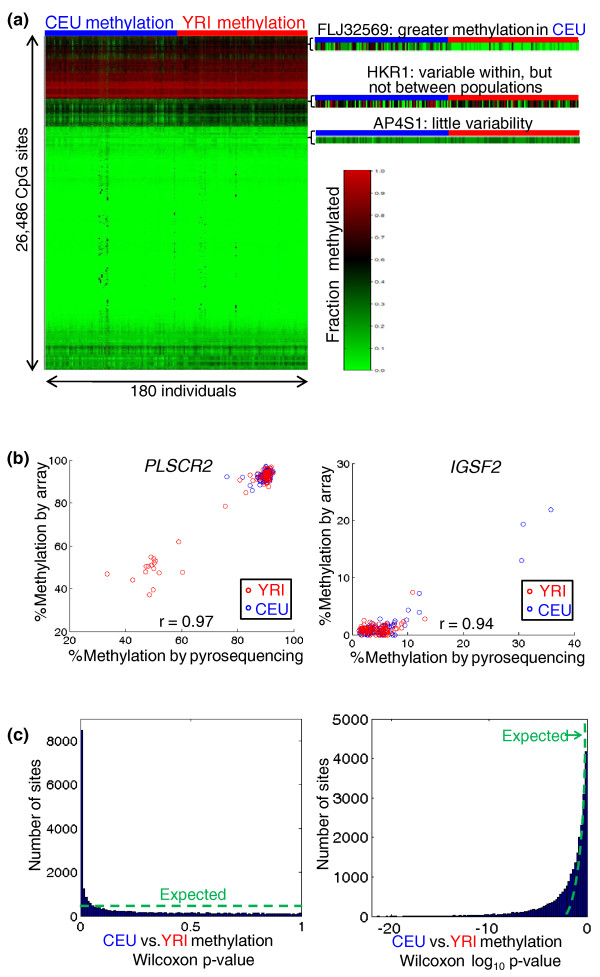
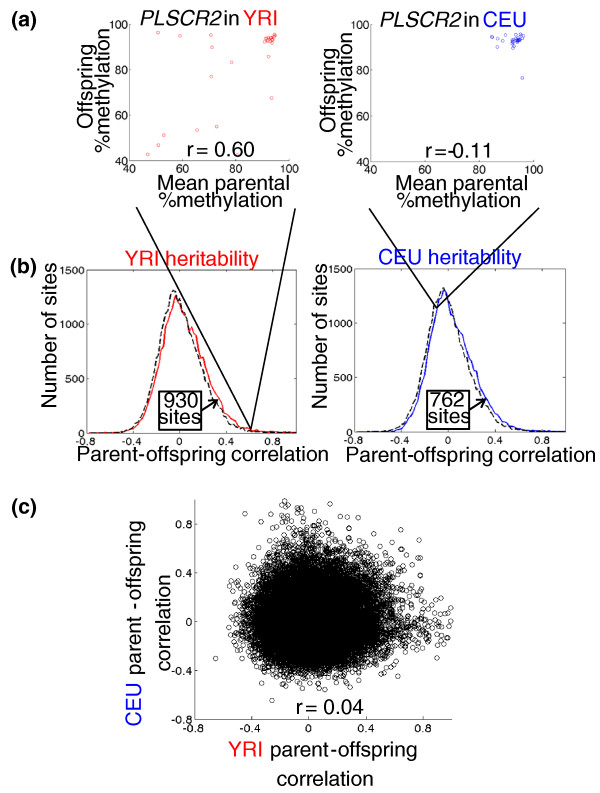
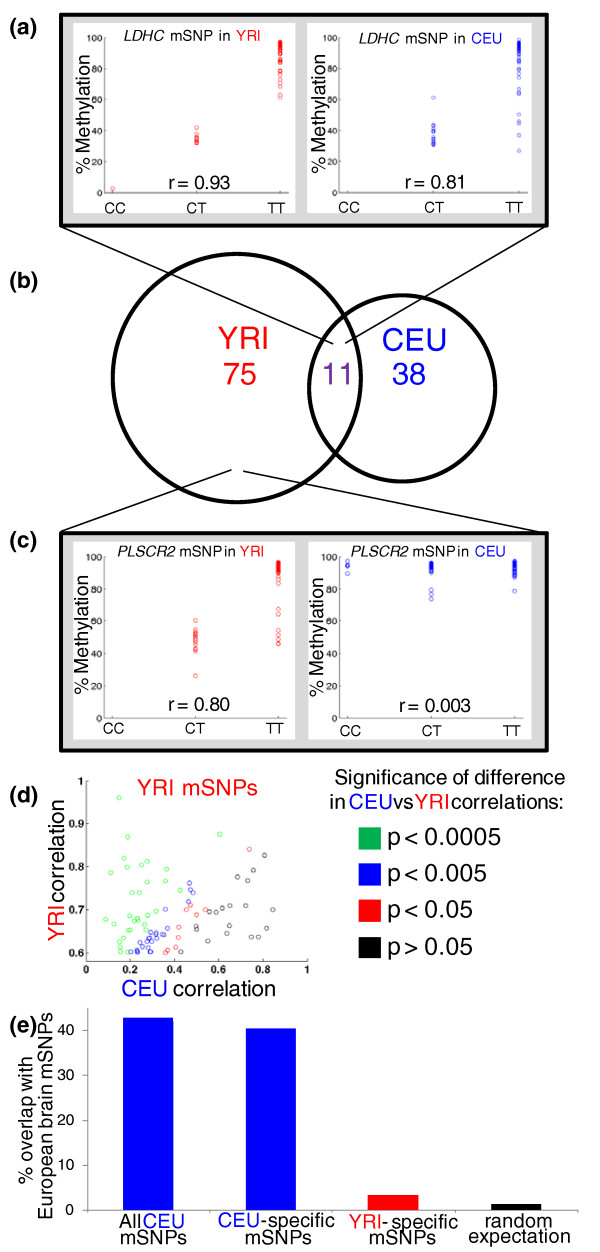
BACKGROUND: Ethnic differences in human DNA methylation have been shown for a number of CpG sites, but the genome-wide patterns and extent of these differences are largely unknown. In addition, whether the genetic control of polymorphic DNA methylation is population-specific has not been investigated. RESULTS: Here we measure DNA methylation near the transcription start sites of over 14, 000 genes in 180 cell lines derived from one African and one European population. We find population-specific patterns of DNA methylation at over a third of all genes. Furthermore, although the methylation at over a thousand CpG sites is heritable, these heritabilities also differ between populations, suggesting extensive divergence in the genetic control of DNA methylation. In support of this, genetic mapping of DNA methylation reveals that most of the population specificity can be explained by divergence in allele frequencies between populations, and that there is little overlap in genetic associations between populations. These population-specific genetic associations are supported by the patterns of DNA methylation in several hundred brain samples, suggesting that they hold in vivo and across tissues. CONCLUSIONS: These results suggest that DNA methylation is highly divergent between populations, and that this divergence may be due in large part to a combination of differences in allele frequencies and complex epistasis or gene × environment interactions.
Overview
The claims and statistics of this paper haven’t been checked yet.
Run the check — free, no account needed. It reads the open-access text and checks the sources it cites.
Integrity signals
Registry
Cites
Statistics
Figures
Verification
Claims the paper makes
The claims and statistics of this paper haven’t been checked yet.
Run the check — free, no account needed. It reads the open-access text and checks the sources it cites.
Claims other papers make about this one
Each is checked against this paper’s own text: does it say what the citing paper says it does?
The cited source says what the claim attributes to it.
In the citing paper
“Biological confounders known to affect epigenetic patterns such as age (Xiao, Wang, & Kong, 2019), sex (Yousefi et al., 2015), ethnicity (Fraser, Lam, Neumann, & Kobor, 2012), body mass index (Sayols-Baixeras et al., 2017), smoking behavior (Li et al., 2018) or nutritional aspects (Gadecka & Bielak-Zmijewska, 2019) may introduce critical biases limiting the interpretation of epigenetic data.”
From The applied implications of epigenetics in anxiety, affective and stress-related disorders - A review and synthesis on psychosocial stress, psychotherapy and prevention (2020) · cites this paper as Fraser, Lam, Neumann, & Kobor, 2012
Self-check
Percentages, sums and reported differences re-computed from the paper’s own numbers.
The self-check needs the paper’s full text.
Citations
Cites
A map of human genome variation from population-scale sequencing.
The 1000 Genomes Project Consortium (2010) · Nature · doi:10.1038/nature09534 · Cited by 7,877
Jaenisch, R., & Bird, A. (2003) · Nature Genetics · doi:10.1038/ng1089 · Cited by 6,325
Genetics and Analysis of Quantitative Traits
(2002) · Journal of Animal Breeding and Genetics · doi:10.1046/j.1439-0388.2002.00356.x · Cited by 6,176
Establishing, maintaining and modifying DNA methylation patterns in plants and animals
Law, J. A., & Jacobsen, S. E. (2010) · Nature Reviews Genetics · doi:10.1038/nrg2719 · Cited by 3,925
Integrating common and rare genetic variation in diverse human populations
The International HapMap 3 Consortium (2010) · Nature · doi:10.1038/nature09298 · Cited by 3,026
DNA methylation profiling of human chromosomes 6, 20 and 22
Eckhardt, F., Lewin, J., Cortese, R., Rakyan, V. K., Attwood, J., Burger, M., Burton, J. H., Cox, T. V., Davies, R., Down, T. A., et al. (2006) · Nature Genetics · doi:10.1038/ng1909 · Cited by 1,378
Understanding mechanisms underlying human gene expression variation with RNA sequencing
Pickrell, J. K., Marioni, J. C., Pai, A. A., Degner, J. F., Engelhardt, B. E., Nkadori, E., Veyrieras, J.-B., Stephens, M., Gilad, Y., & Pritchard, J. K. (2010) · Nature · doi:10.1038/nature08872 · Cited by 1,256
Illingworth, R. S., & Bird, A. P. (2009) · FEBS Letters · doi:10.1016/j.febslet.2009.04.012 · Cited by 940
Molecular Signals of Epigenetic States
Bonasio, R., Tu, S., & Reinberg, D. (2010) · Science · doi:10.1126/science.1191078 · Cited by 912
DNA methylation patterns associate with genetic and gene expression variation in HapMap cell lines
Bell, J. T., Pai, A. A., Pickrell, J. K., Gaffney, D. J., Pique-Regi, R., Degner, J. F., Gilad, Y., & Pritchard, J. K. (2011) · Genome Biology · doi:10.1186/gb-2011-12-1-r10 · Cited by 838
Cited by
Sorted by citations
DNA methylation age of human tissues and cell types
Horvath, S. (2013) · Genome Biology · doi:10.1186/gb-2013-14-10-r115 · Cited by 7,075
DNA methylation and healthy human aging
Jones, M. J., Goodman, S. J., & Kobor, M. S. (2015) · Aging Cell · doi:10.1111/acel.12349 · Cited by 973
Self-citationSystematic identification of genetic influences on methylation across the human life course
Gaunt, T. R., Shihab, H. A., Hemani, G., Min, J. L., Woodward, G., Lyttleton, O., Zheng, J., Duggirala, A., McArdle, W. L., Ho, K., et al. (2016) · Genome Biology · doi:10.1186/s13059-016-0926-z · Cited by 598
Price, E. M., Cotton, A. M., Lam, L. L. C., Farré, P., Emberly, E. G., Brown, C. J., Robinson, W. P., & Kobor, M. S. (2013) · Epigenetics & Chromatin · doi:10.1186/1756-8935-6-4 · Cited by 494
Self-citationFactors underlying variable DNA methylation in a human community cohort
Lam, L. L., Emberly, E., Fraser, H. B., Neumann, S. M., Chen, E., Miller, G. E., & Kobor, M. S. (2012) · Proceedings of the National Academy of Sciences · doi:10.1073/pnas.1121249109 · Cited by 476
Self-citationWagner, J. R., Busche, S., Ge, B., Kwan, T., Pastinen, T., & Blanchette, M. (2014) · Genome biology · doi:10.1186/gb-2014-15-2-r37 · Cited by 446
DNA methylation contributes to natural human variation
Heyn, H., Moran, S., Hernando-Herraez, I., Sayols, S., Gomez, A., Sandoval, J., Monk, D., Hata, K., Marques-Bonet, T., Wang, L., et al. (2013) · Genome Research · doi:10.1101/gr.154187.112 · Cited by 408
Identification of 55,000 Replicated DNA Methylation QTL
McRae, A. F., Marioni, R. E., Shah, S. H., Yang, J., Powell, J. E., Harris, S. E., Gibson, J., Henders, A. K., Bowdler, L. M., Painter, J. N., et al. (2018) · Scientific Reports · doi:10.1038/s41598-018-35871-w · Cited by 360
Teh, A. L., Pan, H., Chen, L., Ong, M.-L., Dogra, S., Wong, J., MacIsaac, J. L., Mah, S. M., McEwen, L. M., Saw, S.-M., et al. (2014) · Genome Research · doi:10.1101/gr.171439.113 · Cited by 352
Self-citationReconstructing A/B compartments as revealed by Hi-C using long-range correlations in epigenetic data
Fortin, J.-P., & Hansen, K. D. (2015) · Genome Biology · doi:10.1186/s13059-015-0741-y · Cited by 333
Differences in smoking associated DNA methylation patterns in south asians and europeans
Elliott, H. R., Tillin, T., McArdle, W. L., Ho, K., Duggirala, A., Frayling, T. M., Davey Smith, G., Hughes, A. D., Chaturvedi, N., & Relton, C. L. (2014) · Clinical Epigenetics · doi:10.1186/1868-7083-6-4 · Cited by 282
Genomics of disease risk in globally diverse populations
Gurdasani, D., Barroso, I., Zeggini, E., & Sandhu, M. S. (2019) · Nature Reviews Genetics · doi:10.1038/s41576-019-0144-0 · Cited by 312
Genetic impacts on DNA methylation: research findings and future perspectives
Villicaña, S., & Bell, J. T. (2021) · Genome biology · doi:10.1186/s13059-021-02347-6 · Cited by 267
DNA methylation and childhood asthma in the inner city
Yang, I. V., Pedersen, B. S., Liu, A., O’Connor, G. T., Teach, S. J., Kattan, M., Misiak, R. T., Gruchalla, R. S., Steinbach, S., Szefler, S. J., et al. (2015) · Journal of Allergy and Clinical Immunology · doi:10.1016/j.jaci.2015.01.025 · Cited by 235
Review of processing and analysis methods for DNA methylation array data
Wilhelm-Benartzi, C. S., Koestler, D. C., Karagas, M. R., Flanagan, J. M., Christensen, B. C., Kelsey, K. T., Marsit, C. J., Houseman, E. A., & Brown, R. E. (2013) · British Journal of Cancer · doi:10.1038/bjc.2013.496 · Cited by 210
African genetic diversity and adaptation inform a precision medicine agenda
Pereira, L., Mutesa, L., Tindana, P. O., & Ramsay, M. (2021) · Nature Reviews Genetics · doi:10.1038/s41576-020-00306-8 · Cited by 194
Mulder, R. H., Neumann, A., Cecil, C. A. M., Walton, E., Houtepen, L. C., Simpkin, A. J., Rijlaarsdam, J., Heijmans, B. T., Gaunt, T. R., Felix, J. F., et al. (2021) · Human Molecular Genetics · doi:10.1093/hmg/ddaa280 · Cited by 165
Identification and evaluation of age-correlated DNA methylation markers for forensic use
Park, J., Kim, J.-H., Seo, E., Bae, D. H., Kim, S., Lee, H., Woo, K., & Kim, Y. S. (2016) · Forensic Science International Genetics · doi:10.1016/j.fsigen.2016.03.005 · Cited by 176
Human Immunology through the Lens of Evolutionary Genetics
Quintana‐Murci, L. (2019) · Cell · doi:10.1016/j.cell.2019.02.033 · Cited by 182
DNA methylation signature of human fetal alcohol spectrum disorder
Portales-Casamar, É., Lussier, A. A., Jones, M. J., MacIsaac, J. L., Edgar, R. D., Mah, S. M., Barhdadi, A., Provost, S., Perreault, L. L., Cynader, M. S., et al. (2016) · Epigenetics & Chromatin · doi:10.1186/s13072-016-0074-4 · Cited by 175
Self-citationGenetic sources of population epigenomic variation
Taudt, A., Colomé‐Tatché, M., & Johannes, F. M. (2016) · Nature Reviews Genetics · doi:10.1038/nrg.2016.45 · Cited by 166
The nasal methylome and childhood atopic asthma
Yang, I. V., Pedersen, B. S., Liu, A. H., O’Connor, G. T., Pillai, D. K., Kattan, M., Misiak, R. T., Gruchalla, R. S., Szefler, S. J., Hershey, G. K. K., et al. (2016) · Journal of Allergy and Clinical Immunology · doi:10.1016/j.jaci.2016.07.036 · Cited by 163
Schiele, M. A., Gottschalk, M. G., & Domschke, K. (2020) · Clinical Psychology Review · doi:10.1016/j.cpr.2020.101830 · Cited by 156
A novel strategy for forensic age prediction by DNA methylation and support vector regression model
Xu, C., Qu, H., Wang, G., Xie, B., Shi, Y., Yang, Y., Zhao, Z., Hu, L., Fang, X., Yan, J., et al. (2015) · Scientific Reports · doi:10.1038/srep17788 · Cited by 155
Development and the epigenome: the ‘synapse’ of gene–environment interplay
Boyce, W. T., & Kobor, M. S. (2014) · Developmental Science · doi:10.1111/desc.12282 · Cited by 160
Self-citationEpigenetic mechanisms and the development of asthma
Yang, I. V., & Schwartz, D. A. (2012) · Journal of Allergy and Clinical Immunology · doi:10.1016/j.jaci.2012.07.052 · Cited by 154
Husquin, L. T., Rotival, M., Fagny, M., Quach, H., Zidane, N., McEwen, L. M., MacIsaac, J. L., Kobor, M. S., Aschard, H., Patin, É., et al. (2018) · Genome biology · doi:10.1186/s13059-018-1601-3 · Cited by 149
Self-citationGenome-wide methylation data mirror ancestry information
Rahmani, E., Shenhav, L., Schweiger, R., Yousefi, P., Huen, K., Eskenazi, B., Eng, C. S., Huntsman, S., Hu, D., Galanter, J., et al. (2017) · Epigenetics & Chromatin · doi:10.1186/s13072-016-0108-y · Cited by 140
Mendizabal, I., Keller, T. E., Zeng, J., & Yi, S. V. (2014) · Integrative and Comparative Biology · doi:10.1093/icb/icu040 · Cited by 139
DNA methylation: Insights into human evolution
Hernando-Herraez, I., Garcia-Perez, R., Sharp, A. J., & Marques-Bonet, T. (2015) · PLOS Genetics · doi:10.1371/journal.pgen.1005661 · Cited by 128
Moen, E. L., Zhang, X., Mu, W., Delaney, S. M., Wing, C., McQuade, J. L., Myers, J. L., Godley, L. A., Dolan, M. E., & Zhang, W. (2013) · Genetics · doi:10.1534/genetics.113.151381 · Cited by 134
Sex differences in disease genetics: evidence, evolution, and detection
Gilks, W. P., Abbott, J. K., & Morrow, E. H. (2014) · Trends in Genetics · doi:10.1016/j.tig.2014.08.006 · Cited by 128
DNA methylation and application in forensic sciences
Kader, F., & Ghai, M. (2015) · Forensic Science International · doi:10.1016/j.forsciint.2015.01.037 · Cited by 132
Retention of paternal DNA methylome in the developing zebrafish germline
Skvortsova, K., Tarbashevich, K., Stehling, M., Lister, R., Irimia, M., Raz, E., & Bogdanović, O. (2019) · Nature Communications · doi:10.1038/s41467-019-10895-6 · Cited by 126
Pooled ChIP-Seq Links Variation in Transcription Factor Binding to Complex Disease Risk
Tehranchi, A. K., Myrthil, M., Martin, T., Hie, B. L., Golan, D., & Fraser, H. B. (2016) · Cell · doi:10.1016/j.cell.2016.03.041 · Cited by 120
Self-citationDNA methylation-based variation between human populations
Kader, F., & Ghai, M. (2016) · Molecular Genetics and Genomics · doi:10.1007/s00438-016-1264-2 · Cited by 126
on behalf of the GUSTO study group, Lin, X., Lim, I. Y., Wu, Y., Teh, A. L., Chen, L., Aris, I. M., Soh, S., Tint, M. T., MacIsaac, J. L., et al. (2017) · BMC Medicine · doi:10.1186/s12916-017-0800-1 · Cited by 120
Self-citationBush, N. R., Edgar, R. D., Park, M., MacIsaac, J. L., McEwen, L. M., Adler, N. E., Essex, M. J., Kobor, M. S., & Boyce, W. T. (2018) · Epigenomics · doi:10.2217/epi-2018-0042 · Cited by 120
“Ancestry is one of the stronger predictors of variation in DNA methylation [31–33] , and a recent recommendation suggested accounting for confounding genetic variation within epigenome-wide analyses [34] .”
Self-citationIs There a Link Between Genome-Wide Hypomethylation in Blood and Cancer Risk?
Brennan, K., & Flanagan, J. M. (2012) · Cancer Prevention Research · doi:10.1158/1940-6207.capr-12-0316 · Cited by 111
Grafodatskaya, D., Chung, B. H., Butcher, D. T., Turinsky, A. L., Goodman, S. J., Choufani, S., Chen, Y. A., Lou, Y., Zhao, C., Rajendram, R., et al. (2013) · BMC Medical Genomics · doi:10.1186/1755-8794-6-1 · Cited by 103
King, K. E., Murphy, S. K., & Hoyo, C. (2015) · Journal of Epidemiology & Community Health · doi:10.1136/jech-2014-204781 · Cited by 98
The epigenomic landscape of African rainforest hunter-gatherers and farmers
Fagny, M., Patin, É., MacIsaac, J. L., Rotival, M., Flutre, T., Jones, M. J., Siddle, K. J., Quach, H., Harmant, C., McEwen, L. M., et al. (2015) · Nature Communications · doi:10.1038/ncomms10047 · Cited by 97
Self-citationGenome-wide epigenomic profiling for biomarker discovery
Dirks, R. A. M., Stunnenberg, H. G., & Marks, H. (2016) · Clinical Epigenetics · doi:10.1186/s13148-016-0284-4 · Cited by 94
Epigenetics Studies of Fetal Alcohol Spectrum Disorder: Where are We Now?
Lussier, A. A., Weinberg, J., & Kobor, M. S. (2017) · Epigenomics · doi:10.2217/epi-2016-0163 · Cited by 105
Self-citationTrends in DNA Methylation with Age Replicate Across Diverse Human Populations
Gopalan, S., Carja, O., Fagny, M., Patin, É., Myrick, J. W., McEwen, L. M., Mah, S. M., Kobor, M. S., Froment, A., Feldman, M. W., et al. (2017) · Genetics · doi:10.1534/genetics.116.195594 · Cited by 88
Self-citationDNA methylation studies using twins: what are they telling us?
Bell, J. T., & Spector, T. D. (2012) · Genome Biology · doi:10.1186/gb-2012-13-10-172 · Cited by 89
Linkage of DNA Methylation Quantitative Trait Loci to Human Cancer Risk
Heyn, H., Sayols, S., Moutinho, C., Vidal, E., Sanchez-Mut, J. V., Stefánsson, Ó. A., Nadal, E., Morán, S., Eyfjord, J. E., González‐Suárez, E., et al. (2014) · Cell Reports · doi:10.1016/j.celrep.2014.03.016 · Cited by 87
“…epitype (displaying DNA methylation levels at a given cytosine in the genome) has been determined for natural human variation (Bell et al., 2011; Fraser et al., 2012; Heyn et al., 2013), neurological disorders (Gibbs et al., 2010; Zhang et al., 2010), and rheumatoid arthritis (Liu et al.,…”
Sharp, G. C., Arathimos, R., Reese, S. E., Page, C. M., Felix, J. F., Küpers, L. K., Rifas‐Shiman, S. L., Liu, C., The Cohorts for Heart and Aging Research in Genomic Epidemiology plus (CHARGE +) methylation alcohol working group, Burrows, K., et al. (2017) · Epigenomics · doi:10.2217/epi-2017-0095 · Cited by 86
Principles and Challenges of Applying Epigenetic Epidemiology to Psychology
Jones, M. J., Moore, S. R., & Kobor, M. S. (2017) · Annual Review of Psychology · doi:10.1146/annurev-psych-122414-033653 · Cited by 94
Self-citationDNA methylation and brain structure and function across the life course: A systematic review
Wheater, E., Stoye, D. Q., Cox, S. R., Wardlaw, J. M., Drake, A. J., Bastin, M. E., & Boardman, J. P. (2020) · Neuroscience & Biobehavioral Reviews · doi:10.1016/j.neubiorev.2020.03.007 · Cited by 85
LINE-1 and EPAS1 DNA methylation associations with high-altitude exposure
Childebayeva, A., Jones, T. R., Goodrich, J. M., Lèon‐Velarde, F., Rivera, M. C., Kiyamu, M., Brutsaert, T. D., Dolinoy, D. C., & Bigham, A. W. (2018) · Epigenetics · doi:10.1080/15592294.2018.1561117 · Cited by 86
Nassar, F. J., Msheik, Z. S., Nasr, R., & Temraz, S. N. (2021) · Clinical Epigenetics · doi:10.1186/s13148-021-01095-5 · Cited by 85
Worldwide patterns of human epigenetic variation
Carja, O., MacIsaac, J. L., Mah, S. M., Henn, B. M., Kobor, M. S., Feldman, M. W., & Fraser, H. B. (2017) · Nature Ecology & Evolution · doi:10.1038/s41559-017-0299-z · Cited by 80
Self-citationXi, Y., Lin, Y., Guo, W., Wang, X., Zhao, H., Miao, C., Liu, W., Liu, Y., Liu, T., Luo, Y., et al. (2022) · Signal Transduction and Targeted Therapy · doi:10.1038/s41392-022-00873-8 · Cited by 79
Mitochondrial Genomic Backgrounds Affect Nuclear DNA Methylation and Gene Expression
Vivian, C. J., Brinker, A. E., Graw, S., Koestler, D. C., Legendre, C., Gooden, G. C., Salhia, B., & Welch, D. R. (2017) · Cancer Research · doi:10.1158/0008-5472.can-17-1473 · Cited by 79
Chung, S. A., Nititham, J., Elboudwarej, E., Quach, H., Taylor, K. E., Barcellos, L. F., & Criswell, L. A. (2015) · PLoS ONE · doi:10.1371/journal.pone.0129813 · Cited by 78
Megabase-scale methylation phasing using nanopore long reads and NanoMethPhase
Akbari, V., Garant, J., O’Neill, K., Pandoh, P. K., Moore, R. A., Marra, M. A., Hirst, M., & Jones, S. J. M. (2021) · Genome biology · doi:10.1186/s13059-021-02283-5 · Cited by 79
Islam, S. A., Goodman, S. J., MacIsaac, J. L., Obradović, J., Barr, R. G., Boyce, W. T., & Kobor, M. S. (2019) · Epigenetics & Chromatin · doi:10.1186/s13072-018-0245-6 · Cited by 74
Self-citationDiscordance of DNA Methylation Variance Between two Accessible Human Tissues
Jiang, R., Jones, M. J., Chen, E., Neumann, S., Fraser, H. B., Miller, G. E., & Kobor, M. S. (2015) · Scientific Reports · doi:10.1038/srep08257 · Cited by 73
Self-citationAccurate ethnicity prediction from placental DNA methylation data
Yuan, V., Price, E. M., Gobbo, G. F. D., Mostafavi, S., Cox, B., Binder, A. M., Michels, K. B., Marsit, C. J., & Robinson, W. P. (2019) · Epigenetics & Chromatin · doi:10.1186/s13072-019-0296-3 · Cited by 72
Comparison of different cell type correction methods for genome-scale epigenetics studies
Kaushal, A., Zhang, H., Karmaus, W., Ray, M. A., Torres, M. A., Smith, A. K., & Wang, S. (2017) · BMC Bioinformatics · doi:10.1186/s12859-017-1611-2 · Cited by 70
Exposure to Maternal Diabetes in Utero and DNA Methylation Patterns in the Offspring
West, N. A., Kechris, K. J., & Dabelea, D. (2013) · Immunometabolism · doi:10.2478/immun-2013-0001 · Cited by 70
Dong, H., Wang, Y., Zou, Z., Chen, L., Shen, C.-Y., Xu, S., Zhang, J., Zhao, F., Ge, S., Gao, Q., et al. (2016) · Reproductive Sciences · doi:10.1177/1933719116650755 · Cited by 69
Fine-mapping cis-regulatory variants in diverse human populations
Tehranchi, A. K., Hie, B., Dacre, M., Kaplow, I. M., Pettie, K. P., Combs, P. A., & Fraser, H. B. (2019) · eLife · doi:10.7554/elife.39595 · Cited by 69
Self-citationEpigenetics: It's Getting Old. Past Meets Future in Paleoepigenetics
Gokhman, D., Meshorer, E., & Carmel, L. (2016) · Trends in Ecology & Evolution · doi:10.1016/j.tree.2016.01.010 · Cited by 67
Wang, Y., Wang, X., Lee, T., Mansoor, S., & Paterson, A. H. (2013) · New Phytologist · doi:10.1111/nph.12137 · Cited by 65
Miyake, K., Kawaguchi, A., Miura, R., Kobayashi, S., Tran, N. Q. V., Kobayashi, S., Miyashita, C., Araki, A., Kubota, T., Yamagata, Z., et al. (2018) · Scientific Reports · doi:10.1038/s41598-018-23772-x · Cited by 63
Busch, R. S., Qiu, W., Lasky-Su, J. A., Morrow, J. D., Criner, G. J., & DeMeo, D. L. (2016) · Respiratory Research · doi:10.1186/s12931-016-0459-8 · Cited by 62
Nilsson, E., & Ling, C. (2017) · Clinical Epigenetics · doi:10.1186/s13148-017-0399-2 · Cited by 68
Racial/ethnic disparities in human DNA methylation
Xia, Y., Ding, Y., Liu, X., Chen, X.-M., Cheng, S., Li, L.-B., Ma, M., He, J., & Wang, Y. (2014) · Biochimica et Biophysica Acta (BBA) - Reviews on Cancer · doi:10.1016/j.bbcan.2014.07.001 · Cited by 63
On the Analysis of the Illumina 450k Array Data: Probes Ambiguously Mapped to the Human Genome
Zhang, X., Mu, W., & Zhang, W. (2012) · Frontiers in Genetics · doi:10.3389/fgene.2012.00073 · Cited by 62
Ancestry Dependent DNA Methylation and Influence of Maternal Nutrition
Mozhui, K., Smith, A. K., & Tylavsky, F. A. (2015) · PLoS ONE · doi:10.1371/journal.pone.0118466 · Cited by 61
Global Properties and Functional Complexity of Human Gene Regulatory Variation
Gaffney, D. J. (2013) · PLoS Genetics · doi:10.1371/journal.pgen.1003501 · Cited by 61
The missing diversity in human epigenomic studies
Breeze, C. E., Beck, S., Berndt, S. I., & Franceschini, N. (2022) · Nature Genetics · doi:10.1038/s41588-022-01081-4 · Cited by 57
Epigenomics and the Regulation of Aging
Boyd-Kirkup, J. D., Green, C. D., Wu, G., Wang, D., & Han, J. J. (2013) · Epigenomics · doi:10.2217/epi.13.5 · Cited by 57
Venney, C. J., Wellband, K. W., & Heath, D. D. (2020) · Heredity · doi:10.1038/s41437-020-0346-4 · Cited by 56
“While methylation has been repeatedly shown to be influenced by underlying genetic factors (Herrera and Bazaga 2010; Fraser et al. 2012; Liu et al. 2012), it is unclear whether G × E interactions result in another layer of complexity underlying variation in DNA methylation.”
BackgroundAn Exploratory Association Study of Alcohol Use Disorder and DNA Methylation
Hagerty, S. L., Bidwell, L. C., Harlaar, N., & Hutchison, K. E. (2016) · Alcoholism Clinical and Experimental Research · doi:10.1111/acer.13138 · Cited by 54
MethylToSNP: identifying SNPs in Illumina DNA methylation array data
LaBarre, B. A., Goncearenco, A., Petrykowska, H. M., Jaratlerdsiri, W., Bornman, R. M. S., Hayes, V. M., & Elnitski, L. L. (2019) · Epigenetics & Chromatin · doi:10.1186/s13072-019-0321-6 · Cited by 52
DNA methylation, genotype and gene expression: who is driving and who is along for the ride?
Jones, M. J., Fejes, A. P., & Kobor, M. S. (2013) · Genome biology · doi:10.1186/gb-2013-14-7-126 · Cited by 56
Self-citationGenetic ancestry plays a central role in population pharmacogenomics
Yang, H., Chen, C., Lin, Y., & Chu, S. (2021) · Communications Biology · doi:10.1038/s42003-021-01681-6 · Cited by 51
“01; and (4) SNPs and/or RVs for SNVs with a nonzero minor allele frequency of ≤0.”
InfluentialEvolutionary and population (epi)genetics of immunity to infection
Barreiro, L. B., & Quintana‐Murci, L. (2020) · Human Genetics · doi:10.1007/s00439-020-02167-x · Cited by 53
Lin, P.-C., Lin, J.-K., Lin, C., Lin, H., Yang, S.-H., Jiang, J., Chen, W.-S., Chou, C.-C., Tsai, S., & Chang, S. (2014) · Annals of Surgical Oncology · doi:10.1245/s10434-014-4277-2 · Cited by 48
The evaluation of seven age-related CpGs for forensic purpose in blood from Chinese Han population
Pan, C., Yi, S., Xiao, C., Huang, Y., Chen, X., & Huang, D. (2020) · Forensic Science International Genetics · doi:10.1016/j.fsigen.2020.102251 · Cited by 48
Detection of colorectal cancer in urine using DNA methylation analysis
Bach, S., Paulis, I., Sluiter, N. R., Tibbesma, M., Martin, I., van de Wiel, M. A., Tuynman, J. B., Bahce, I., Geert Kazemier, M., & Steenbergen, R. D. M. (2021) · Scientific Reports · doi:10.1038/s41598-021-81900-6 · Cited by 47
A biosocial return to race? A cautionary view for the postgenomic era
Meloni, M., Moll, T., Issaka, A., & Kuzawa, C. W. (2022) · American Journal of Human Biology · doi:10.1002/ajhb.23742 · Cited by 49
Giuliani, C., Sazzini, M., Bacalini, M. G., Pirazzini, C., Marasco, E., Fontanesi, E., Franceschi, C., Luiselli, D., & Garagnani, P. (2016) · Genome Biology and Evolution · doi:10.1093/gbe/evw186 · Cited by 49
Goodman, S. J., Burton, C. L., Butcher, D. T., Siu, M. T., Lemire, M., Chater‐Diehl, E., Turinsky, A. L., Brudno, M., Soreni, N., Rosenberg, D., et al. (2020) · Journal of Neurodevelopmental Disorders · doi:10.1186/s11689-020-09324-3 · Cited by 47
CCL2 promoter hypomethylation is associated with gout risk in Chinese Han male population
Li, B., Chen, X., Jiang, Y., Yang, Y., Zhong, J. M., Zhou, C., Hu, H., & Duan, S. (2017) · Immunology Letters · doi:10.1016/j.imlet.2017.06.011 · Cited by 43
Benson, K. K., Hu, W., Weller, A. H., Bennett, A. H., Chen, E. R., Khetarpal, S. A., Yoshino, S., Bone, W. P., Wang, L., Rabinowitz, J. D., et al. (2019) · Proceedings of the National Academy of Sciences · doi:10.1073/pnas.1913199116 · Cited by 40
Local Adaptation of Sun-Exposure-Dependent Gene Expression Regulation in Human Skin
Kita, R., & Fraser, H. B. (2016) · PLoS Genetics · doi:10.1371/journal.pgen.1006382 · Cited by 44
Self-citationComputational analysis of DNA methylation from long-read sequencing
Fu, Y., Timp, W., & Sedlazeck, F. J. (2025) · Nature Reviews Genetics · doi:10.1038/s41576-025-00822-5 · Cited by 43
Linking the genetic architecture of cytosine modifications with human complex traits
Zhang, X., Moen, E. L., Liu, C., Mu, W., Gamazon, E. R., Delaney, S. M., Wing, C., Godley, L. A., Dolan, M. E., & Zhang, W. (2014) · Human Molecular Genetics · doi:10.1093/hmg/ddu313 · Cited by 41
Epigenetics and the Environment in Airway Disease: Asthma and Allergic Rhinitis
Long, A. J., Bunning, B., Sampath, V., DeKruyff, R. H., & Nadeau, K. C. (2020) · Advances in experimental medicine and biology · doi:10.1007/978-981-15-3449-2_6 · Cited by 39
Epigenetics and individuality: from concepts to causality across timescales
Webster, A. K., & Phillips, P. C. (2025) · Nature Reviews Genetics · doi:10.1038/s41576-024-00804-z · Cited by 48
Genetic and Environmental Impacts on DNA Methylation Levels in Twins
Yet, I., Tsai, P.-C., Castillo-Fernandez, J. E., Carnero-Montoro, E., & Bell, J. T. (2016) · Epigenomics · doi:10.2217/epi.15.90 · Cited by 36
Genetic and epigenetic background of diabetic kidney disease
Sandholm, N., Dahlström, E. H., & Groop, P. (2023) · Frontiers in Endocrinology · doi:10.3389/fendo.2023.1163001 · Cited by 39
Zhang, H., Wang, F., Kranzler, H. R., Yang, C., Xu, H., Wang, Z., Zhao, H., & Gelernter, J. E. (2014) · Human Genetics · doi:10.1007/s00439-014-1452-2 · Cited by 38
Global variation in gene expression and the value of diverse sampling
Kelly, D. E., Hansen, M. E. B., & Tishkoff, S. A. (2017) · Current Opinion in Systems Biology · doi:10.1016/j.coisb.2016.12.018 · Cited by 38
Methylation of the FGFR2 Gene is Associated with High Birth Weight Centile in Humans
Haworth, K. E., Farrell, W. E., Emes, R. D., ISMAIL, K. M. K., Carroll, W. D., Hubball, E., Rooney, A., Yates, A. M., Mein, C. A., & Fryer, A. A. (2014) · Epigenomics · doi:10.2217/epi.14.40 · Cited by 37
The epigenetic side of human adaptation: hypotheses, evidences and theories
Giuliani, C., Bacalini, M. G., Sazzini, M., Pirazzini, C., Franceschi, C., Garagnani, P., & Luiselli, D. (2014) · Annals of Human Biology · doi:10.3109/03014460.2014.961960 · Cited by 42
Metadata
- Authors
- Fraser, H. B., Lam, L. L., Neumann, S. M., & Kobor, M. S.
- Affiliations
- Stanford University (US)
- University of British Columbia (CA)
- Corresponding author
- Fraser, Hunter B
- Kobor, Michael S
- Venue
- Genome Biology
- Published
- 2012-02-09
- Volume
- 13
- Issue
- 2
- Pages
- R8-R8
- ISSN
- 1465-6906 (ISSN-L)
- 1474-760X
- PMC
- PMC3334571
- OpenAlex
- W2170538199
- Cited by
- 313
- References
- 31
- Citations by year
- 2026: 20 · 2025: 21 · 2024: 15 · 2023: 16 · 2022: 18 · 2021: 25 · 2020: 27 · 2019: 21 · 2018: 21 · 2017: 20 · 2016: 31 · 2015: 27 · 2014: 19 · 2013: 24 · 2012: 8
- FWCI
- 10.04
- Type
- journal article
- Language
- en
- Open access
- gold
- doi.org
- Locations
- Genome biology (publishedVersion, cc-by)
- Europe PMC (PubMed Central) (publishedVersion, cc-by)
- PubMed Central (publishedVersion, cc-by)
- PubMed (publishedVersion)
- cIRcle (University of British Columbia) (submittedVersion, cc-by)
- Open Collections
- Funders
- Canadian Institute for Advanced Research
- National Institutes of Health (5r21hg005750-02)
- National Institute of Mental Health (R24MH081797)
- National Human Genome Research Institute (1R21HG005750-01A1, R21 HG005750)
- Topics
- Life Sciences › Biochemistry, Genetics and Molecular Biology › Molecular Biology › Epigenetics and DNA Methylation
- Life Sciences › Biochemistry, Genetics and Molecular Biology › Genetics › Genetic Associations and Epidemiology
- Life Sciences › Biochemistry, Genetics and Molecular Biology › Molecular Biology › Genomics and Chromatin Dynamics
- Keywords
- DNA methylation, ethnic differences, allele frequency divergence, CpG sites, transcription start sites, epistasis, gene-environment interaction
- MeSH terms
- Cell Line, Gene Frequency, Genetics, Population, Humans, Genetic Variation, Genome, Human, CpG Islands, DNA Methylation, Polymorphism, Single Nucleotide, Transcription Initiation Site, Black People, White People, Genetic Association Studies
About these checks
Registry, retraction, Cites and statistics results are computed, not judged, with one exception: a printed reference that no index lists is read once by a model before it counts as a citation error. Claims are extracted by a model and kept only when their quote appears verbatim in the text; each cited source is then checked, with a model’s help, for whether it says what the claim relies on. Those verdicts can be wrong — read the claim’s quote and the cited source before relying on one.
Statistics and arithmetic are recomputed, not judged.
Confidence bands are shown only for fields calibrated on our annotated test set. None is calibrated yet, so no band is shown.
What counts as a claim ›How we measure confidence ›How we check this ›
Are you an author, or do you see a problem with this page? Request a review
