

The DOI matches its Crossref record; 37 of the 37 references it cites were found in a registry or an index.
p53 induces transcriptional and translational programs to suppress cell proliferation and growth
Open accessAbstract
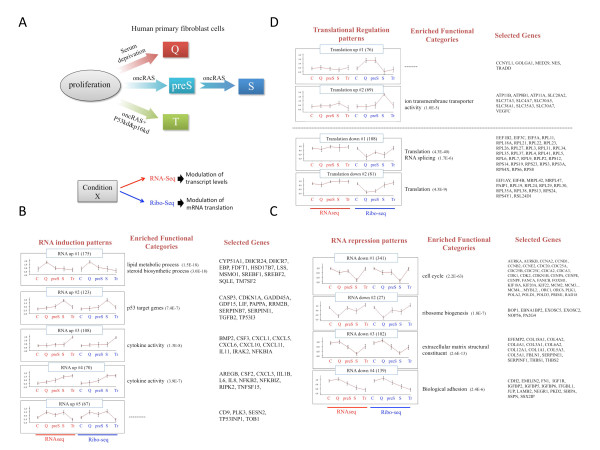
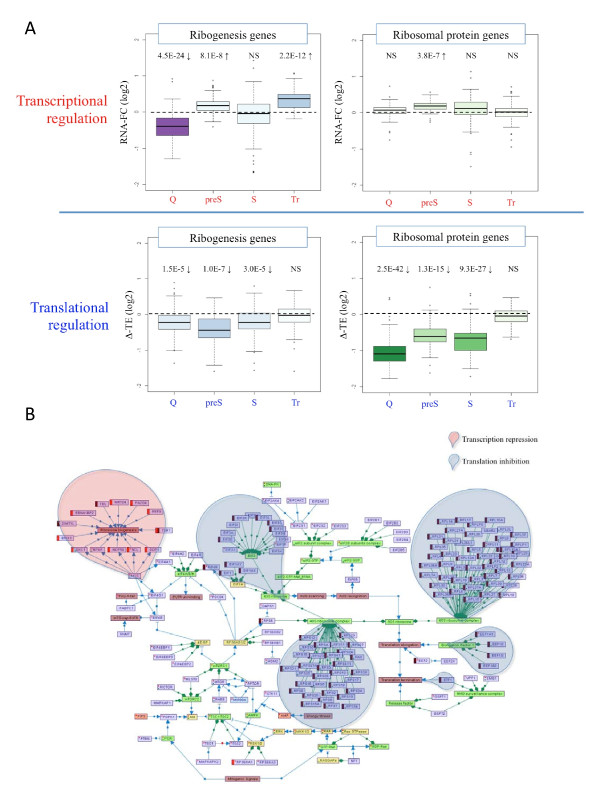
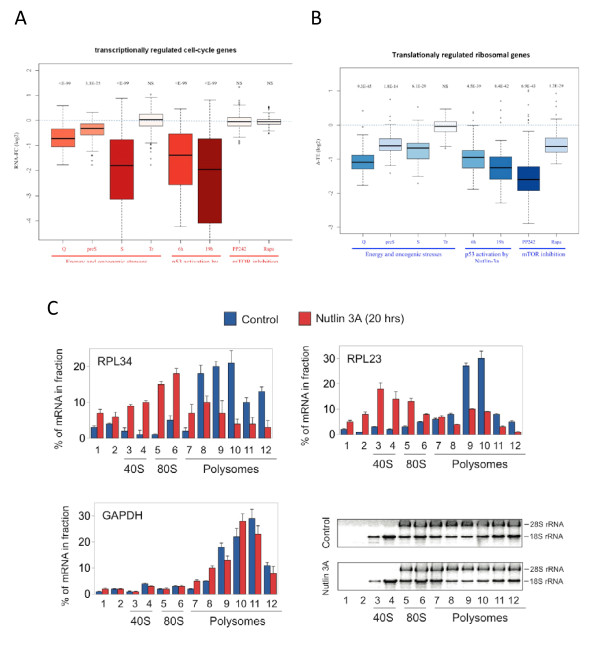
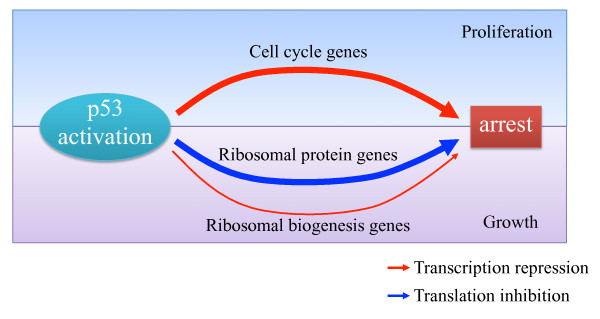
Background: Cell growth and proliferation are tightly connected to ensure that appropriately sized daughter cells are generated following mitosis. Energy stress blocks cell growth and proliferation, a critical response for survival under extreme conditions. Excessive oncogenic stress leads to p53 activation and the induction of senescence, an irreversible state of cell-cycle arrest and a critical component in the suppression of tumorigenesis. Nutrient-sensing and mitogenic cues converge on a major signaling node, which regulates the activity of the mTOR kinase. Although transcriptional responses to energy and oncogenic stresses have been examined by many gene-expression experiments, a global exploration of the modulation of mRNA translation in response to these conditions is lacking. Results: We combine RNA sequencing and ribosomal profiling analyses to systematically delineate modes of transcriptional and translational regulation induced in response to conditions of limited energy, oncogenic stress and cellular transformation. We detect a key role for mTOR and p53 in these distinct physiological states, and provide the first genome-wide demonstration that p53 activation results in mTOR inhibition and a consequent global repression of protein translation. We confirm the role of the direct p53 target genes Sestrin1 and Sestrin2 in this response, as part of the broad modulation of gene expression induced by p53 activation. Conclusions: We delineate a bimodal tumor-suppressive regulatory program activated by p53, in which cell-cycle arrest is imposed mainly at the transcriptional level, whereas cell growth inhibition is enforced by global repression of the translation machinery.
Overview
The claims and statistics of this paper haven’t been checked yet.
Run the check — free, no account needed. It reads the open-access text and checks the sources it cites.
Integrity signals
Registry
Cites
Statistics
Figures
Verification
Claims the paper makes
The claims and statistics of this paper haven’t been checked yet.
Run the check — free, no account needed. It reads the open-access text and checks the sources it cites.
Claims other papers make about this one
Each is checked against this paper’s own text: does it say what the citing paper says it does?
The cited source says what the claim attributes to it.
In the citing paper
“In addition, p53 uses two direct target genes, SESN1 and SESN2, to block mTOR and to repress mRNA translation.211, 215”
From Census and evaluation of p53 target genes (2017) · cites this paper as [215]
Self-check
Percentages, sums and reported differences re-computed from the paper’s own numbers.
The self-check needs the paper’s full text.
Citations
Cites
Ultrafast and memory-efficient alignment of short DNA sequences to the human genome.
Langmead, B., Trapnell, C., Pop, M., & Salzberg, S. L. (2009) · Genome Biology · doi:10.1186/gb-2009-10-3-r25 · Cited by 21,849
In Vivo Activation of the p53 Pathway by Small-Molecule Antagonists of MDM2
Vassilev, L. T., Vu, B. T., Graves, B., Carvajal, D., Podlaski, F., Filipovic, Z., Kong, N., Kammlott, U., Lukacs, C., Klein, C., et al. (2004) · Science · doi:10.1126/science.1092472 · Cited by 4,661
A System for Stable Expression of Short Interfering RNAs in Mammalian Cells
Brummelkamp, T. R., Bernards, R., & Agami, R. (2002) · Science · doi:10.1126/science.1068999 · Cited by 4,295
Self-citationmTOR: from growth signal integration to cancer, diabetes and ageing
Zoncu, R., Efeyan, A., & Sabatini, D. M. (2011) · Nature Reviews Molecular Cell Biology · doi:10.1038/nrm3025 · Cited by 3,941
Genome-Wide Analysis in Vivo of Translation with Nucleotide Resolution Using Ribosome Profiling
Ingolia, N. T., Ghaemmaghami, S., Newman, J. R. S., & Weissman, J. S. (2009) · Science · doi:10.1126/science.1168978 · Cited by 3,853
Oncogene-induced senescence is part of the tumorigenesis barrier imposed by DNA damage checkpoints
Bartkova, J., Rezaei, N., Liontos, M., Karakaidos, P., Kletsas, D., Issaeva, N., Vassiliou, L.-V. F., Kolettas, E., Niforou, K., Zoumpourlis, V. C., et al. (2006) · Nature · doi:10.1038/nature05268 · Cited by 1,986
SREBP transcription factors: master regulators of lipid homeostasis
Eberlé, D., Hegarty, B. D., Bossard, P., Ferré, P., & Foufelle, F. (2004) · Biochimie · doi:10.1016/j.biochi.2004.09.018 · Cited by 1,584
A unifying model for mTORC1-mediated regulation of mRNA translation
Thoreen, C. C., Chantranupong, L., Keys, H. R., Wang, T., Gray, N. S., & Sabatini, D. M. (2012) · Nature · doi:10.1038/nature11083 · Cited by 1,477
p53 Target Genes Sestrin1 and Sestrin2 Connect Genotoxic Stress and mTOR Signaling
Budanov, A. V., & Karin, M. (2008) · Cell · doi:10.1016/j.cell.2008.06.028 · Cited by 1,326 · cited 11×
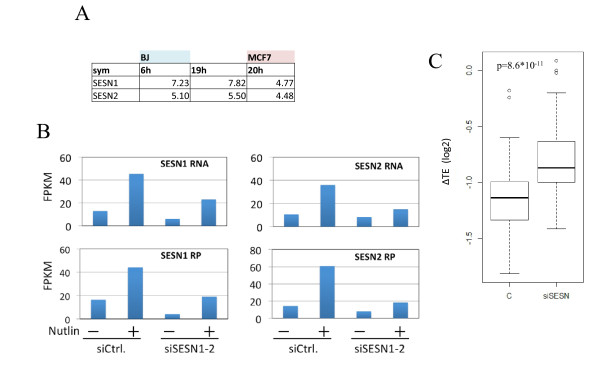
“(A) A table showing fold induction of Sestrin1 and Sestrin2 (SESN1 and SESN2, respectively) in nutlin-3a treated cells for the indicated times compared to control untreated cells.”
BackgroundInfluentialThe translational landscape of mTOR signalling steers cancer initiation and metastasis
Hsieh, A. C., Liu, Y., Edlind, M. P., Ingolia, N. T., Janes, M. R., Sher, A., Shi, E. Y., Stumpf, C. R., Christensen, C., Bonham, M. J., et al. (2012) · Nature · doi:10.1038/nature10912 · Cited by 1,313
Cited by
Sorted by citations
Items 101–114 of 114
A post-transcriptional program of chemoresistance by AU-rich elements and TTPPreprint
Lee, S., Micalizzi, D., Truesdell, S. S., Bukhari, S. I., Boukhali, M., Lombardi-Story, J., Kato, Y., Choo, M.-K., Dey‐Guha, I., Nicholson, B. T., et al. (2018) · bioRxiv (Cold Spring Harbor Laboratory) · doi:10.1101/418715 · Cited by 1
Ribo-ODDR : Oligo Design pipeline for experiment-specific Depletion of Ribosomal RNAs in Ribo-seqPreprint
Alkan, F., Silva, J., Barberà, E. P., & Faller, W. J. (2020) · bioRxiv (Cold Spring Harbor Laboratory) · doi:10.1101/2020.01.12.900175 · Cited by 1
Systematic transcriptomic analysis and temporal modelling of the senescent human fibroblastPreprint
Scanlan, R.-L., Pease, L., O’Keefe, H., Guimera, A. M., Shanley, D., & Wordsworth, J. (2022) · bioRxiv (Cold Spring Harbor Laboratory) · doi:10.1101/2022.08.16.504144 · Cited by 1
Lee, S.-S., Kung, Y., & Jou, Y. (2023) · bioRxiv (Cold Spring Harbor Laboratory) · doi:10.1101/2023.07.13.548784 · Cited by 1
Rooijers, K. (2016) · RePub (Erasmus University Rotterdam)
Self-citationTP53 Intron Derived Concentrations Implicate p53Preprint
Bermeister, K., Dyne, J., Yu, X., Carmel, L., Kermesh, K., Bermeister, A., Kon, M., & Shnier, D. (2018) · bioRxiv (Cold Spring Harbor Laboratory) · doi:10.1101/307959
Identification and Characterization of TPRKB Dependency in TP53 Deficient Cancers
Kennaley, K. (2019) · Deep Blue (University of Michigan)
Josipović, N. (2022) · eDiss (Georg-August-Universität Göttingen) · doi:10.53846/goediss-9136
Županič, A., & Grellscheid, S. N. (2016) · Springer eBooks · doi:10.1007/978-3-319-31350-4_8
Hutfilz, C. (2022) · bioRxiv (Cold Spring Harbor Laboratory) · doi:10.1101/2022.12.21.521440
YTHDF2 upregulation and relocation dictate CD8 T cell polyfunctionality in tumor immunityPreprint
Zhang, H., Luo, X.-J., Yang, W., Wu, Z., Zhao, Z., Pei, X., Zhang, X., Chen, C., Lei, J. H., Shi, Q., et al. (2024) · bioRxiv (Cold Spring Harbor Laboratory) · doi:10.1101/2024.07.11.603088
Foxg1 and companions: Not only transcription factors
Mallamaci, A., Artimagnella, O., & Liuzzi, G. (2025) · Neural Regeneration Research · doi:10.4103/nrr.nrr-d-25-00439
Long, F. N. V. (2019) · theses.fr (ABES) · doi:10.70675/12a8367cz6b6bz4592zbd98zf68b8cd5151d
Computational Approaches to Cancer Cell Dormancy: From Detection to Dynamic Modelling
Spink, L. G. N., Shi, P., Kim, M., Yener, B., Banfalvi, B., & Secrier, M. (2026) · Biomolecules · doi:10.3390/biom16050633
Metadata
- Authors
- Loayza-Puch, F., Drost, J., Rooijers, K., Lopes, R., Elkon, R., & Agami, R.
- Affiliations
- The Netherlands Cancer Institute (NL)
- Corresponding author
- Elkon, Ran
- Agami, Reuven
- Venue
- Genome Biology
- Published
- 2013-04-17
- Volume
- 14
- Issue
- 4
- Pages
- R32-R32
- ISSN
- 1465-6906 (ISSN-L)
- 1474-760X
- PMC
- PMC4053767
- OpenAlex
- W2137903553
- Cited by
- 114
- References
- 37
- Citations by year
- 2026: 2 · 2025: 3 · 2024: 7 · 2023: 5 · 2022: 10 · 2021: 9 · 2020: 7 · 2019: 5 · 2018: 8 · 2017: 12 · 2016: 10 · 2015: 11 · 2014: 15 · 2013: 10
- FWCI
- 8.22
- Type
- journal article
- Language
- en
- Open access
- gold
- doi.org
- Locations
- Genome biology (publishedVersion, cc-by)
- Europe PMC (PubMed Central) (publishedVersion, cc-by)
- PubMed Central (publishedVersion, cc-by)
- PubMed (publishedVersion)
- Topics
- Health Sciences › Medicine › Oncology › Cancer-related Molecular Pathways
- Life Sciences › Biochemistry, Genetics and Molecular Biology › Molecular Biology › PI3K/AKT/mTOR signaling in cancer
- Life Sciences › Biochemistry, Genetics and Molecular Biology › Molecular Biology › RNA and protein synthesis mechanisms
- Keywords
- p53, mTOR, mRNA translation, cell proliferation, cell growth inhibition, oncogenic stress, energy stress, cellular senescence, Sestrin2, cell cycle arrest, tumor suppression, ribosome profiling, nutrient sensing
- MeSH terms
- Cell Line, Humans, Transcription, Genetic, Protein Biosynthesis, Gene Expression Regulation, Neoplastic, Tumor Suppressor Protein p53, Cellular Senescence, Apoptosis, Proteome, Cell Proliferation, TOR Serine-Threonine Kinases, Transcriptome, Carcinogenesis
About these checks
Registry, retraction, Cites and statistics results are computed, not judged, with one exception: a printed reference that no index lists is read once by a model before it counts as a citation error. Claims are extracted by a model and kept only when their quote appears verbatim in the text; each cited source is then checked, with a model’s help, for whether it says what the claim relies on. Those verdicts can be wrong — read the claim’s quote and the cited source before relying on one.
Statistics and arithmetic are recomputed, not judged.
Confidence bands are shown only for fields calibrated on our annotated test set. None is calibrated yet, so no band is shown.
What counts as a claim ›How we measure confidence ›How we check this ›
Are you an author, or do you see a problem with this page? Request a review
