

The DOI matches its Crossref record; 39 of the 39 references it cites were found in a registry or an index; 9 of the 10 sources its claims cite were checked for support.
Benchmarking foundation cell models for post-perturbation RNA-seq prediction
Open accessAbstract
Accurately predicting cellular responses to perturbations is essential for understanding cell behaviour in both healthy and diseased states. While perturbation data is ideal for building such predictive models, its availability is considerably lower than baseline (non-perturbed) cellular data. To address this limitation, several foundation cell models have been developed using large-scale single-cell gene expression data. These models are fine-tuned after pre-training for specific tasks, such as predicting post-perturbation gene expression profiles, and are considered state-of-the-art for these problems. However, proper benchmarking of these models remains an unsolved challenge. In this study, we benchmarked two recently published foundation models, scGPT and scFoundation, against baseline models. Surprisingly, we found that even the simplest baseline model—taking the mean of training examples—outperformed scGPT and scFoundation. Furthermore, basic machine learning models that incorporate biologically meaningful features outperformed scGPT by a large margin. Additionally, we identified that the current Perturb-Seq benchmark datasets exhibit low perturbation-specific variance, making them suboptimal for evaluating such models. Our results highlight important limitations in current benchmarking approaches and provide insights into more effectively evaluating post-perturbation gene expression prediction models.
Overview
CoChat Summary
TL;DR
In a benchmark of scGPT and scFoundation on four Perturb-seq datasets, the trivial Train Mean baseline and a Random Forest using Gene Ontology features outperformed both foundation models on differential-expression correlation metrics. The authors attribute this to low perturbation-specific variance in current benchmark datasets and argue that existing benchmarks are suboptimal for evaluating post-perturbation RNA-seq prediction.
Key findings
- In differential expression space (Pearson Delta), Train Mean outperformed scGPT and scFoundation across Adamson, Norman, Replogle K562, and Replogle RPE1: Train Mean 0.711, 0.557, 0.373, 0.628; scGPT 0.641, 0.554, 0.327, 0.596; scFoundation 0.552, 0.459, 0.269, 0.471.
- Random Forest with GO features outperformed foundation models by a large margin: 0.739, 0.586, 0.480, 0.648 across the four datasets, respectively.
- Random Forest using pretrained foundation embeddings performed better than the fine-tuned foundation models themselves, especially for scGPT (0.727, 0.583, 0.421, 0.635), but still weaker than RF with GO features; RF with scELMO features was similar to GO-based RF (0.706, 0.663, 0.471, 0.651).
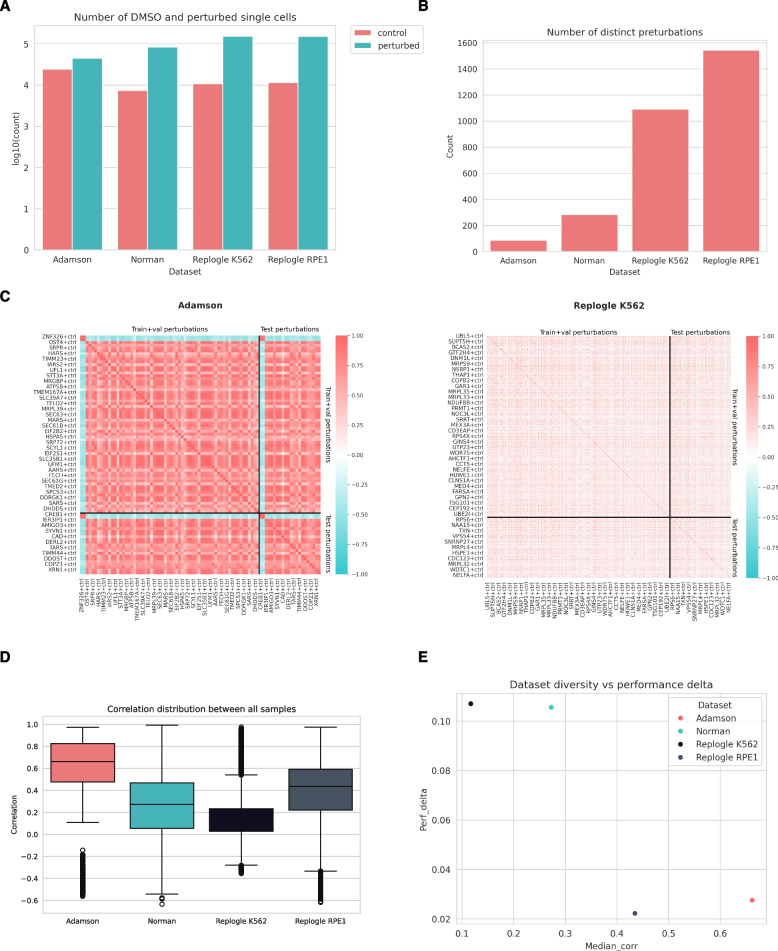
- The benchmark datasets contain many single cells (~70,000 in Adamson to ~160,000 in Replogle datasets) but few distinct perturbations (87 Adamson, 284 Norman, 1,093 Replogle K562, 1,544 Replogle RPE1); Adamson had high median pairwise differential-expression correlation (0.662), while Replogle K562 had lower median correlation (0.117).
Methods
- Benchmark datasets (Adamson, Norman, two Replogle subsets) were downloaded and processed with GEARS’ cell-gears v0.0.1; expression values were normalized to 10,000 reads and log transformed, top 20 DE genes were taken from the original GEARS publication, and splits followed the GEARS Perturbation Exclusive setup.
- scGPT was reproduced using a fork of scGPT v0.2.1 (commit 7301b51) with default hyperparameters and fine-tuned for 15 epochs; scFoundation used repository commit 69b0710 and was fine-tuned for 10 epochs with effective batch size 32; both trained on Nvidia A100 GPUs.
- Baselines included Train Mean, Random Forest Regressor, Elastic Net, and k-Nearest-Neighbors Regressor, using prior-knowledge features (GO PCA to 256 components, scGPT/scFoundation/scELMO embeddings) and pseudo-bulked expression targets; evaluation used Pearson, Pearson Delta, Pearson Delta DE, and Pearson Delta without target genes.
Limitations
- Stated by the paper: current Perturb-seq benchmark datasets exhibit low perturbation-specific variance, making them suboptimal for evaluating models; Adamson and Replogle RPE1 show high similarity between perturbations, and current benchmarks focus exclusively on the PEX problem while neglecting the CEX problem.
- Stated by the paper: single-cell data did not provide an obvious advantage over pseudo-bulked data in this benchmark, and single-cell profiles are subject to technical noise such as dropout events; only scGPT and scFoundation were tested, though other foundation models may face similar limitations.
- Evident from the text: evaluation is limited to four Perturb-seq datasets and PEX splits, and the top-20 DE metric can be influenced by inclusion of the CRISPR target gene, since removing target genes decreased scGPT’s performance in that space.
Model-written summary. Check it against the paper before relying on it.
Integrity signals
Registry
Cites
Statistics
Figures

Verification
Claims the paper makes
6 Valid · 0 Not valid · 1 Not checked · 42 Own results and interpretations
Every source the paper cites for this claim was checked and supports it.
In the paper
“We have previously demonstrated that test set selection and performance metrics can significantly impact benchmarking outcomes in the related problem of post-perturbation viability prediction [13]. Poor test set design or inappropriate metric choice can result in indistinguishable performance between well-performing and trivial models.”
§ Benchmarking foundation cell models for post-perturbation RNA-seq prediction > Introduction
What the sources say
- Supportedcites [13] Szalai B, Gáspár I, Kaszás V, Mérő L, Sztilkovics M, Szalay KZ. The EFFECT benchmark suite: measuring cancer sensitivity prediction performance - without the bias. bioRxiv 2023.10.02.560281. https://doi.org/10.1101/2023.10.02.560281. source
The Introduction states that standard metrics can fail to distinguish simple models using uninformative features from models using biologically informative features. The Discussion reports that, with random train/test splits, models trained on any feature combination achieved comparably good global correlations despite substantial performance drops when evaluated by individual perturbation. (LLM, conf=0.93)
boostedstates a cause- Asserted: passes — The authors put it forward as true.
- Checkable: passes — It can be checked against evidence.
- Load-bearing: passes — The paper’s conclusions depend on it.
- Based: passes — The paper gives a reason why it holds.
- Supported
The cited sources support only part of this claim — read each source’s verdict below.
In the paper
“These models had shown strong performance in post-perturbation RNA-seq prediction tasks using Perturb-seq-based genetic perturbation benchmarks [12].”
§ Benchmarking foundation cell models for post-perturbation RNA-seq prediction > Introduction
What the sources say
- Partly supportedcites [12] Dixit A, Parnas O, Li B, Chen J, Fulco CP, Jerby-Arnon L, et al. Perturb-seq: dissecting molecular circuits with scalable single-cell RNA profiling of pooled genetic screens. Cell. 2016;167:1853-1866.e17. sourceExperimental — accuracy not yet measured
The Results section, “Perturb-seq: pooled, combinatorial CRISPR screens with scRNA-seq readout” (page unavailable), describes genetic perturbation experiments with RNA-seq readouts. The paper does not report foundation-model performance or evaluate those models on post-perturbation prediction benchmarks; its predictive results concern its own linear model. (LLM, conf=0.82)
boostedstates an association- Asserted: passes — The authors put it forward as true.
- Checkable: passes — It can be checked against evidence.
- Load-bearing: passes — The paper’s conclusions depend on it.
- Based: passes — The paper gives a reason why it holds.
- Partly supported
The cited sources support only part of this claim — read each source’s verdict below.
In the paper
“All benchmark datasets were split into train, validation and test sets according to the GEARS publication - corresponding to Perturbation Exclusive split, where new, unseen perturbations (or perturbation combinations) were present in the test set (Supplementary Table 1).”
§ Benchmarking foundation cell models for post-perturbation RNA-seq prediction > Methods > Benchmark datasets
What the sources say
- Partly supportedcites [5] Roohani Y, Huang K, Leskovec J. Predicting transcriptional outcomes of novel multigene perturbations with GEARS. Nat Biotechnol. 2023. https://doi.org/10.1038/s41587-023-01905-6. sourceExperimental — accuracy not yet measured
The Results sections on single- and multigene predictions describe train–test evaluation with perturbations held out from training, including unseen two-gene combinations (Fig. 2a,e). Our copy does not establish a train–validation–test split or use the term “Perturbation Exclusive,” so those details of the attributed splitting scheme are not supported. (LLM, conf=0.84)
plain- Asserted: passes — The authors put it forward as true.
- Checkable: passes — It can be checked against evidence.
- Load-bearing: passes — The paper’s conclusions depend on it.
- Based: passes — The paper gives a reason why it holds.
- Partly supported
A result the paper reports from its own data — it cites no other source for it, so there is none to check. The quote shows it is in the paper.
In the paper
“Our comparison of embedding similarities also demonstrated, that scGPT embeddings show smaller associations with pathway information (KEGG, REACTOME) than Gene Ontology features, or natural language processing based (scELMO) embeddings.”
§ Benchmarking foundation cell models for post-perturbation RNA-seq prediction > Discussion
boostedstates an association- Asserted: passes — The authors put it forward as true.
- Checkable: passes — It can be checked against evidence.
- Load-bearing: passes — The paper’s conclusions depend on it.
- Based: passes — The paper gives a reason why it holds.
A result the paper reports from its own data — it cites no other source for it, so there is none to check. The quote shows it is in the paper.
In the paper
“Interestingly, scGPT embeddings have stronger association with a gene regulatory network (CollecTRI) than scELMO, also underlying that current foundation models trained on unlabelled scRNA-seq data are learning gene regulatory, but not protein interaction networks.”
§ Benchmarking foundation cell models for post-perturbation RNA-seq prediction > Discussion
boostedstates an association- Asserted: passes — The authors put it forward as true.
- Checkable: passes — It can be checked against evidence.
- Load-bearing: unclear — It is unclear whether the paper’s conclusions depend on it.
- Based: passes — The paper gives a reason why it holds.
20 more claims
Create a free account to see all 49 claims and every source verdict.
- Probably not a substantial claim. 8
- It may state two separate claims as one. 17
- The quote only partly states this claim. 1
Claims other papers make about this one
Each is checked against this paper’s own text: does it say what the citing paper says it does?
The cited source says what the claim attributes to it.
In the citing paper
“Since the release of our paper as a preprint, several other benchmarks15,16,22–27 were released that also show that deep learning models struggle to outperform simple baselines.”
From Deep-learning-based gene perturbation effect prediction does not yet outperform simple linear baselines (2025) · cites this paper as [16]
Experimental — accuracy not yet measuredThe cited source says what the claim attributes to it.
In the citing paper
“Two of these preprints15,16 suggested an even simpler baseline than our linear model (equation (1)), namely, to always predict the overall average, and we have included this idea here.”
From Deep-learning-based gene perturbation effect prediction does not yet outperform simple linear baselines (2025) · cites this paper as [16]
Citations
Cites
Scikit-learn: Machine Learning in Python
Pedregosa, F., Varoquaux, G., Gramfort, A., Michel, V., Thirion, B., Grisel, O., Blondel, M., Müller, A., Nothman, J., Louppe, G., et al. (2012) · arXiv · doi:10.48550/arxiv.1201.0490 · Cited by 71,016
SCANPY: large-scale single-cell gene expression data analysis
Wolf, F. A., Angerer, P., & Theis, F. J. (2018) · Genome Biology · doi:10.1186/s13059-017-1382-0 · Cited by 8,881 · cited 1×
“The top 20 DE genes were calculated with the tl.rank_genes_groups() function of Scanpy [30] with default parameters.”
Scikit-learn: Machine Learning in Python
(2011) · Journal of Machine Learning Research · doi:10.5555/1953048.2078195 · Cited by 8,539
The Reactome pathway Knowledgebase
Fabregat, A., Sidiropoulos, K., Garapati, P., Gillespie, M., Hausmann, K., Haw, R., Jassal, B., Jupe, S., Korninger, F., McKay, S., et al. (2016) · Nucleic Acids Research · doi:10.1093/nar/gkv1351 · Cited by 5,605
Lamb, J., Crawford, E. D., Peck, D., Modell, J. W., Blat, I. C., Wrobel, M. J., Lerner, J., Brunet, J.-P., Subramanian, A., Ross, K. N., et al. (2006) · Science · doi:10.1126/science.1132939 · Cited by 5,257 · cited 1×
“Notably, post-perturbation transcriptomics data are particularly suited for training computational models because the causal relationship between known perturbations (cause) and the measured post-perturbation gene expression (effect) allows for the modelling of mechanistic processes [11].”
The Gene Ontology Resource: 20 years and still GOing strong
The Gene Ontology Consortium (2019) · Nucleic Acids Research · doi:10.1093/nar/gky1055 · Cited by 4,747
A Next Generation Connectivity Map: L1000 Platform and the First 1,000,000 Profiles
Subramanian, A., Narayan, R., Corsello, S. M., Peck, D. D., Natoli, T. E., Lu, X., Gould, J., Davis, J. F., Tubelli, A. A., Asiedu, J. K., et al. (2017) · Cell · doi:10.1016/j.cell.2017.10.049 · Cited by 3,515
The reactome pathway knowledgebase
Jassal, B., Matthews, L. R., Viteri, G., Gong, C., Lorente, P., Fabregat, A., Sidiropoulos, K., Cook, J., Gillespie, M. E., Haw, R., et al. (2019) · Nucleic Acids Research · doi:10.1093/nar/gkz1031 · Cited by 2,378
New approach for understanding genome variations in KEGG
Kanehisa, M. I., Sato, Y., Furumichi, M., Morishima, K., & Tanabe, M. (2018) · Nucleic Acids Research · doi:10.1093/nar/gky962 · Cited by 1,864 · cited 2×
“…scFoundation, scELMO, and GO gene embeddings was assessed by examining their correlation-based gene similarity networks in relation to well-characterized pathways from the Reactome [20] and KEGG [19] databases, as well as transcription factor-target interactions from the CollecTRI [21] database.”
Dixit, A., Parnas, O., Li, B., Chen, J., Fulco, C. P., Jerby-Arnon, L., Marjanovic, N. D., Dionne, D., Burks, T., Raychowdhury, R., et al. (2016) · Cell · doi:10.1016/j.cell.2016.11.038 · Cited by 1,863 · cited 1×
“These models had shown strong performance in post-perturbation RNA-seq prediction tasks using Perturb-seq-based genetic perturbation benchmarks [12].”
Cited by
Ahlmann-Eltze, C., Huber, W., & Anders, S. (2025) · Nature Methods · doi:10.1038/s41592-025-02772-6 · Cited by 238
“Two of these preprints 15,16 suggested an even simpler baseline than our linear model (equation (1)), namely, to always predict the overall average, and we have included this idea here.”
Viñas Torné, R., Wiatrak, M., Piran, Z., Fan, S., Jiang, L., Teichmann, S. A., Nitzan, M., & Brbić, M. (2026) · Nature Biotechnology · doi:10.1038/s41587-025-02777-8 · Cited by 58
Methods and applications of in vivo CRISPR screening
Santinha, A. J., Strano, A., & Platt, R. J. (2025) · Nature Reviews Genetics · doi:10.1038/s41576-025-00873-8 · Cited by 31
“One particularly groundbreaking concept is that of the virtual cell, namely artificial intelligence models proposed in multiple studies that aim to predict the behaviour of cells in health and disease contexts 211–213 .”
AI agents in drug discovery: applications and case studies
Huynh, D. L., Seal, S., Seal, S., Huynh, D. L., Chelbi, M., Patra, A., Khosravi, S., Kumar, A., Thieme, M., Wilks, I., et al. (2026) · Drug Discovery Today · doi:10.1016/j.drudis.2026.104650 · Cited by 43
A comparison of computational methods for expression forecasting
Kernfeld, E. M., Yang, Y., Weinstock, J. S., Battle, A. J., & Cahan, P. (2025) · Genome biology · doi:10.1186/s13059-025-03840-y · Cited by 46
Metadata
- Authors
- Csendes, G., Sanz, G., Szalay, K. Z., & Szalai, B.
- Corresponding author
- Szalai, Bence
- Venue
- BMC Genomics
- Published
- 2025-04-23
- Volume
- 26
- Issue
- 1
- Pages
- 393-393
- ISSN
- 1471-2164 (ISSN-L)
- PMC
- PMC12016270
- OpenAlex
- W4409705874
- Cited by
- 47
- References
- 35
- Citations by year
- 2026: 29 · 2025: 18
- FWCI
- 14.03
- Type
- journal article
- Language
- en
- Open access
- gold
- doi.org
- Licence
- cc-by
- creativecommons.org/licenses/by/4.0 (tdm)
- creativecommons.org/licenses/by/4.0 (vor)
- Locations
- BMC Genomics (publishedVersion, cc-by)
- PubMed Central (publishedVersion, cc-by)
- PubMed (publishedVersion)
- DOAJ (DOAJ: Directory of Open Access Journals) (submittedVersion, cc-by-sa)
- Topics
- Life Sciences › Biochemistry, Genetics and Molecular Biology › Molecular Biology › Single-cell and spatial transcriptomics
- Life Sciences › Biochemistry, Genetics and Molecular Biology › Molecular Biology › Gene expression and cancer classification
- Life Sciences › Biochemistry, Genetics and Molecular Biology › Molecular Biology › Gene Regulatory Network Analysis
- Keywords
- benchmarking, scGPT, single-cell RNA sequencing, Perturb-seq, single-cell gene expression, model evaluation, baseline model
- MeSH terms
- Machine Learning, RNA-Seq, Humans, Models, Biological, Sequence Analysis, RNA, Computational Biology, Benchmarking, Gene Expression Profiling, Single-Cell Analysis, Transcriptome
About these checks
Registry, retraction, Cites and statistics results are computed, not judged, with one exception: a printed reference that no index lists is read once by a model before it counts as a citation error. Claims are extracted by a model and kept only when their quote appears verbatim in the text; each cited source is then checked, with a model’s help, for whether it says what the claim relies on. Those verdicts can be wrong — read the claim’s quote and the cited source before relying on one.
The claim verdicts this report counts are experimental: their accuracy is not yet measured.
A language model drew the claims from the paper on 2026-10-10, under version 3 of the claim definition (model deepseek-v4.1-flash, prompt extract-v3).
A second model labelled each claim on 2026-10-10 (model jev-1.13-20260917, definition revision gold-guideline-v0.2).
Cited sources are checked with a language model’s help (gpt-6-sol).
Statistics and arithmetic are recomputed, not judged.
Confidence bands are shown only for fields calibrated on our annotated test set. None is calibrated yet, so no band is shown.
What counts as a claim ›How we measure confidence ›How we check this ›
Are you an author, or do you see a problem with this page? Request a review
How to cite
Cite CoChat for the checks on this page, and the paper for its own findings.
- This page
- CoChat. (2026). Citation check: Benchmarking foundation cell models for post-perturbation RNA-seq prediction. https://app.cochat.ai/papers/10.1186/s12864-025-11600-2
- The paper
- Csendes, G., Sanz, G., Szalay, K. Z., & Szalai, B. (2025). Benchmarking foundation cell models for post-perturbation RNA-seq prediction. BMC Genomics. https://doi.org/10.1186/s12864-025-11600-2
Data sources
Bibliographic data: Semantic Scholar, OpenAlex, Crossref.
Contains information from the Semantic Scholar Academic Graph Datasets, made available under the ODC Attribution License (ODC-BY 1.0).
Semantic Scholar’s data is described in: Kinney, R., et al. (2023). The Semantic Scholar Open Data Platform. arXiv:2301.10140.
