

The DOI matches its Crossref record; 50 of the 50 references it cites were found in a registry or an index.
Hypoxic BMSC-derived exosomal miRNAs promote metastasis of lung cancer cells via STAT3-induced EMT
Open accessAbstract
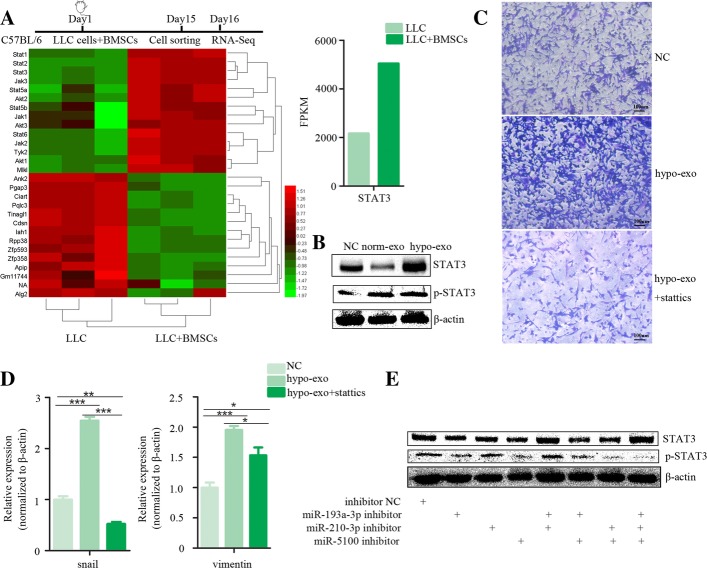
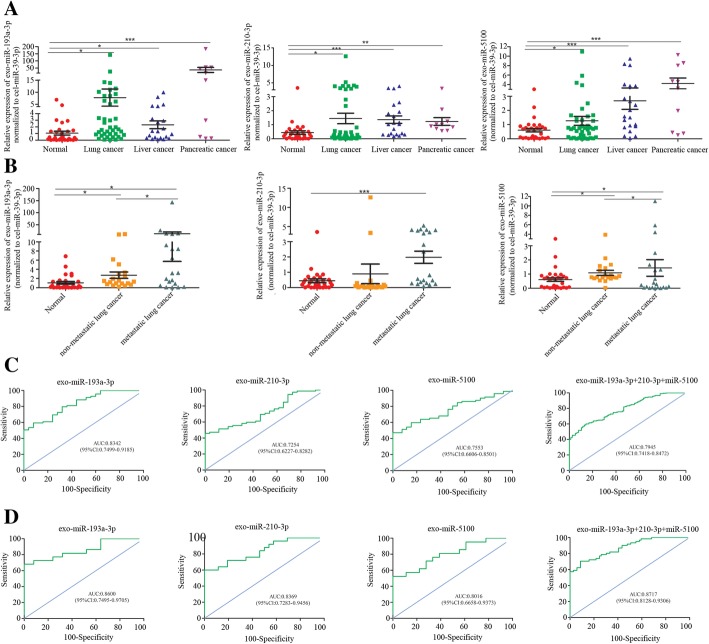
BACKGROUND: Metastasis is the main cause of lung cancer mortality. Bone marrow-derived mesenchymal stem cells (BMSCs) are a component of the cancer microenvironment and contribute to cancer progression. Intratumoral hypoxia affects both cancer and stromal cells. Exosomes are recognized as mediators of intercellular communication. Here, we aim to further elucidate the communication between BMSC-derived exosomes and cancer cells in the hypoxic niche. METHODS: Exosomal miRNA profiling was performed using a microRNA array. Lung cancer cells and an in vivo mouse syngeneic tumor model were used to evaluate the effects of select exosomal microRNAs. Hypoxic BMSC-derived plasma exosomal miRNAs were assessed for their capacity to discriminate between cancer patients and non-cancerous controls and between cancer patients with or without metastasis. RESULTS: We demonstrate that exosomes derived from hypoxic BMSCs are taken by neighboring cancer cells and promote cancer cell invasion and EMT. Exosome-mediated transfer of select microRNAs, including miR-193a-3p, miR-210-3p and miR-5100, from BMSCs to epithelial cancer cells activates STAT3 signaling and increases the expression of mesenchymal related molecules. The diagnostic accuracy of individual microRNA showed that plasma exosomal miR-193a-3p can discriminate cancer patients from non-cancerous controls. A panel of these three plasma exosomal microRNAs showed a better diagnostic accuracy to discriminate lung cancer patients with or without metastasis than individual exosomal microRNA. CONCLUSIONS: Exosome-mediated transfer of miR-193a-3p, miR-210-3p and miR-5100, could promote invasion of lung cancer cells by activating STAT3 signalling-induced EMT. These exosomal miRNAs may be promising noninvasive biomarkers for cancer progression.
Overview
The claims and statistics of this paper haven’t been checked yet.
Run the check — free, no account needed. It reads the open-access text and checks the sources it cites.
Integrity signals
Registry
Cites
Statistics
Figures
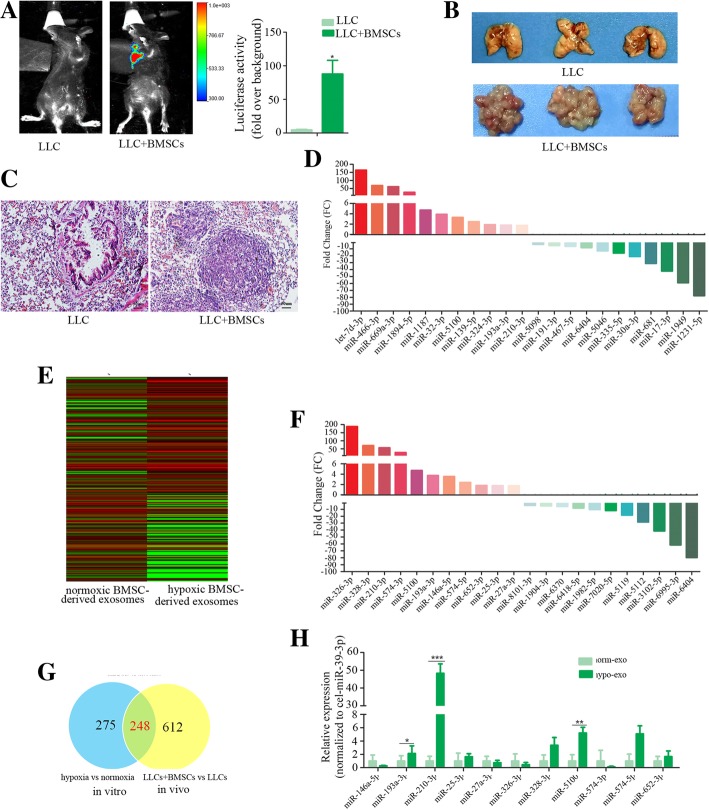
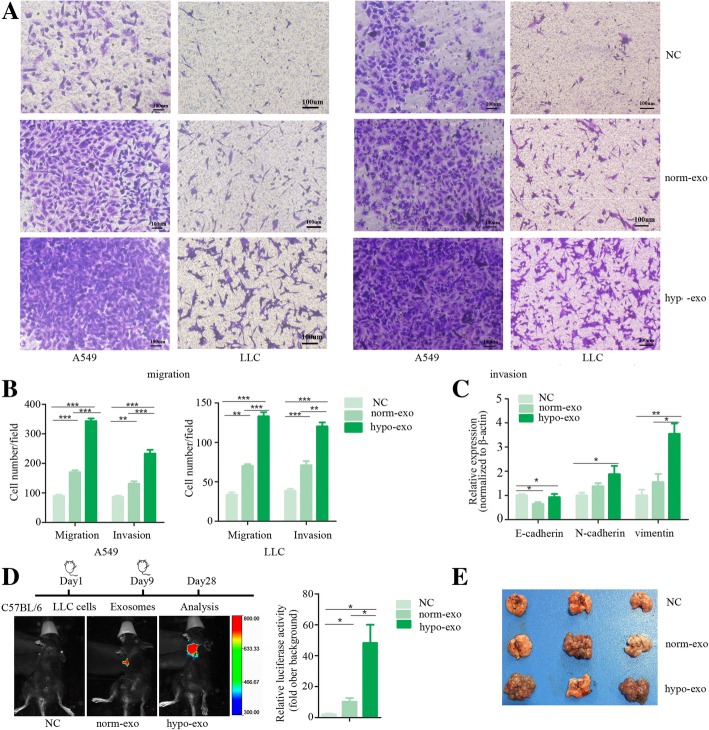
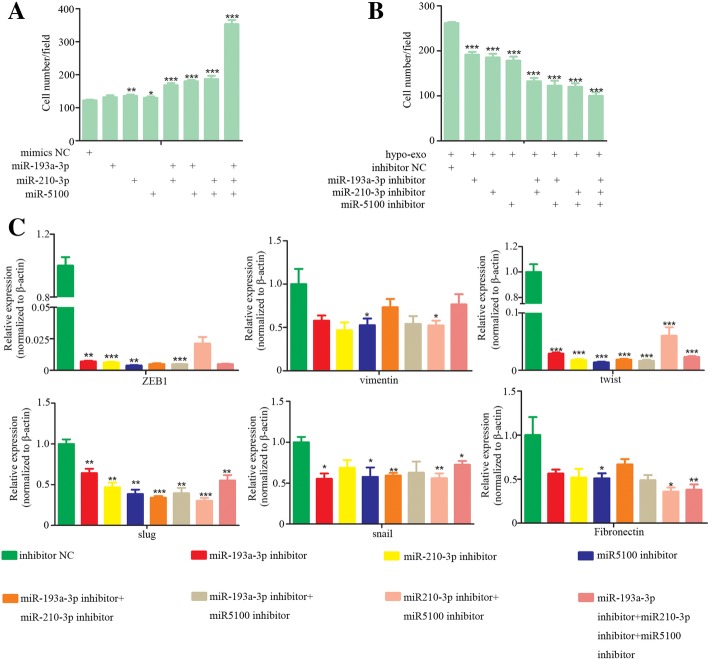
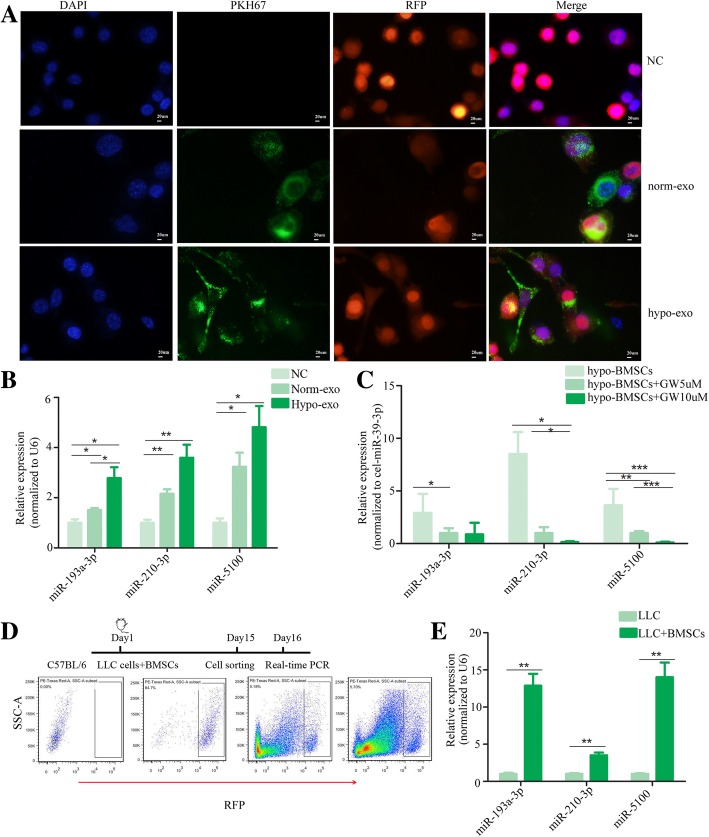
Verification
Claims the paper makes
The claims and statistics of this paper haven’t been checked yet.
Run the check — free, no account needed. It reads the open-access text and checks the sources it cites.
Claims other papers make about this one
Each is checked against this paper’s own text: does it say what the citing paper says it does?
In the citing paper
“which has been identified as a new biomarker for lung cancer progression [114].”
From The Therapeutic Potential and Clinical Significance of Exosomes as Carriers of Drug Delivery System (2022) · cites this paper as [114]
In the citing paper
“Similarly, Zhang et al. showed that exosome microRNAs (such as miR-193a-3p, miR-210-3p, and miR-5100) from hypoxic BMSCs were selectively taken up by lung cancer cells and could activate STAT3 signaling to induce epithelial–mesenchymal transition (EMT) to promote the invasion of lung cancer cells, which has been identified as a new biomarker for lung cancer progression [114].”
From The Therapeutic Potential and Clinical Significance of Exosomes as Carriers of Drug Delivery System (2022) · cites this paper as [114]
Self-check
Percentages, sums and reported differences re-computed from the paper’s own numbers.
The self-check needs the paper’s full text.
Citations
Cites
Arroyo, J. D., Chevillet, J. R., Kroh, E. M., Ruf, I. K., Pritchard, C. C., Gibson, D. F., Mitchell, P. S., Bennett, C. F., Pogosova-Agadjanyan, E. L., Stirewalt, D. L., et al. (2011) · Proceedings of the National Academy of Sciences · doi:10.1073/pnas.1019055108 · Cited by 3,294
Targeting hypoxia in cancer therapy
Wilson, W. R., & Hay, M. P. (2011) · Nature Reviews Cancer · doi:10.1038/nrc3064 · Cited by 3,172
Exosomes facilitate therapeutic targeting of oncogenic KRAS in pancreatic cancer
Kamerkar, S., LeBleu, V. S., Sugimoto, H., Yang, S., Ruivo, C. F., Melo, S. A., Lee, J. J., & Kalluri, R. (2017) · Nature · doi:10.1038/nature22341 · Cited by 2,639
Exosome and Exosomal MicroRNA: Trafficking, Sorting, and Function
Zhang, J., Li, S., Li, L., Li, M., Guo, C., Yao, J., & Mi, S. (2015) · Genomics, Proteomics & Bioinformatics · doi:10.1016/j.gpb.2015.02.001 · Cited by 1,901
Hypoxia signalling in cancer and approaches to enforce tumour regression
Pouysségur, J., Dayan, F., & Mazure, N. M. (2006) · Nature · doi:10.1038/nature04871 · Cited by 1,676
MicroRNAs in Stress Signaling and Human Disease
Mendell, J. T., & Olson, E. N. (2012) · Cell · doi:10.1016/j.cell.2012.02.005 · Cited by 1,673
Kroh, E. M., Parkin, R. K., Mitchell, P. S., & Tewari, M. (2010) · Methods · doi:10.1016/j.ymeth.2010.01.032 · Cited by 1,184
Hypoxic enhancement of exosome release by breast cancer cells
King, H. W., Michael, M. Z., & Gleadle, J. M. (2012) · BMC Cancer · doi:10.1186/1471-2407-12-421 · Cited by 1,045
Exosome-delivered microRNAs modulate the inflammatory response to endotoxin
Alexander, M., Hu, R., Runtsch, M. C., Kagele, D. A., Mosbruger, T. L., Tolmachova, T., Seabra, M. C., Round, J. L., Ward, D. M., & O’Connell, R. M. (2015) · Nature Communications · doi:10.1038/ncomms8321 · Cited by 769
Sorting it out: Regulation of exosome loading
Villarroya‐Beltri, C., Baixauli, F., Gutiérrez‐Vázquez, C., Sánchez‐Madrid, F., & Mittelbrunn, M. (2014) · Seminars in Cancer Biology · doi:10.1016/j.semcancer.2014.04.009 · Cited by 766
Research works printed but not linked: 1
- Fang JH, Zhang ZJ, Shang LR, Luo YW, Lin YF, Yuan Y, et al. Hepatoma cell-secreted exosomal microRNA-103 increases vascular permeability and promotes metastasis by targeting junction proteins. Hepatology. 2018;68(4):1459–75. · DOI
Cited by
Sorted by citations
Exosomes: key players in cancer and potential therapeutic strategy
Dai, J., Su, Y., Zhong, S., Cong, L., Liu, B., Yang, J., Tao, Y., He, Z., Chen, C., & Jiang, Y. (2020) · Signal Transduction and Targeted Therapy · doi:10.1038/s41392-020-00261-0 · Cited by 1,186
Targeting STAT3 in Cancer Immunotherapy
Zou, S., Tong, Q., Liu, B., Huang, W., Tian, Y., & Fu, X. (2020) · Molecular Cancer · doi:10.1186/s12943-020-01258-7 · Cited by 1,109
miRNA-based biomarkers, therapies, and resistance in Cancer
He, B., Zhao, Z., Cai, Q., Zhang, Y., Zhang, P., Shi, S., Xie, H., Peng, X., Yin, W., Tao, Y., et al. (2020) · International Journal of Biological Sciences · doi:10.7150/ijbs.47203 · Cited by 651
The biology, function, and applications of exosomes in cancer
Liu, J., Ren, L., Li, S., Li, W., Zheng, X., Yang, Y., Fu, W., Yi, J., Wang, J., & Du, G. (2021) · Acta Pharmaceutica Sinica B · doi:10.1016/j.apsb.2021.01.001 · Cited by 569
Liu, W., Li, L., Rong, Y., Qian, D., Chen, J., Zhou, Z. Y., Luo, Y., Jiang, D., Cheng, L., Zhao, S., et al. (2019) · Acta Biomaterialia · doi:10.1016/j.actbio.2019.12.020 · Cited by 485
Self-citationRoles and mechanisms of exosomal non-coding RNAs in human health and diseases
Li, C., Ni, Y., Xu, H., Xiang, Q., Zhao, Y. Q., Zhan, J., He, J., Li, S., & Liu, Y. (2021) · Signal Transduction and Targeted Therapy · doi:10.1038/s41392-021-00779-x · Cited by 424
Unraveling the complexity of STAT3 in cancer: molecular understanding and drug discovery
Hu, Y., Dong, Z., & Liu, K. (2024) · Journal of Experimental & Clinical Cancer Research · doi:10.1186/s13046-024-02949-5 · Cited by 307
Emerging role of tumor cell plasticity in modifying therapeutic response
Qin, S., Jiang, J., Lü, Y., Nice, E. C., Huang, C., Zhang, J., & He, W. (2020) · Signal Transduction and Targeted Therapy · doi:10.1038/s41392-020-00313-5 · Cited by 289
Kong, J., Tian, H., Zhang, F., Zhang, Z., Li, J., Liu, X., Li, X., Liu, J., Li, X., Jin, D., et al. (2019) · Molecular Cancer · doi:10.1186/s12943-019-1101-4 · Cited by 251
Chu, D., Nguyen, T. T. P., Tien, N. L. B., Khoa, T. D., Thanh, V. V., Quang, T. L., Truong, D. T., Pham, V.-H., Ngọc, V. T. N., Chu-Dinh, T., et al. (2020) · International Journal of Molecular Sciences · doi:10.3390/ijms21030708 · Cited by 242
Emerging roles of exosomal miRNAs in diabetes mellitus
He, X., Kuang, G., Wu, Y., & Ou, C. (2021) · Clinical and Translational Medicine · doi:10.1002/ctm2.468 · Cited by 234
Wang, D., Zhao, C., Xu, F., Zhang, A., Jin, M., Zhang, K., Liu, L., Hua, Q., Zhao, J., Liu, J., et al. (2021) · Theranostics · doi:10.7150/thno.51797 · Cited by 229
Exosomes: Small vesicles with big roles in cancer, vaccine development, and therapeutics
Thakur, A., Parra, D. C., Motallebnejad, P., Brocchi, M., & Chen, H. J. (2021) · Bioactive Materials · doi:10.1016/j.bioactmat.2021.08.029 · Cited by 224
Hypoxia and extracellular vesicles: A review on methods, vesicular cargo and functions
Korvenlaita, N., Pistono, C., Huremagic, B., Jolkkonen, J., Giugno, R., & Malm, T. (2020) · Journal of Extracellular Vesicles · doi:10.1002/jev2.12002 · Cited by 221
Hu, W., Liu, C., Bi, Z., Zhou, Q. Y., Zhang, H., Li, L., Zhang, J., Zhu, W., Song, Y., Zhang, F., et al. (2020) · Molecular Cancer · doi:10.1186/s12943-020-01199-1 · Cited by 215
Treatment of inflammatory bone loss in periodontitis by stem cell-derived exosomes
Lei, F., Li, M., Lin, T., Zhou, H., Wang, F., & Su, X. (2022) · Acta Biomaterialia · doi:10.1016/j.actbio.2021.12.035 · Cited by 213
Self-citationTumor-associated exosomes promote lung cancer metastasis through multiple mechanisms
Jiang, C., Zhang, N., Hu, X., & Wang, H. (2021) · Molecular Cancer · doi:10.1186/s12943-021-01411-w · Cited by 210
The metastasizing mechanisms of lung cancer: Recent advances and therapeutic challenges
Xie, S., Wu, Z., Qi, Y., Wu, B., & Zhu, X. M. (2021) · Biomedicine & Pharmacotherapy · doi:10.1016/j.biopha.2021.111450 · Cited by 209
Exosomes in the hypoxic TME: from release, uptake and biofunctions to clinical applications
He, G., Peng, X., Wei, S., Yang, S., Li, X., Huang, M., Tang, S., Jin, H., Liu, J., Zhang, S., et al. (2022) · Molecular Cancer · doi:10.1186/s12943-021-01440-5 · Cited by 202
The roles of exosomal miRNAs and lncRNAs in lung diseases
Yang, L., Yin, Z., Fan, J., Zhang, S., & Yang, W.-B. (2019) · Signal Transduction and Targeted Therapy · doi:10.1038/s41392-019-0080-7 · Cited by 190
Kumar, A., & Deep, G. (2020) · Cancer Letters · doi:10.1016/j.canlet.2020.03.017 · Cited by 187
STAT3-EMT axis in tumors: Modulation of cancer metastasis, stemness and therapy response
Sadrkhanloo, M., Entezari, M., Orouei, S., Ghollasi, M., Fathi, N., Rezaei, S., Hejazi, E. S., Kakavand, A., Saebfar, H., Hashemi, M., et al. (2022) · Pharmacological Research · doi:10.1016/j.phrs.2022.106311 · Cited by 194
The role of exosomes in liquid biopsy for cancer diagnosis and prognosis prediction
Li, S., Yi, M., Dong, B., Tan, X., Luo, S., & Wu, K. (2020) · International Journal of Cancer · doi:10.1002/ijc.33386 · Cited by 181
Progress of exosomes in the diagnosis and treatment of lung cancer
Xu, K., Zhang, C., Du, T., Gabriel, A. N. A., Wang, X., Li, X., Sun, L. J., Wang, N., Jiang, X., & Zhang, Y. (2020) · Biomedicine & Pharmacotherapy · doi:10.1016/j.biopha.2020.111111 · Cited by 183
Ding, J., Zhang, Y., Cai, X., Zhang, Y., Yan, S., Wang, J., Zhang, S., Yin, T., Yang, C., & Yang, J. (2021) · Theranostics · doi:10.7150/thno.58731 · Cited by 172
Xiong, Y., Chen, L., Yan, C., Zhou, W., Tao, Y., Sun, Y. T., Cao, F., Xue, H., Hu, Y., Chen, D., et al. (2020) · Journal of Nanobiotechnology · doi:10.1186/s12951-020-00622-5 · Cited by 162
RetractedRole of exosomal microRNAs in lung cancer biology and clinical applications
Hu, C., Meiners, S., Lukas, C., Stathopoulos, G. T., & Chen, J. (2020) · Cell Proliferation · doi:10.1111/cpr.12828 · Cited by 153
Wu, X., Zhou, Z., Xu, S., Liao, C., Chen, X., Li, B., Peng, J., Li, D., & Yang, L. (2020) · Cancer Letters · doi:10.1016/j.canlet.2020.03.004 · Cited by 147
Wu, H., Mu, X., Liu, L., Hu, X., Hu, X., Chen, L., Liu, J., Mu, Y., Yuan, F., Liu, W., et al. (2020) · Cell Death and Disease · doi:10.1038/s41419-020-02962-4 · Cited by 145
The epithelial–mesenchymal plasticity landscape: principles of design and mechanisms of regulation
Haerinck, J., Goossens, S., & Berx, G. (2023) · Nature Reviews Genetics · doi:10.1038/s41576-023-00601-0 · Cited by 142
Extracellular Vesicles in Cancer Drug Resistance: Roles, Mechanisms, and Implications
Yang, Q., Xu, J. B., Gu, J., Shi, H., Zhang, J., Zhang, J., Chen, Z., Fang, X., Zhu, T., & Zhang, X. (2022) · Advanced Science · doi:10.1002/advs.202201609 · Cited by 148
Self-citationZhang, H., Wang, J., Ren, T., Huang, Y., Liang, X., Yu, Y., Wang, W., Niu, J., & Guo, W. (2020) · Cancer Letters · doi:10.1016/j.canlet.2020.07.008 · Cited by 136
Extracellular vesicles and particles impact the systemic landscape of cancer
Lucotti, S., Kenific, C. M., Zhang, H., & Lyden, D. C. (2022) · The EMBO Journal · doi:10.15252/embj.2021109288 · Cited by 145
Mesenchymal stem cell-derived exosome: A tumor regulator and carrier for targeted tumor therapy
Zhang, F., Guo, J., Zhang, Z., Qian, Y., Wang, G., Duan, M., Zhao, H., Yang, Z., & Jiang, X. (2022) · Cancer Letters · doi:10.1016/j.canlet.2021.11.015 · Cited by 127
CircOGDH Is a Penumbra Biomarker and Therapeutic Target in Acute Ischemic Stroke
Liu, Y., Li, Y., Zhang, T., Zhang, T., Li, Y., Tan, Z., Ma, D., Zhang, Y., Wang, S., Zhang, Y., et al. (2022) · Circulation Research · doi:10.1161/circresaha.121.319412 · Cited by 131
Hypoxia Induced Changes of Exosome Cargo and Subsequent Biological Effects
Jiang, H., Zhao, H., Zhang, M., He, Y., Li, X., Xu, Y., & Liu, X. (2022) · Frontiers in Immunology · doi:10.3389/fimmu.2022.824188 · Cited by 134
Dou, R., Liu, K., Yang, C., Zheng, J., Shi, D., Lin, X., Chen, W., Zhang, C., Fang, Y., Huang, S., et al. (2021) · Clinical and Translational Medicine · doi:10.1002/ctm2.595 · Cited by 122
Du, Y., Wei, N., Ma, R., Jiang, S., & Song, D. (2020) · Cell Death and Disease · doi:10.1038/s41419-020-02952-6 · Cited by 124
Zhuang, Y., Cheng, M., Li, M., Cui, J., Huang, J., Zhang, C., Si, J., Lin, K., & Yu, H. (2022) · Acta Biomaterialia · doi:10.1016/j.actbio.2022.07.015 · Cited by 122
Zhao, W., Qin, P., Zhang, D., Cui, X., Gao, J., Yu, Z., Chai, Y., Wang, J., & Li, J. (2019) · Aging · doi:10.18632/aging.102406 · Cited by 115
Role of Exosomal miRNAs and the Tumor Microenvironment in Drug Resistance
dos Santos, P. W. D. S., & Almeida, F. B. D. R. (2020) · Cells · doi:10.3390/cells9061450 · Cited by 114
Yang, F., Yan, Y., Yang, Y., Hong, X., Wang, M., Yang, Z., Liu, B., & Ye, L. (2020) · Cellular Signalling · doi:10.1016/j.cellsig.2020.109675 · Cited by 110
RetractedThe Therapeutic Potential and Clinical Significance of Exosomes as Carriers of Drug Delivery System
Li, T., Li, X., Han, G., Liang, M., Yang, Z., Zhang, C., Huang, S., Tai, S., & Yu, S. (2022) · Pharmaceutics · doi:10.3390/pharmaceutics15010021 · Cited by 110
Entezari, M., Ghanbarirad, M., Taheriazam, A., Sadrkhanloo, M., Zabolian, A., Goharrizi, M. A. S. B., Hushmandi, K., Aref, A. R., Ashrafizadeh, M., Zarrabi, A., et al. (2022) · Biomedicine & Pharmacotherapy · doi:10.1016/j.biopha.2022.112963 · Cited by 107
Li, P., Liu, S., Du, L., Mohseni, G., Zhang, Y., & Wang, C. (2022) · Clinical Epigenetics · doi:10.1186/s13148-022-01337-0 · Cited by 106
Wang, L., He, J., Hu, H., Tu, L., Sun, Z., Liu, Y., & Luo, F. (2020) · Journal of Cellular and Molecular Medicine · doi:10.1111/jcmm.15274 · Cited by 100
Self-citationRole and Function of O-GlcNAcylation in Cancer
Lee, J. B., Pyo, K., & Kim, H. R. (2021) · Cancers · doi:10.3390/cancers13215365 · Cited by 103
Liu, H., Liu, Y., Sun, P., Leng, K., Xu, Y., Mei, L., Han, P., Zhang, B., Yao, K., Li, C., et al. (2020) · Clinical Science · doi:10.1042/cs20191087 · Cited by 99
Xiong, Y., Chen, L., Yan, C., Zhou, W., Yu, T., Sun, Y. T., Cao, F., Xue, H., Hu, Y., Dong, C., et al. (2021) · Journal of Nanobiotechnology · doi:10.1186/s12951-021-00828-1 · Cited by 100
Pulido-Escribano, V., Torrecillas-Baena, B., Camacho-Cardeñosa, M., Dorado, G., Gálvez-Moreno, M. Á., & Casado‐Díaz, A. (2022) · World Journal of Stem Cells · doi:10.4252/wjsc.v14.i7.453 · Cited by 100
Current progress and mechanisms of bone metastasis in lung cancer: a narrative review
Wu, S., Pan, Y., Mao, Y., Chen, Y., & He, Y. (2021) · Translational Lung Cancer Research · doi:10.21037/tlcr-20-835 · Cited by 92
Targeted extracellular vesicle delivery systems employing superparamagnetic iron oxide nanoparticles
Zhuo, Z., Wang, J., Luo, Y., Zeng, R., Zhang, C., Zhou, W., Guo, K., Wu, H., Sha, W., & Chen, H. H. (2021) · Acta Biomaterialia · doi:10.1016/j.actbio.2021.07.027 · Cited by 95
Jiang, D., Wu, X., Sun, X., Tan, W., Dai, X. J., Xie, Y., Du, A., & Zhao, Q. (2022) · Journal of Nanobiotechnology · doi:10.1186/s12951-021-01206-7 · Cited by 90
RetractedExosomes in hypoxia-induced remodeling of the tumor microenvironment
Kumar, A., & Deep, G. (2020) · Cancer Letters · doi:10.1016/j.canlet.2020.05.018 · Cited by 89
Wang, K., Ru, J., Zhang, H., Chen, J., Lin, X., Lin, Z., Wen, M., Huang, L., Ni, H., Zhuge, Q., et al. (2020) · Frontiers in Neuroscience · doi:10.3389/fnins.2020.00848 · Cited by 87
The role of exosomes in lung cancer metastasis and clinical applications: an updated review
Yin, L., Liu, X., Shao, X., Feng, T., Xu, J., Wang, Q., & Hua, S. (2021) · Journal of Translational Medicine · doi:10.1186/s12967-021-02985-1 · Cited by 92
Lei, B., Wang, D., Zhang, M., Deng, Y., Jiang, H., & Li, Y. (2020) · Journal of Experimental & Clinical Cancer Research · doi:10.1186/s13046-020-01571-5 · Cited by 85
Zhan, Y., Du, J.-X., Min, Z., Ma, L., Zhang, W., Zhu, W., & Liu, Y. (2021) · Cell Death Discovery · doi:10.1038/s41420-021-00506-z · Cited by 84
Targeting STAT3 inhibition to reverse cisplatin resistance
Sun, C., Nie, J., Huang, J.-P., Zheng, G., & Feng, B. (2019) · Biomedicine & Pharmacotherapy · doi:10.1016/j.biopha.2019.109135 · Cited by 83
Extracellular vesicles in cancer´s communication: messages we can read and how to answer
Semerádtová, A., Liegertová, M., Herma, R., Čapková, M., Brignole, C., & Zotto, G. D. (2025) · Molecular Cancer · doi:10.1186/s12943-025-02282-1 · Cited by 95
Non-coding RNAs shuttled via exosomes reshape the hypoxic tumor microenvironment
Wang, W., Han, Y., Jo, H. A., Lee, J., & Song, Y. S. (2020) · Journal of Hematology & Oncology · doi:10.1186/s13045-020-00893-3 · Cited by 84
Luo, Z., Sun, Y., Qi, B., Lin, J., Chen, Y., Xu, Y., & Chen, J. (2022) · Bioactive Materials · doi:10.1016/j.bioactmat.2022.01.016 · Cited by 82
Exosomes and organ-specific metastasis
Zhao, L., Ma, X., & Yu, J. (2021) · Molecular Therapy — Methods & Clinical Development · doi:10.1016/j.omtm.2021.05.016 · Cited by 82
Potential therapeutic effects of milk-derived exosomes on intestinal diseases
Cui, Z., Amevor, F. K., Zhao, X., Mou, C., Pang, J., Peng, X., Liu, A., Lan, X., & Liu, L. (2023) · Journal of Nanobiotechnology · doi:10.1186/s12951-023-02176-8 · Cited by 82
Wang, Y., Zhao, R., Shen, C., Liu, W., Yuan, J., Li, C., Deng, W., Wang, Z., Zhang, W., Ge, J., et al. (2020) · Oxidative Medicine and Cellular Longevity · doi:10.1155/2020/8418407 · Cited by 80
Self-citationHuang, Y., Kanada, M., Ye, J., Deng, Y., He, Q., Lei, Z., Chen, Y., Li, Y., Qin, P., Zhang, J., et al. (2022) · Cancer Letters · doi:10.1016/j.canlet.2022.215796 · Cited by 76
Extracellular vesicles set the stage for brain plasticity and recovery by multimodal signalling
Hermann, D. M., Peruzzotti‐Jametti, L., Giebel, B., & Pluchino, S. (2023) · Brain · doi:10.1093/brain/awad332 · Cited by 79
The Long and Short of It: The Emerging Roles of Non-Coding RNA in Small Extracellular Vesicles
Abramowicz, A., & Story, M. D. (2020) · Cancers · doi:10.3390/cancers12061445 · Cited by 76
Exosomal miRNAs: the tumor's trojan horse in selective metastasis
Bayat, M., & Nahand, J. S. (2024) · Molecular Cancer · doi:10.1186/s12943-024-02081-0 · Cited by 81
Exosome-Mediated Crosstalk Between Tumor and Tumor-Associated Macrophages
Chen, Q., Li, Y., Gao, W., Chen, L., Xu, W., & Zhu, X. (2021) · Frontiers in Molecular Biosciences · doi:10.3389/fmolb.2021.764222 · Cited by 76
Shi, Y., Wang, S., Wang, K., Yang, R., Liu, D., Liao, H., Qi, Y., Qiu, K., Hu, Y., Wen, H., et al. (2024) · Small · doi:10.1002/smll.202309276 · Cited by 76
Mesenchymal stromal cells as cancer promoters
Antoon, R., Overdevest, N., Saleh, A. H., & Keating, A. (2024) · Oncogene · doi:10.1038/s41388-024-03183-1 · Cited by 75
Hermann, D. M., Xin, W., Bähr, M., Giebel, B., & Doeppner, T. R. (2022) · Theranostics · doi:10.7150/thno.73931 · Cited by 75
Li, C., & Xu, X. (2019) · Cellular and Molecular Life Sciences · doi:10.1007/s00018-019-03215-0 · Cited by 70
Li, C., Qin, F., Wang, W., Ni, Y., Gao, M., Guo, M., & Sun, G. (2021) · International Journal of Molecular Sciences · doi:10.3390/ijms222312866 · Cited by 69
BMSC-derived exosomes promote osteoporosis alleviation via M2 macrophage polarization
Zhang, Y., Bai, J., Xiao, B., & Li, C. (2024) · Molecular Medicine · doi:10.1186/s10020-024-00904-w · Cited by 70
Peppicelli, S., Calorini, L., Bianchini, F., Papucci, L., Magnelli, L., & Andreucci, E. (2024) · Cellular Oncology · doi:10.1007/s13402-024-00969-z · Cited by 72
Exosomal Non-coding RNAs-Mediated Crosstalk in the Tumor Microenvironment
Chen, Q., Li, Y., Liu, Y., Xu, W., & Zhu, X. (2021) · Frontiers in Cell and Developmental Biology · doi:10.3389/fcell.2021.646864 · Cited by 65
Ge, X., Liu, W., Zhao, W., Feng, S., Duan, A., Ji, C., Shen, K., Liu, W., Zhou, J., Jiang, D., et al. (2020) · Molecular Therapy — Nucleic Acids · doi:10.1016/j.omtn.2020.07.025 · Cited by 63
Wang, L., Wang, Y., & Quan, J. (2020) · Molecular Medicine · doi:10.1186/s10020-020-00207-w · Cited by 63
Self-citationThe role of exosomes from BALF in lung disease
Liu, Z., Yan, J., Tong, L., Liu, S., & Zhang, Y. (2021) · Journal of Cellular Physiology · doi:10.1002/jcp.30553 · Cited by 61
Current Landscape of Epigenetics in Lung Cancer: Focus on the Mechanism and Application
Shi, Y.-X., Sheng, D., Cheng, L. Z., & Song, X.-Y. (2019) · Journal of Oncology · doi:10.1155/2019/8107318 · Cited by 64
How hypoxia regulate exosomes in ischemic diseases and cancer microenvironment?
Yaghoubi, S., Najminejad, H., Dabaghian, M., Karimi, M. H., Abdollahpour‐Alitappeh, M., Rad, F., Mahi‐Birjand, M., Mohammadi, S., Mohseni, F., Lari, M. S., et al. (2020) · IUBMB Life · doi:10.1002/iub.2275 · Cited by 63
Zang, J., Wu, Y., Su, X., Zhang, T., Tang, X., Ma, D., Li, Y., Liu, Y., Weng, Z., Liu, X., et al. (2021) · Frontiers in Cell and Developmental Biology · doi:10.3389/fcell.2020.616590 · Cited by 60
Extracellular Vesicles for Drug Delivery in Cancer Treatment
Wang, L., Yu, X., Zhou, J., & Su, C. (2023) · Biological Procedures Online · doi:10.1186/s12575-023-00220-3 · Cited by 61
Self-citationZhang, X., Wang, T., Wang, Z., Huang, K., Zhang, Y., Wang, G., Zhang, H., Chen, Z.-H., Wang, C., Zhang, J., et al. (2021) · Molecular Therapy — Nucleic Acids · doi:10.1016/j.omtn.2021.07.014 · Cited by 62
Self-citationNie, H., Liao, Z., Wang, Y., Zhou, J., He, X., & Ou, C. (2020) · Genes & Diseases · doi:10.1016/j.gendis.2020.12.004 · Cited by 58
Self-citationLyu, Z., Xin, M., Oyston, D. R., Xue, T., Kang, H., Wang, X., Wang, Z., & Wang, Z. (2024) · Pathology - Research and Practice · doi:10.1016/j.prp.2024.155354 · Cited by 58
Chen, H., Li, J.-J., Jiang, F., Shi, W., & Chang, G. (2019) · Bioscience Biotechnology and Biochemistry · doi:10.1080/09168451.2019.1677452 · Cited by 57
Liu, J., Feng, Y., Zeng, X., He, M., Gong, Y., & Liu, Y. (2020) · Journal of Cellular and Molecular Medicine · doi:10.1111/jcmm.15866 · Cited by 56
Hypoxia-Regulated Tumor-Derived Exosomes and Tumor Progression: A Focus on Immune Evasion
Shao, X., Hua, S., Feng, T., Ocansey, D. K. W., & Yin, L. (2022) · International Journal of Molecular Sciences · doi:10.3390/ijms231911789 · Cited by 60
Huang, Y., Liu, W., He, B., Wang, L., Zhang, F., Shu, H., & Sun, L. (2020) · Journal of Bone Oncology · doi:10.1016/j.jbo.2020.100280 · Cited by 55
Self-citationTherapeutic Potential of Exosomes in Pulmonary Fibrosis
Xie, L., & Zeng, Y. (2020) · Frontiers in Pharmacology · doi:10.3389/fphar.2020.590972 · Cited by 55
Zhang, Z., Hu, J., Ishihara, M., Sharrow, A. C., Flora, K., He, Y., & Wu, L. (2022) · International Journal of Molecular Sciences · doi:10.3390/ijms23063005 · Cited by 54
Zhou, S., Yu, L., Li, Y., Li, Z., Pu, J., & Wei, L. (2022) · Cell Transplantation · doi:10.1177/09636897221106998 · Cited by 57
Hypoxia‐Induced FUS–circTBC1D14 Stress Granules Promote Autophagy in TNBC
Liu, Y., Liu, Y., He, Y., Zhang, N., Zhang, S., Li, Y., Wang, X., Liang, Y., Chen, X., Zhao, W., et al. (2023) · Advanced Science · doi:10.1002/advs.202204988 · Cited by 56
Self-citationTumor-derived nanoseeds condition the soil for metastatic organotropism
Hu, M., Kenific, C. M., Boudreau, N. J., & Lyden, D. C. (2023) · Seminars in Cancer Biology · doi:10.1016/j.semcancer.2023.05.003 · Cited by 53
Underlying mechanisms and drug intervention strategies for the tumour microenvironment
Li, H., Zhou, L., Zhou, J., Li, Q., & Ji, Q. (2021) · Journal of Experimental & Clinical Cancer Research · doi:10.1186/s13046-021-01893-y · Cited by 51
The Role and Therapeutic Potential of Macropinocytosis in Cancer
Qiu, Z., Liu, W., Zhu, Q., Ke, K., Zhu, Q., Jin, W., Yu, S., Yang, Z., Li, L., Sun, X., et al. (2022) · Frontiers in Pharmacology · doi:10.3389/fphar.2022.919819 · Cited by 52
Hisakane, K., Seike, M., Sugano, T., Yoshikawa, A., Matsuda, K., Takano, N., Takahashi, S., Noro, R., & Gemma, A. (2021) · Thoracic Cancer · doi:10.1111/1759-7714.13943 · Cited by 50
Metadata
- Authors
- Zhang, X., Sai, B., Wang, F., Wang, L., Wang, Y., Zheng, L., Li, G., Tang, J., & Xiang, J.
- Affiliations
- Central South University (CN)
- Corresponding author
- Tang, Jingqun
- Xiang, Juanjuan
- Venue
- Molecular Cancer
- Published
- 2019-03-13
- Volume
- 18
- Issue
- 1
- Pages
- 40-40
- ISSN
- 1476-4598 (ISSN-L)
- PMC
- PMC6417285
- OpenAlex
- W2938403043
- Cited by
- 560
- References
- 50
- Citations by year
- 2026: 34 · 2025: 61 · 2024: 96 · 2023: 94 · 2022: 114 · 2021: 81 · 2020: 63 · 2019: 16
- FWCI
- 23.01
- Type
- journal article
- Language
- en
- Open access
- gold
- doi.org
- Licence
- Locations
- Molecular Cancer (publishedVersion, cc-by)
- Europe PMC (PubMed Central) (publishedVersion, other-oa)
- PubMed Central (publishedVersion, cc-by)
- PubMed (publishedVersion)
- DOAJ (DOAJ: Directory of Open Access Journals) (submittedVersion, cc-by-sa)
- Funders
- National Natural Science Foundation of China (81472695, 81773147)
- Strategic Priority Research Program of Central South University (ZLXD2017004)
- National Training and Research Base for Talents of principles of carcinogenesis foundation (111 project: 111-2-12)
- Topics
- Life Sciences › Biochemistry, Genetics and Molecular Biology › Molecular Biology › Extracellular vesicles in disease
- Life Sciences › Biochemistry, Genetics and Molecular Biology › Cancer Research › MicroRNA in disease regulation
- Health Sciences › Medicine › Oncology › Cancer Cells and Metastasis
- Keywords
- lung cancer metastasis, bone marrow-derived mesenchymal stem cells, exosomes, exosomal microRNAs, hypoxia, STAT3 signaling, epithelial-mesenchymal transition, tumor invasion, miR-193a-3p, miR-210-3p, tumor microenvironment, exosome-mediated intercellular communication
- MeSH terms
- Animals, Hypoxia, Cell Movement, Female, Follow-Up Studies, Humans, Lung Neoplasms, Male, Mice, Inbred C57BL, Mice, Nude, Middle Aged, Prognosis, Tumor Cells, Cultured, Biomarkers, Tumor, Signal Transduction, Gene Expression Regulation, Neoplastic, Survival Rate, Case-Control Studies, Apoptosis, Xenograft Model Antitumor Assays, MicroRNAs, Cell Proliferation, STAT3 Transcription Factor, Mice, Exosomes, Epithelial-Mesenchymal Transition, Mesenchymal Stem Cells
About these checks
Registry, retraction, Cites and statistics results are computed, not judged, with one exception: a printed reference that no index lists is read once by a model before it counts as a citation error. Claims are extracted by a model and kept only when their quote appears verbatim in the text; each cited source is then checked, with a model’s help, for whether it says what the claim relies on. Those verdicts can be wrong — read the claim’s quote and the cited source before relying on one.
Statistics and arithmetic are recomputed, not judged.
Confidence bands are shown only for fields calibrated on our annotated test set. None is calibrated yet, so no band is shown.
What counts as a claim ›How we measure confidence ›How we check this ›
Are you an author, or do you see a problem with this page? Request a review
