

High-throughput human microfluidic organoid-on-a-chip platform for modeling liver diseases and screening nanotherapeutics.
Open accessThe DOI matches its Crossref record; 44 of the 44 references it cites were found in a registry or an index; 12 of the 17 sources its claims cite were checked for support.
Abstract
We combined healthy human liver tissue-derived organoids with a high-throughput three-lane OrganoPlate microfluidic format to establish a perfused organoid Liver-on-Chip (HepLoC) featuring 3D luminal tubules under continuous flow... As a proof-of-concept for drug-induced liver injury, troglitazone induced dose-dependent hepatocyte injury... To model metabolic liver disease, free fatty acids triggered lipid droplet accumulation...
Overview
CoChat Summary
TL;DR
The paper builds a high-throughput human liver organoid-on-a-chip (HepLoC) by integrating healthy human liver tissue–derived organoids into a perfused OrganoPlate microfluidic system. HepLoC forms mature hepatocyte-like tubules with functional bile canaliculi and is used to model troglitazone-induced cholestasis, free-fatty-acid–induced early MAFLD features, and to screen nanotherapeutics.
Key findings
- Organoid-derived cells self-organized into 3D luminal tubules in chip after about 1 week of dynamic culture, and FITC-dextran leakage was delayed in fully confluent tubules cultured for 6 days, indicating a functional epithelial barrier.
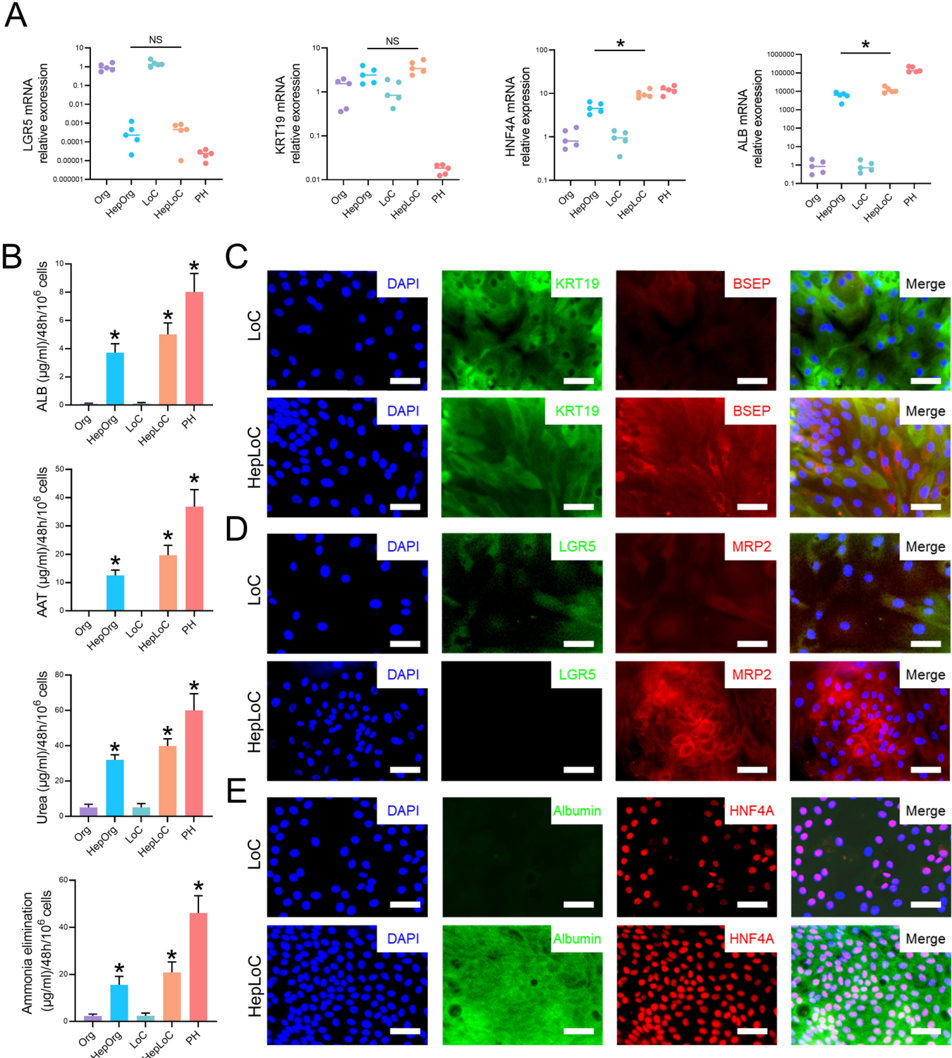
- HepLoC showed stronger hepatocyte maturation than 3D organoids, with increased mature hepatocyte markers and functions: higher ALB and HNF4A expression, detectable albumin and AAT secretion, and enhanced urea synthesis and ammonia elimination, approaching primary hepatocytes.
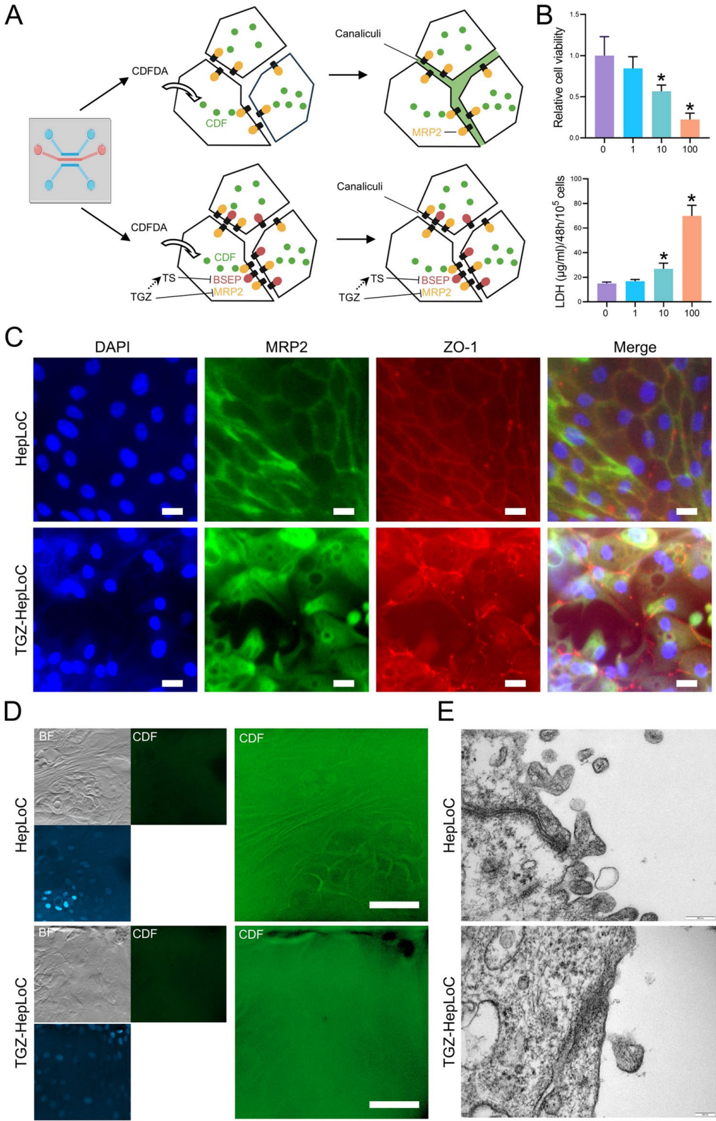
- HepLoC formed functional bile canaliculi: CDF accumulated between cell junctions in HepLoC but largely stayed inside LoC, and TEM showed larger tight junctions and bile canaliculi in HepLoC.
- Troglitazone induced dose-dependent hepatocyte injury with decreased viability, increased LDH, MRP2 and ZO-1 mislocalization, impaired bile acid transport, and tight-junction disruption; free fatty acids caused lipid droplet accumulation, increased triglycerides and ROS, and upregulated TNFA and IL6 while largely preserving viability.
- In the screening application, reference hepatotoxins and LNP components were discriminated by viability assays; DSPE-PEG 2000 was biocompatible, DOTAP chloride was hepatotoxic, and D-Lin-MC3-DMA was safe at therapeutically relevant concentrations but toxic at higher doses. Curcumin liposomes reduced lipid accumulation more effectively than free curcumin with minimal hepatotoxicity.
Methods
- Human liver organoids were established from healthy human liver tissue, expanded in Matrigel/Ultimatrix, then seeded as single cells into the upper perfusion channels of a 3-lane OrganoPlate with collagen I in the central channel; chips were cultured under dynamic flow on an OrganoFlow system.
- Hepatocyte differentiation used a 2-step protocol: 1 week in BMP7-supplemented expansion medium followed by 1 week in hepatocyte differentiation medium containing factors including EGF, HGF, A83-01, DAPT, dexamethasone, BMP7, and FGF19.
- Main analyses included immunofluorescence, ELISA, urea and ammonia assays, FITC-dextran barrier testing, CDFDA-based bile canaliculi imaging, TEM, qRT-PCR, RNA-seq/GSEA, ROS staining, and PrestoBlue viability assays for drug and nanoparticle screening.
Limitations
- The paper states that HepLoC is “primarily” parenchymal-cell based and therefore a simplified version of the complex liver microenvironment; it says future versions should add non-parenchymal cells such as hepatic stellate cells and Kupffer cells.
- The paper states that HepLoC still does not reach primary hepatocyte levels for some functions, and that further differentiation protocols need to be developed.
- Evident from the text: the paper uses healthy donor liver tissue and models early-stage MAFLD and cholestasis in vitro, so it does not directly test advanced disease, patient-specific disease variation, or in vivo outcomes.
Model-written summary. Check it against the paper before relying on it.
Integrity signals
Registry
Cites
Statistics
Figures






Verification
Claims the paper makes
7 Valid · 2 Not valid · 2 Not checked · 127 Own results and interpretations
Every source the paper cites for this claim was checked and supports it.
In the paper
“First, we validated the established hepatocyte differentiation protocols [24] using 3D liver organoids cultured in 3D Matrigel Fig. S1).”
§ High-throughput human microfluidic organoid-on-a-chip platform for modeling liver diseases and screening nanotherapeutics > Results > Differentiating organoid-derived cells to hepatocytes in LoC
What the sources say
- Supportedcites [24] Huch M, Gehart H, van Boxtel R, Hamer K, Blokzijl F, Verstegen MM, Ellis E, van Wenum M, Fuchs SA, de Ligt J, van de Wetering M, Sasaki N, Boers SJ, Kemperman H, de Jonge J, Ijzermans JN, Nieuwenhuis EE, Hoekstra R, Strom S, Vries RR, van der Laan LJ, Cuppen E, Clevers H. Long-term culture of genome-stable bipotent stem cells from adult human liver. Cell. 2015;160(1–2):299–312. 10.1016/j.cell.2014.11.050. 25533785 PMC4313365 source
The Results section describes the paper’s hepatocyte differentiation medium and its effects on liver organoids. The Experimental Procedures describe the differentiation protocol and culturing the organoids in Matrigel or BME. The citing authors’ statement that they validated the protocol is their own action, not a result attributed to this source; page numbers are not provided in our copy. (LLM, conf=0.91)
plain- Asserted: passes — The authors put it forward as true.
- Checkable: passes — It can be checked against evidence.
- Load-bearing: passes — The paper’s conclusions depend on it.
- Based: passes — The paper gives a reason why it holds.
- Supported
A result the paper reports from its own data — it cites no other source for it, so there is none to check. The quote shows it is in the paper.
In the paper
“First, we successfully established organoids derived from leucine-rich repeat-containing G-protein-coupled receptor 5-positive (LGR5⁺) liver progenitor cells using tissues from healthy human livers (Fig. 1A).”
§ High-throughput human microfluidic organoid-on-a-chip platform for modeling liver diseases and screening nanotherapeutics > Results > Schematic representation of liver organoid chips using high-throughput OrganoPlate
boosted- Asserted: passes — The authors put it forward as true.
- Checkable: passes — It can be checked against evidence.
- Load-bearing: passes — The paper’s conclusions depend on it.
- Based: passes — The paper gives a reason why it holds.
A result the paper reports from its own data — it cites no other source for it, so there is none to check. The quote shows it is in the paper.
In the paper
“PCA analysis and heatmap showed the obvious differences between HepOrg and HepLoC (Fig. 4A and S2A”
§ High-throughput human microfluidic organoid-on-a-chip platform for modeling liver diseases and screening nanotherapeutics > Results > Promotion of hepatocyte maturation in HepLoC compared with 3D liver organoids
boostedstates an associationn = 3- Asserted: passes — The authors put it forward as true.
- Checkable: passes — It can be checked against evidence.
- Load-bearing: passes — The paper’s conclusions depend on it.
- Based: passes — The paper gives a reason why it holds.
A result the paper reports from its own data — it cites no other source for it, so there is none to check. The quote shows it is in the paper.
In the paper
“Further characterization via 3D reconstruction of organoid cell nuclei confirmed that this cell layer had self-assembled into a continuous cellular tubule, a key structural feature of Liver-on-Chip (LoC) system (Fig. 2B and C).”
§ High-throughput human microfluidic organoid-on-a-chip platform for modeling liver diseases and screening nanotherapeutics > Results > Establishing 3D lumen structure with human liver organoids-derived cells in LoC
plain- Asserted: passes — The authors put it forward as true.
- Checkable: passes — It can be checked against evidence.
- Load-bearing: passes — The paper’s conclusions depend on it.
- Based: passes — The paper gives a reason why it holds.
A result the paper reports from its own data — it cites no other source for it, so there is none to check. The quote shows it is in the paper.
In the paper
“The results indicated an exhibited enhanced hepatocyte feature on HepLoC.”
§ High-throughput human microfluidic organoid-on-a-chip platform for modeling liver diseases and screening nanotherapeutics > Results > Promotion of hepatocyte maturation in HepLoC compared with 3D liver organoids
hedgedstates an associationn = 3- Asserted: passes — The authors put it forward as true.
- Checkable: passes — It can be checked against evidence.
- Load-bearing: passes — The paper’s conclusions depend on it.
- Based: passes — The paper gives a reason why it holds.
78 more claims
Create a free account to see all 138 claims and every source verdict.
- Probably not a substantial claim. 8
- It may state two separate claims as one. 49
Citations
Cites
Organogenesis in a dish: Modeling development and disease using organoid technologies
Lancaster, M. A., & Knoblich, J. A. (2014) · Science · doi:10.1126/science.1247125 · Cited by 2,931 · cited 1×
“…stem cells (ESCs), or induced pluripotent stem cells (iPSCs), have emerged as powerful tools to model human organ development, homeostasis, and strategies, which deciphers the mechanisms of liver diseases, bridging the gap between preclinical research and clinical translation. disease [9, 10].”
Vascularized and functional human liver from an iPSC-derived organ bud transplant
Takebe, T., Sekine, K., Enomura, M., Koike, H., Kimura, M., Ogaeri, T., Zhang, R.-R., Ueno, Y., Zheng, Y.-W., Koike, N., et al. (2013) · Nature · doi:10.1038/nature12271 · Cited by 2,170 · cited 1×
“In vitro systems using hepatoma-derived cell lines provide convenient and scalable platforms, but they exhibit only partial features of mature hepatocytes and lack appropriate tissue architecture [6, 7].”
Long-Term Culture of Genome-Stable Bipotent Stem Cells from Adult Human Liver
Huch, M., Gehart, H., van Boxtel, R., Hamer, K., Blokzijl, F., Verstegen, M. M. A., Ellis, E., van Wenum, M., Fuchs, S. A., de Ligt, J., et al. (2015) · Cell · doi:10.1016/j.cell.2014.11.050 · Cited by 1,619
In vitro expansion of single Lgr5+ liver stem cells induced by Wnt-driven regeneration
Huch, M., Dorrell, C., Boj, S. F., van Es, J. H., Li, V. S. W., van de Wetering, M., Sato, T., Hamer, K., Sasaki, N., Finegold, M. J., et al. (2013) · Nature · doi:10.1038/nature11826 · Cited by 1,555 · cited 1×
“Liver organoids derived from leucine-rich repeat–containing G protein–coupled receptor 5 (LGR5)–positive liver progenitor cells (LPC) can be stably maintained for months and can differentiate into functionally competent hepatocytes and cholangiocytes [14–16].”
Can Animal Models of Disease Reliably Inform Human Studies?
van der Worp, H. B., Howells, D. W., Sena, E. S., Porritt, M. J., Rewell, S., O'Collins, V., & Macleod, M. R. (2010) · PLoS Medicine · doi:10.1371/journal.pmed.1000245 · Cited by 1,354 · cited 1×
“Conventional in vivo liver models based on genetic, dietary, or drug-induced manipulations in rodents often fail to capture human-specific disease mechanisms and drug responses [3, 4].”
Gadaleta, R. M., van Erpecum, K. J., Oldenburg, B., Willemsen, E. C. L., Renooij, W., Murzilli, S., Klomp, L. W. J., Siersema, P. D., Schipper, M. E. I., Danese, S., et al. (2011) · Gut · doi:10.1136/gut.2010.212159 · Cited by 870 · cited 1×
“Beyond regulating lipid metabolism, FXR agonists are known to alleviate endoplasmic reticulum stress and suppress oxidative damage by upregulating antioxidant and anti-apoptotic pathways [42, 43].”
Maschmeyer, I., Lorenz, A. K., Schimek, K., Hasenberg, T., Ramme, A. P., Hübner, J., Lindner, M., Drewell, C., Bauer, S., Thomas, A., et al. (2015) · Lab on a Chip · doi:10.1039/c5lc00392j · Cited by 861
Broutier, L., Andersson-Rolf, A., Hindley, C. J., Boj, S. F., Clevers, H., Koo, B.-K., & Huch, M. (2016) · Nature Protocols · doi:10.1038/nprot.2016.097 · Cited by 834 · cited 1×
“Human liver organoids were generated following the protocol described by Broutier et al. with modifications based on our previous research [22, 23].”
Farnesoid X receptor antagonizes nuclear factor κB in hepatic inflammatory response
Wang, Y.-D., Chen, W.-D., Wang, M., Yu, D., Forman, B. M., & Huang, W. (2008) · Hepatology · doi:10.1002/hep.22519 · Cited by 639
Preclinical models of non-alcoholic fatty liver disease
Santhekadur, P. K., Kumar, D. P., & Sanyal, A. J. (2018) · Journal of Hepatology · doi:10.1016/j.jhep.2017.10.031 · Cited by 380
Vos, T. A., Hooiveld, G. J., Koning, H., Childs, S., Meijer, D. K., Moshage, H., Jansen, P. L., & Müller, M. (1998) · Hepatology · doi:10.1002/hep.510280625 · Cited by 362
Liver organoids: from basic research to therapeutic applications
Prior, N., Inacio, P., & Huch, M. (2019) · Gut · doi:10.1136/gutjnl-2019-319256 · Cited by 356 · cited 1×
“Compared with 2D monolayer culture, 3D organoids more faithfully reproduce the cellular composition, spatial organization, and functional properties of native tissues [11, 12].”
Structural and functional hepatocyte polarity and liver disease
Gissen, P., & Arias, I. M. (2015) · Journal of Hepatology · doi:10.1016/j.jhep.2015.06.015 · Cited by 315
Pluripotent stem cell-derived hepatocyte-like cells
Schwartz, R. E., Fleming, H. E., Khetani, S. R., & Bhatia, S. N. (2014) · Biotechnology Advances · doi:10.1016/j.biotechadv.2014.01.003 · Cited by 282
Molecular Obstacles to Clinical Translation of iPSCs
Tapia, N., & Schöler, H. R. (2016) · Cell Stem Cell · doi:10.1016/j.stem.2016.06.017 · Cited by 141 · cited 1×
“Among different organoid types, tissue-resident progenitor cell–derived organoids are particularly attractive for personalized medicine because they preserve patient-specific genetic and epigenetic backgrounds and can be expanded long-term [13].”
Large‐Scale Production of LGR5‐Positive Bipotential Human Liver Stem Cells
Schneeberger, K., Sánchez‐Romero, N., Ye, S., van Steenbeek, F. G., Oosterhoff, L. A., Pla Palacin, I., Chen, C., van Wolferen, M. E., van Tienderen, G., Lieshout, R., et al. (2020) · Hepatology · doi:10.1002/hep.31037 · Cited by 141
Challenges and Opportunities in the Design of Liver-on-Chip Microdevices
Ehrlich, A., Duche, D., Ouedraogo, G., & Nahmias, Y. (2019) · Annual Review of Biomedical Engineering · doi:10.1146/annurev-bioeng-060418-052305 · Cited by 125 · cited 2×
“OoC systems have become increasingly used in academia and the pharmaceutical industry to model human organ function and pathophysiology as well as for drug testing [8, 19].”
Li, W., Zhou, Z., Zhou, X., Khoo, B. L., Gunawan, R., Chin, Y. R., Zhang, L., Yi, C., Guan, X., & Yang, M. (2023) · Advanced Healthcare Materials · doi:10.1002/adhm.202202609 · Cited by 119 · cited 1×
“…stem cells (ESCs), or induced pluripotent stem cells (iPSCs), have emerged as powerful tools to model human organ development, homeostasis, and strategies, which deciphers the mechanisms of liver diseases, bridging the gap between preclinical research and clinical translation. disease [9, 10].”
In vitro grafting of hepatic spheroids and organoids on a microfluidic vascular bed
Bonanini, F., Kurek, D., Previdi, S., Nicolas, A., Hendriks, D., de Ruiter, S., Meyer, M., Clapés Cabrer, M., Dinkelberg, R., García, S. B., et al. (2022) · Angiogenesis · doi:10.1007/s10456-022-09842-9 · Cited by 112
Biliary organoids uncover delayed epithelial development and barrier function in biliary atresia
Amarachintha, S. P., Mourya, R., Ayabe, H., Yang, L., Luo, Z., Li, X., Thanekar, U., Shivakumar, P., & Bezerra, J. A. (2022) · Hepatology · doi:10.1002/hep.32107 · Cited by 98 · cited 1×
“Liver organoids derived from leucine-rich repeat–containing G protein–coupled receptor 5 (LGR5)–positive liver progenitor cells (LPC) can be stably maintained for months and can differentiate into functionally competent hepatocytes and cholangiocytes [14–16].”
On-chip three-dimensional cell culture in phaseguides improves hepatocyte functions in vitro
Jang, M., Neuzil, P., Volk, T., Manz, A., & Kleber, A. (2015) · Biomicrofluidics · doi:10.1063/1.4922863 · Cited by 95
Goto, T., Itoh, M., Suganami, T., Kanai, S., Shirakawa, I., Sakai, T., Asakawa, M., Yoneyama, T., Kai, T., & Ogawa, Y. (2018) · Scientific Reports · doi:10.1038/s41598-018-26383-8 · Cited by 88
Tutty, M. A., Movia, D., & Prina‐Mello, A. (2022) · Drug Delivery and Translational Research · doi:10.1007/s13346-022-01147-0 · Cited by 75
Human branching cholangiocyte organoids recapitulate functional bile duct formation
Roos, F. J. M., van Tienderen, G. S., Wu, H., Bordeu, I., Vinke, D., Albarinos, L. M., Monfils, K., Niesten, S., Smits, R., Willemse, J., et al. (2022) · Cell Stem Cell · doi:10.1016/j.stem.2022.04.011 · Cited by 70
Natarajan, V., Simoneau, C. R., Erickson, A. L., Meyers, N. L., Baron, J. L., Cooper, S., McDevitt, T. C., & Ott, M. (2022) · Open Biology · doi:10.1098/rsob.210320 · Cited by 65
Shashni, B., Tajika, Y., Ikeda, Y., Nishikawa, Y., & Nagasaki, Y. (2023) · Biomaterials · doi:10.1016/j.biomaterials.2023.122047 · Cited by 59 · cited 1×
“We exposed HepLoC to a mixture of free fatty acids (FFA; oleic acid 500 µM and palmitic acid 250 µM) to evaluate the applicability of HepLoC for modelling MAFLD, a disease associated with excess lipid accumulation in the liver [30, 31].”
Smith‐Cortinez, N., Fagundes, R. R., Gómez‐Mellado, V. E., Kong, D., de Waart, D. R., Heegsma, J., Sydor, S., Olinga, P., de Meijer, V. E., Taylor, C. T., et al. (2020) · The FASEB Journal · doi:10.1096/fj.202001564rr · Cited by 52
Self-citationA Pillar and Perfusion Plate Platform for Robust Human Organoid Culture and Analysis
Kang, S., Kimura, M., Shrestha, S., Lewis, P., Lee, S., Cai, Y., Joshi, P., Acharya, P., Liu, J., Yang, Y., et al. (2024) · Advanced Healthcare Materials · doi:10.1002/adhm.202302502 · Cited by 44
Liver Transplantation: From Inception to Clinical Practice
Vilarinho, S., & Lifton, R. P. (2012) · Cell · doi:10.1016/j.cell.2012.08.030 · Cited by 37
Liver organoids: established tools for disease modeling and drug development
Sun, X.-C., Kong, D.-F., Zhao, J., Faber, K. N., Xia, Q., & He, K. (2023) · Hepatology Communications · doi:10.1097/hc9.0000000000000105 · Cited by 37 · cited 3×
“In addition, these organoids show high genomic stability [24, 30] therefore, they have specific advantages over the use of primary or iPSC-derived liver cells.”
Self-citationTelles-Silva, K. A., Pacheco, L. V. B., Komatsu, S., Chianca, F., de Caires-Junior, L. C., Araújo, B. H. S., Goulart, E., & Zatz, M. (2022) · Frontiers in Bioengineering and Biotechnology · doi:10.3389/fbioe.2022.845360 · Cited by 36
Shi, Q., Arefin, A., Ren, L., Papineau, K. S., Barnette, D. A., Schnackenberg, L. K., Hawes, J. J., Avigan, M., Mendrick, D. L., Ewart, L. C., et al. (2022) · Current Protocols · doi:10.1002/cpz1.478 · Cited by 34
Cox, B., Barton, P., Class, R., Coxhead, H., Delatour, C., Gillent, E., Henshall, J., Isin, E. M., King, L. M., & Valentin, J. (2022) · Biomaterials and Biosystems · doi:10.1016/j.bbiosy.2022.100054 · Cited by 34
Wu, W., Feng, A., Ma, W., Li, D., Zheng, S., Xu, F., Han, D., & Lyu, J. (2022) · Frontiers in Cardiovascular Medicine · doi:10.3389/fcvm.2022.891963 · Cited by 30
Wang, L., Koui, Y., Kanegae, K., Kido, T., Tamura-Nakano, M., Yabe, S., Tai, K., Nakajima, Y., Kusuhara, H., Sakai, Y., et al. (2024) · Biomaterials · doi:10.1016/j.biomaterials.2024.122621 · Cited by 25 · cited 1×
“To investigate the applicability of HepLoC for modeling drug-induced cholestasis, we exposed HepLoC cultures to Troglitazone (TGZ), a known cholestatic liver injury agent that inhibits MRP2 and BSEP activity [28, 29].”
Hagiwara, Y., Kumagai, H., Ouwerkerk, N., Gijzen, L., Annida, R., Bokkers, M., van Vught, R., Yoshinari, K., Katakawa, Y., Motonaga, K., et al. (2021) · Journal of Pharmaceutical Sciences · doi:10.1016/j.xphs.2021.11.016 · Cited by 24
Liver ductal organoids reconstruct intrahepatic biliary trees in decellularized liver grafts
Tomofuji, K., Fukumitsu, K., Kondo, J., Horie, H., Makino, K., Wakama, S., Ito, T., Oshima, Y., Ogiso, S., Ishii, T., et al. (2022) · Biomaterials · doi:10.1016/j.biomaterials.2022.121614 · Cited by 24
Progress in the Application of Organoids-On-A-Chip in Diseases
Geng, Q., Xu, Y., Hu, Y., Wang, L., Wang, Y., Fan, Z., & Kong, D. (2024) · Organogenesis · doi:10.1080/15476278.2024.2386727 · Cited by 19
Self-citationA high throughput in vitro mrp2 assay to predict in vivo biliary excretion
Colombo, F., Armstrong, C., Duan, J., & Rioux, N. (2012) · Xenobiotica · doi:10.3109/00498254.2011.614021 · Cited by 16
Kong, D., Mourtzinos, A., Heegsma, J., Blokzijl, H., de Meijer, V. E., & Faber, K. N. (2023) · Stem Cell Research & Therapy · doi:10.1186/s13287-023-03493-3 · Cited by 15
Self-citationFast formation and maturation enhancement of human liver organoids using a liver-organoid-on-a-chip
Byeon, J. H., Jung, D. J., Han, H.-J., Son, W.-C., & Jeong, G. S. (2024) · Frontiers in Cell and Developmental Biology · doi:10.3389/fcell.2024.1452485 · Cited by 15 · cited 1×
“…technologies have been developed to recapitulate liver pathophysiology, ranging from simple 2D monolayers under flow to complex 3D co-culture systems using specialized microfluidic hous-ings, each of which may have advantages or limitations in answering specific research questions [35, 37–39].”
Yang, K., & Brouwer, K. L. R. (2014) · Drug Metabolism and Disposition · doi:10.1124/dmd.114.057190 · Cited by 10
Engineering liver organoids-on-a-chip
Zhu, J., Dressman, A. S., Gall, K., & Park, S. E. (2026) · Frontiers in Lab on a Chip Technologies · doi:10.3389/frlct.2025.1719128 · Cited by 9
Multi-organ model assessment of neurotoxicity following exposure of liver spheroids to drugs
Wu, W., Anas, F., Koc, B., Tian, L., Hasselkus, R., Rezania, D., Sharareh, S., Farberov, L., Zlotnik, D., Alon, A., et al. (2025) · Biomedicine & Pharmacotherapy · doi:10.1016/j.biopha.2025.118021 · Cited by 5 · cited 1×
“To investigate the applicability of HepLoC for modeling drug-induced cholestasis, we exposed HepLoC cultures to Troglitazone (TGZ), a known cholestatic liver injury agent that inhibits MRP2 and BSEP activity [28, 29].”
Cited by
Xian, C., Wu, Y., Xie, B., & Xie, H. (2026) · Frontiers in Bioengineering and Biotechnology · doi:10.3389/fbioe.2026.1957038
Liver fibrosis: Pathogenesis and innovative nanoparticle-based therapeutic strategies
Cai, Y., Li, J., Chen, S., Zhang, H., Tan, J., Li, H., Zhang, S., Li, B., Wei, Q., Lin, C., et al. (2026) · International Journal of Pharmaceutics X · doi:10.1016/j.ijpx.2026.100596
Cheng, T., Qian, N., Xi, H., Hao, W., Yang, Y., & Yang, W. (2026) · Frontiers in Immunology · doi:10.3389/fimmu.2026.1930939
Advances in organoids for drug development: From discovery to delivery
Liang, J., Yao, H., Feng, Y., Shu, X., Zheng, Y., Gao, X., & Zhou, W. (2026) · Journal of Drug Delivery Science and Technology · doi:10.1016/j.jddst.2026.108876
Metadata
- Authors
- Kong, D., Yu, S., Heegsma, J., Blokzijl, T., Qin, T., Pan, Y., Blokzijl, H., de Meijer, V. E., Duan, Y., Faber, K. N., Xia, Q., & He, K.
- Affiliations
- University Medical Center Groningen (NL)
- Shanghai Jiao Tong University (CN)
- Corresponding author
- Kong, Defu
- Faber, Klaas Nico
- Xia, Qiang
- He, Kang
- ORCID
- Venue
- Journal of nanobiotechnology
- Published
- 2026-05-02
- Volume
- 24
- Issue
- 1
- ISSN
- 1477-3155 (ISSN-L)
- PMC
- PMC13285093
- OpenAlex
- W7160001015
- Cited by
- 4
- References
- 44
- Citations by year
- 2026: 4
- FWCI
- 5.98
- Type
- journal article
- Language
- en
- Open access
- gold
- doi.org
- Licence
- cc-by-nc-nd
- creativecommons.org/licenses/by-nc-nd/4.0 (tdm)
- creativecommons.org/licenses/by-nc-nd/4.0 (vor, 51 d)
- Locations
- Journal of Nanobiotechnology (publishedVersion, cc-by-nc-nd)
- PubMed (publishedVersion)
- University of Groningen research database (University of Groningen / Centre for Information Technology) (submittedVersion, cc-by-nc-nd)
- DOAJ (DOAJ: Directory of Open Access Journals) (submittedVersion)
- Funders
- Shanghai Natural Science Foundation (23ZR1438600)
- Shanghai Research Center for Organ Transplantation, Category A Key Research Center of Shanghai Municipality (2022ZZ01016)
- Dynamic Evolution and Regulatory Mechanisms of Host Immune Response Before and After Liver Transplantation
- Special Program of the National Natural Science Foundation of China (82241221)
- Topics
- Physical Sciences › Engineering › Biomedical Engineering › 3D Printing in Biomedical Research
- Life Sciences › Pharmacology, Toxicology and Pharmaceutics › Pharmacology › Drug-Induced Hepatotoxicity and Protection
- Health Sciences › Medicine › Surgery › Tissue Engineering and Regenerative Medicine
- Keywords
- liver-on-a-chip, organoids, hepatocyte differentiation, drug-induced liver injury, cholestatic liver injury, non-alcoholic fatty liver disease, free fatty acids, lipid droplets, hepatotoxicity screening, nanotherapeutics, MRP2, tight junction disruption, bile canaliculi, high-throughput screening
- MeSH terms
- Troglitazone, Multidrug Resistance-Associated Protein 2, Microphysiological Systems, Cell Differentiation, Drug Evaluation, Preclinical, Humans, Liver, Liver Diseases, Organoids, Hepatocytes, Microfluidics, Nanomedicine, Chemical and Drug Induced Liver Injury, High-Throughput Screening Assays
About these checks
Registry, retraction, Cites and statistics results are computed, not judged, with one exception: a printed reference that no index lists is read once by a model before it counts as a citation error. Claims are extracted by a model and kept only when their quote appears verbatim in the text; each cited source is then checked, with a model’s help, for whether it says what the claim relies on. Those verdicts can be wrong — read the claim’s quote and the cited source before relying on one.
The claim verdicts this report counts are experimental: their accuracy is not yet measured.
A language model drew the claims from the paper on 2026-10-10, under version 3 of the claim definition (model deepseek-v4.1-flash, prompt extract-v3).
A second model labelled each claim on 2026-10-10 (model jev-1.13-20260917, definition revision gold-guideline-v0.2).
Cited sources are checked with a language model’s help (gpt-6-sol).
Statistics and arithmetic are recomputed, not judged.
Confidence bands are shown only for fields calibrated on our annotated test set. None is calibrated yet, so no band is shown.
What counts as a claim ›How we measure confidence ›How we check this ›
Are you an author, or do you see a problem with this page? Request a review
Data sources
Bibliographic data: Semantic Scholar, OpenAlex, Crossref.
Contains information from the Semantic Scholar Academic Graph Datasets, made available under the ODC Attribution License (ODC-BY 1.0).
Semantic Scholar’s data is described in: Kinney, R., et al. (2023). The Semantic Scholar Open Data Platform. arXiv:2301.10140.
