

The DOI matches its Crossref record; 59 of the 59 references it cites were found in a registry or an index.
The combination of sport and sport-specific diet is associated with characteristics of gut microbiota: an observational study
Open accessAbstract
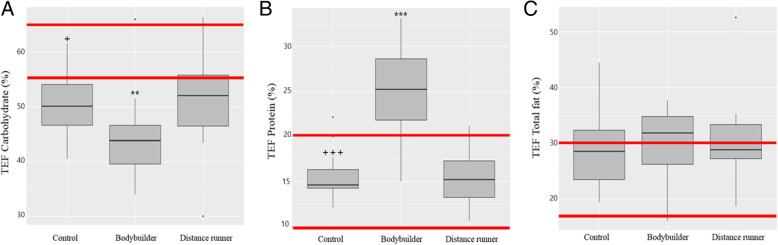
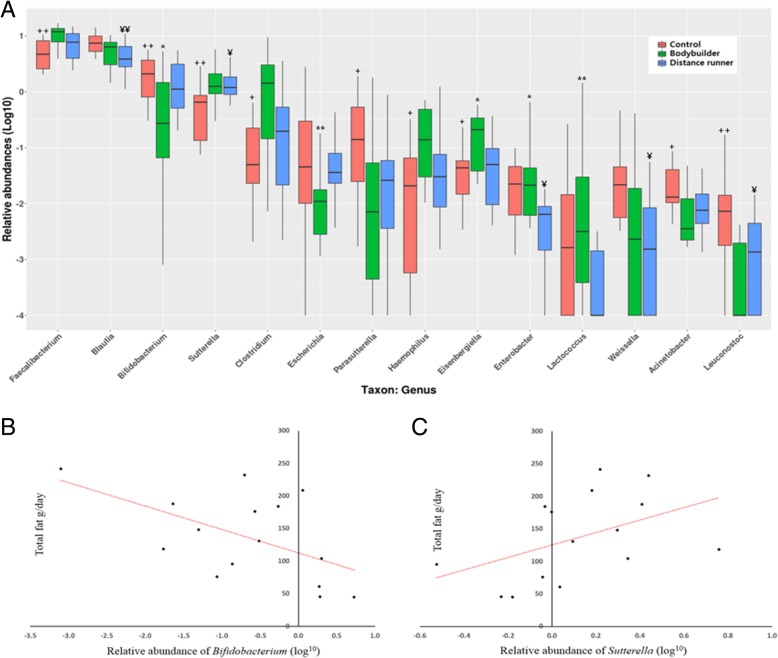
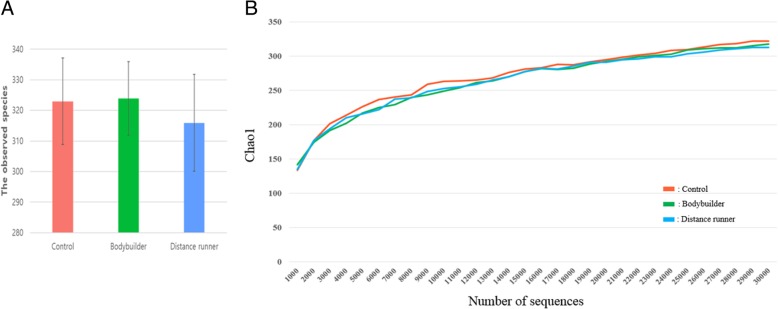
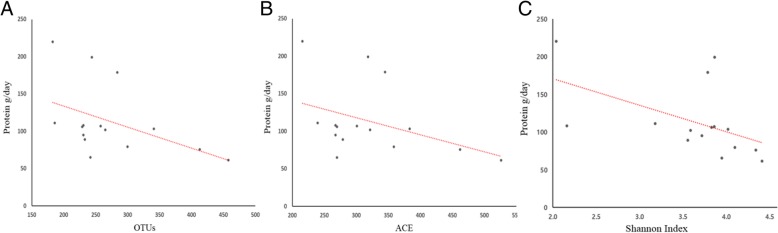
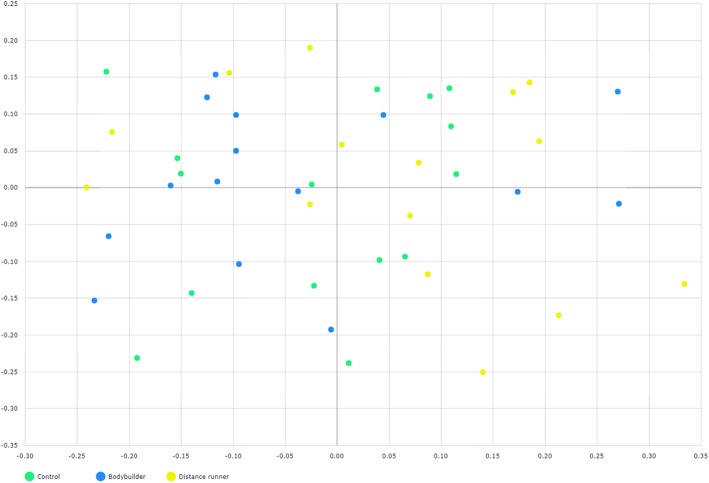
BACKGROUND: Recently, gut microbiota have been studied extensively for health promotion, disease prevention, disease treatment, and exercise performance. It is recommended that athletes avoid dietary fiber and resistant starch to promote gastric emptying and reduce gastrointestinal distress during exercise, but this diet may reduce microbial diversity and compromise the health of the athlete's gut microbiota. OBJECTIVE: This study compared fecal microbiota characteristics using high-throughput sequencing among healthy sedentary men (as controls), bodybuilders, and distance runners, as well as the relationships between microbiota characteristics, body composition, and nutritional status. METHODS: Body composition was measured using DXA, and physical activity level was assessed using IPAQ. Dietary intake was analyzed with the computerized nutritional evaluation program. The DNA of fecal samples was extracted and it was sequenced for the analysis of gut microbial diversity through bioinformatics cloud platform. RESULTS: We showed that exercise type was associated with athlete diet patterns (bodybuilders: high protein, high fat, low carbohydrate, and low dietary fiber diet; distance runners: low carbohydrate and low dietary fiber diet). However, athlete type did not differ in regard to gut microbiota alpha and beta diversity. Athlete type was significantly associated with the relative abundance of gut microbiota at the genus and species level: Faecalibacterium, Sutterella, Clostridium, Haemophilus, and Eisenbergiella were the highest (p < 0.05) in bodybuilders, while Bifidobacterium and Parasutterella were the lowest (p < 0.05). At the species level, intestinal beneficial bacteria widely used as probiotics (Bifidobacterium adolescentis group, Bifidobacterium longum group, Lactobacillus sakei group) and those producing short chain fatty acids (Blautia wexlerae, Eubacterium hallii) were the lowest in bodybuilders and the highest in controls. In addition, aerobic or resistance exercise training with an unbalanced intake of macronutrients and low intake of dietary fiber led to similar diversity of gut microbiota. Specifically, daily protein intake was negatively correlated with operation taxonomic unit (r = - 0.53, p < 0.05), ACE (r = - 0.51, p < 0.05), and Shannon index (r = - 0.64, p < 0.01) in distance runners.. CONCLUSION: Results suggest that high-protein diets may have a negative impact on gut microbiota diversity for athletes, while athletes in resistance sports that carry out the high protein low carbohydrates diet demonstrate a decrease in short chain fatty acid-producing commensal bacteria.
Overview
The claims and statistics of this paper haven’t been checked yet.
Run the check — free, no account needed. It reads the open-access text and checks the sources it cites.
Integrity signals
Registry
Cites
Statistics
Figures
Verification
Claims the paper makes
The claims and statistics of this paper haven’t been checked yet.
Run the check — free, no account needed. It reads the open-access text and checks the sources it cites.
Claims other papers make about this one
Each is checked against this paper’s own text: does it say what the citing paper says it does?
The cited source says what the claim attributes to it.
In the citing paper
“In distance runners, protein intake was negatively correlated with diversity (Shannon index R = − 0.63; P = 0.01) and in bodybuilders, fat intake was negatively correlated with Bifidobacteria (R = − 0.52; P = 0.05).”
From The athletic gut microbiota (2020) · cites this paper as [11]
In the citing paper
“For instance, at the genus level, Faecalibacterium, Sutterella, Clostridium, Haemophilus, and Eisenbergiella were the highest, while Bifidobacterium and Parasutterella were the lowest in bodybuilders.”
From The athletic gut microbiota (2020) · cites this paper as [11]
In the citing paper
“While athlete type did not differ regarding gut microbiota alpha and beta diversity, it was significantly associated with the relative abundance of several bacteria.”
From The athletic gut microbiota (2020) · cites this paper as [11]
In the citing paper
“Exercise type was associated with athlete diet patterns (i.e., bodybuilders: high-protein, high-fat, and low-carbohydrate/dietary fiber diet; distance runners: low-carbohydrate and low-dietary fiber diet).”
From The athletic gut microbiota (2020) · cites this paper as [11]
In the citing paper
“In distance runners, protein intake was negatively correlated with diversity (Shannon index R = − 0.63; P = 0.01) and in bodybuilders, fat intake was negatively correlated with Bifidobacteria (R = − 0.52; P = 0.05).”
From The athletic gut microbiota (2020) · cites this paper as [11]
In the citing paper
“the study by Clarke and colleagues [19] met all of the recommended dietary intake requirements, while the athletes in the investigation by Jang et al. [11] had insufficient carbohydrate and dietary fiber intake (compared to standard macronutrient distribution ranges).”
From The athletic gut microbiota (2020) · cites this paper as [11]
In the citing paper
“The inconsistency of these results compared to Clarke et al. [19] may relate to the nutritional status of the athletes.”
From The athletic gut microbiota (2020) · cites this paper as [11]
In the citing paper
“Jang et al. [11] reported that daily protein intake was negatively correlated with alpha diversity in distance runners.”
From The athletic gut microbiota (2020) · cites this paper as [11]
In the citing paper
“High microbial diversity could be easily affected by age, eating habits, and other factors [38].”
From Flavonoid-rich orange juice intake and altered gut microbiome in young adults with depressive symptom: a randomized controlled study (2020) · cites this paper as [38]
Self-check
Percentages, sums and reported differences re-computed from the paper’s own numbers.
The self-check needs the paper’s full text.
Citations
Cites
Basic local alignment search tool
Altschul, S. F., Gish, W., Miller, W., Myers, E. W., & Lipman, D. J. (1990) · Journal of Molecular Biology · doi:10.1006/jmbi.1990.9999 · Cited by 98,669
A Mathematical Theory of Communication
Shannon, C. E. (1948) · Bell System Technical Journal · doi:10.1002/j.1538-7305.1948.tb01338.x · Cited by 88,486
Trimmomatic: a flexible trimmer for Illumina sequence data
Bolger, A. M., Lohse, M., & Usadel, B. (2014) · Bioinformatics · doi:10.1093/bioinformatics/btu170 · Cited by 65,548
International physical activity questionnaire: 12-country reliability and validity
CRAIG, C. L., MARSHALL, A. L., SJ??STR??M, M., BAUMAN, A. E., BOOTH, M. L., AINSWORTH, B. E., PRATT, M., EKELUND, U., YNGVE, A., SALLIS, J. F., et al. (2003) · Medicine & Science in Sports & Exercise · doi:10.1249/01.mss.0000078924.61453.fb · Cited by 21,619
Search and clustering orders of magnitude faster than BLAST
Edgar, R. C. (2010) · Bioinformatics · doi:10.1093/bioinformatics/btq461 · Cited by 21,098
Schloss, P. D., Westcott, S. L., Ryabin, T., Hall, J. R., Hartmann, M., Hollister, E. B., Lesniewski, R. A., Oakley, B. B., Parks, D. H., Robinson, C. J., et al. (2009) · Applied and Environmental Microbiology · doi:10.1128/aem.01541-09 · Cited by 19,549
UCHIME improves sensitivity and speed of chimera detection
Edgar, R. C., Haas, B. J., Clemente, J. C., Quince, C., & Knight, R. (2011) · Bioinformatics · doi:10.1093/bioinformatics/btr381 · Cited by 15,114
Cd-hit: Accelerated for clustering the next-generation sequencing data
Fu, L., Niu, B., Zhu, Z., Wu, S., & Li, W. (2012) · Bioinformatics · doi:10.1093/bioinformatics/bts565 · Cited by 11,175
Diet rapidly and reproducibly alters the human gut microbiome
David, L. A., Maurice, C. F., Carmody, R. N., Gootenberg, D. B., Button, J. E., Wolfe, B. E., Ling, A. V., Devlin, A. S., Varma, Y., Fischbach, M. A., et al. (2014) · Nature · doi:10.1038/nature12820 · Cited by 10,100
Linking long-term dietary patterns with gut microbial enterotypes
Wu, G. D., Chen, J., Hoffmann, C., Bittinger, K., Chen, Y.-Y., Keilbaugh, S. A., Bewtra, M., Knights, D., Walters, W. A., Knight, R., et al. (2011) · Science · doi:10.1126/science.1208344 · Cited by 6,513
Research works printed but not linked: 3
- Barton W, 2018, Gut., 67, 625
- Hughes R, 2000, Curr Issues Intestinal Microbiol, 1, 51
- Altschul SF, 1990, J Mol Biol, 215, 403, 10.1016/S0022-2836(05)80360-2 · DOI · Paper page
Cited by
Sorted by citations
Items 201–225 of 225
High protein diet and health: The role of protein snacks
Qi, X., & Tester, R. F. (2025) · Food Nutrition Chemistry · doi:10.18686/fnc355
Clostridioides difficile: A suspected pro-carcinogenic bacterium for gastrointestinal tumors
Zou, J., Tian, B., Xiao, Y., Wu, A., & Li, C. (2025) · Chinese Medical Journal · doi:10.1097/cm9.0000000000003834
Relationship between gastrointestinal environment and physical conditions in elite athletes
Akazawa, N., Nakamura, M., Eda, N., Murakami, H., Nakagata, T., Nanri, H., Park, J., Hosomi, K., Mizuguchi, K., Kunisawa, J., et al. (2025) · The Journal of Physical Fitness and Sports Medicine · doi:10.7600/jpfsm.2024.040
Aya, V., Jiménez, P., Muñoz, E., & Ramírez, J. D. (2024) · Figshare · doi:10.6084/m9.figshare.26596778
Zhu, D., Delgado-Baquerizo, M., Ding, J., Gillings, M. R., & Zhu, Y.-G. (2021) · Figshare · doi:10.6084/m9.figshare.16650182
Zhu, D., Delgado-Baquerizo, M., Ding, J., Gillings, M. R., & Zhu, Y.-G. (2021) · Figshare · doi:10.6084/m9.figshare.16650188
Aya, V., Jiménez, P., Muñoz, E., & Ramírez, J. D. (2024) · Figshare · doi:10.6084/m9.figshare.26596781
Zhu, D., Delgado-Baquerizo, M., Ding, J., Gillings, M. R., & Zhu, Y.-G. (2021) · Figshare · doi:10.6084/m9.figshare.16650170
THE INFLUENCE OF GUT MICROBIOTA ON PERFORMANCE IN ATHLETES
Barszcz, G., Bębenek, N., Błądek, M., Drygała, K., Wit, S., Frączkiewicz, P., Harpula, I., Ramotowski, R., Bogdan, J., Baljon, B., et al. (2025) · International Journal of Innovative Technologies in Social Science · doi:10.31435/ijitss.4(48).2025.4463
Chen, J., Fan, Z., Li, Y., Duan, R., & Gao, B. (2026) · iScience · doi:10.1016/j.isci.2026.115490
Dietary Fiber in Sport: Implications for Performance and Body Composition Optimization
Özduran, E., & Karadağ, M. G. (2026) · International Journal of Sport Nutrition and Exercise Metabolism · doi:10.1123/ijsnem.2025-0170
Gao, R., Wang, J., Song, J., Zhang, W., & Quan, L. (2026) · Frontiers in Microbiology · doi:10.3389/fmicb.2026.1790697
Wang, X., zhou, G., 施庆珊, Wen, X., Liu, J., Li, C., Yuan, Y., & Xie, X. (2026) · Gene Reports · doi:10.1016/j.genrep.2026.102525
Ni, M., Wang, Q., Ye, T., Lei, H., Wang, Y., & Yuan, Y. (2026) · Journal of Ovarian Research · doi:10.1186/s13048-026-02164-0
Mental health and gut-brain crosstalk: implications for depression and Alzheimer's disease
Skourti, K., Katsaitis, F., Pavlidi, P., Anesti, M., Balla, J., Emvalomatis, A., Kokras, N., Dalla, C., & Sotiropoulos, I. (2026) · Neuroscience Applied · doi:10.1016/j.nsa.2026.107023
Кривко, В., Patrakhanov, E. A., & Aianka, R. (2026) · doi:10.24108/preprints-3116077
Pięta, A., Zielińska, K., Humińska‐Lisowska, K., & Frączek, B. (2026) · Frontiers in Microbiology · doi:10.3389/fmicb.2026.1891870
Fuhai, F. A. N. G., Hou, T., Chen, Y., Hu, M., Gu, B., Li, Z., Wang, Z., & Mao, Y.-H. (2026) · Nutrients · doi:10.3390/nu18172832
The Importance of Microbiota in Sports Nutrition
Ulus, C. A., & Keskin, D. Ö. Y. (2026) · Herkes için Spor ve Rekreasyon Dergisi · doi:10.56639/jsar.1994973
Gut Microbiota in Athletes: Implications for Physical Performance and Recovery
Reczek, K., Zalewska, A., Hariasz, W., Drobik, M., Gądek, K., Borowiec, M., Gontkowska, A., & Lichodij, A. (2026) · Państwo i Społeczeństwo · doi:10.31749/2451-0858-sas-2026-110
Bao, Z., Jiao, M., Zhao, M., Huang, F.-Y., Liu, Y. H., & Wang, S. (2026) · Nutrition Reviews · doi:10.1093/nutrit/nuag156
Zhang, G., Ju, J., Zhang, R., Xu, X., Li, L., Zhao, J., & Ju, H. (2026) · Biomedicines · doi:10.3390/biomedicines14102371
Montano, A., Paolini, A., Felli, C., Bruno, S. P., Baldassarre, A., Sandal, S., & Masotti, A. (2026) · Frontiers in Sports and Active Living · doi:10.3389/fspor.2026.1940762
Bueno, C., Pinheiro, D. F., Escobar, S. J. D. M., & Vieira, D. G. (2026) · Team Sports Studies · doi:10.1016/j.tss.2026.100030
Metadata
- Authors
- Jang, L.-G., Choi, G., Kim, S.-W., Kim, B.-Y., Lee, S., & Park, H.
- Affiliations
- Kyung Hee University (KR)
- ChunLab, Inc. Seocho-gu Seoul Republic of Korea
- Ildong (South Korea) (KR)
- Corresponding author
- Park, Hyon
- Venue
- Journal of the International Society of Sports Nutrition
- Publisher
- Informa UK Limited
- Published
- 2019-01-15
- Volume
- 16
- Issue
- 1
- Pages
- 21-21
- ISSN
- 1550-2783 (ISSN-L)
- PMC
- PMC6500072
- OpenAlex
- W2947024351
- Cited by
- 224
- References
- 59
- Citations by year
- 2026: 19 · 2025: 26 · 2024: 47 · 2023: 32 · 2022: 44 · 2021: 38 · 2020: 14 · 2019: 3
- FWCI
- 8.27
- Type
- journal article
- Language
- en
- Open access
- gold
- doi.org
- Licence
- Locations
- Journal of the International Society of Sports Nutrition (publishedVersion, cc-by)
- PubMed Central (publishedVersion, cc-by)
- PubMed (publishedVersion)
- DOAJ (DOAJ: Directory of Open Access Journals) (submittedVersion, cc-by-sa)
- Funders
- National Research Foundation of Kore (NRF-2016S1A5A2A01023587)
- Topics
- Life Sciences › Biochemistry, Genetics and Molecular Biology › Molecular Biology › Gut microbiota and health
- Life Sciences › Agricultural and Biological Sciences › Food Science › Probiotics and Fermented Foods
- Health Sciences › Medicine › Gastroenterology › Gastrointestinal motility and disorders
- Keywords
- gut microbiota, sports nutrition, bodybuilders, long-distance runners, high-protein diet, dietary fiber, gut microbiota diversity, short-chain fatty acids, Bifidobacterium, Faecalibacterium, Clostridium, exercise type, body composition, macronutrient intake, probiotics, sedentary men, Shannon diversity index, physical activity level, nutritional status
- MeSH terms
- Gastrointestinal Microbiome, Adult, Bacteria, Body Composition, Diet, Dietary Fiber, Dietary Proteins, Fatty Acids, Volatile, Humans, Male, Sports, Case-Control Studies, Young Adult, Sports Nutritional Physiological Phenomena
About these checks
Registry, retraction, Cites and statistics results are computed, not judged, with one exception: a printed reference that no index lists is read once by a model before it counts as a citation error. Claims are extracted by a model and kept only when their quote appears verbatim in the text; each cited source is then checked, with a model’s help, for whether it says what the claim relies on. Those verdicts can be wrong — read the claim’s quote and the cited source before relying on one.
Statistics and arithmetic are recomputed, not judged.
Confidence bands are shown only for fields calibrated on our annotated test set. None is calibrated yet, so no band is shown.
What counts as a claim ›How we measure confidence ›How we check this ›
Are you an author, or do you see a problem with this page? Request a review
