

The DOI matches its Crossref record; 57 of the 58 references it cites were found in a registry or an index.
Time-dependent effects of CX3CR1 in a mouse model of mild traumatic brain injury
Open accessAbstract
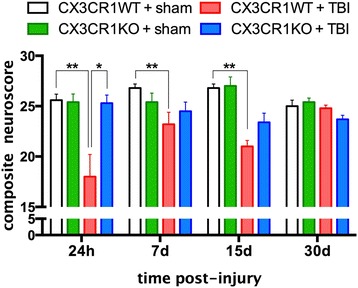
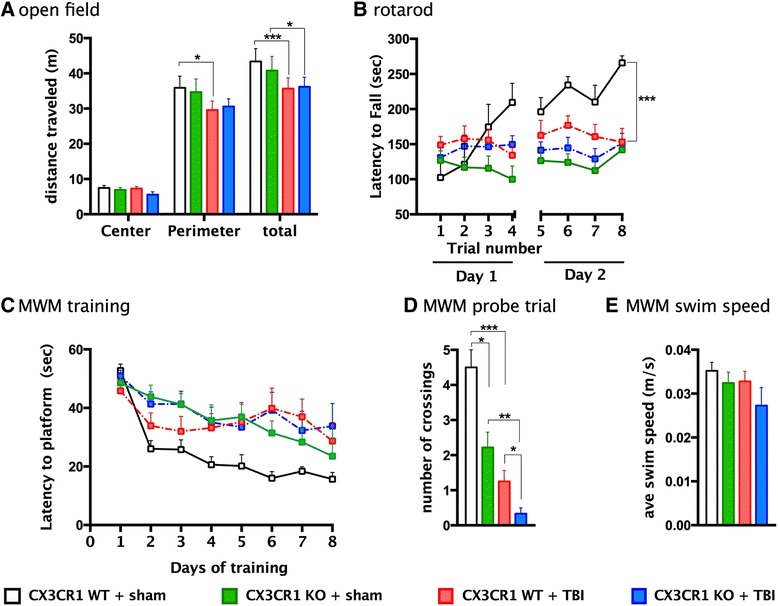
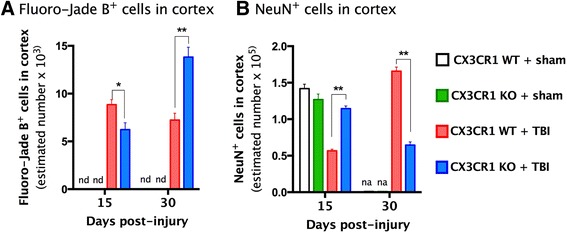
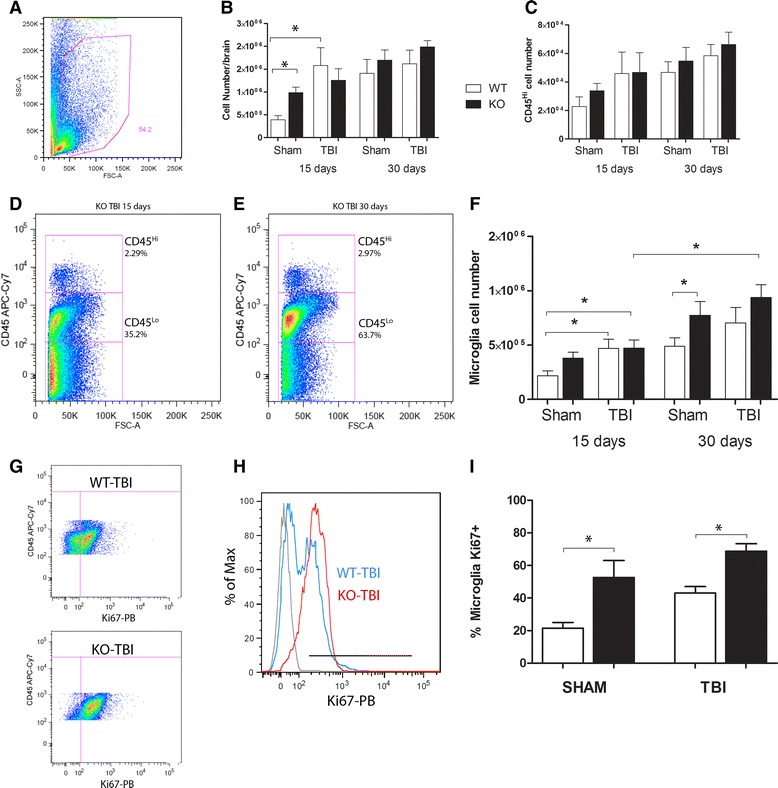
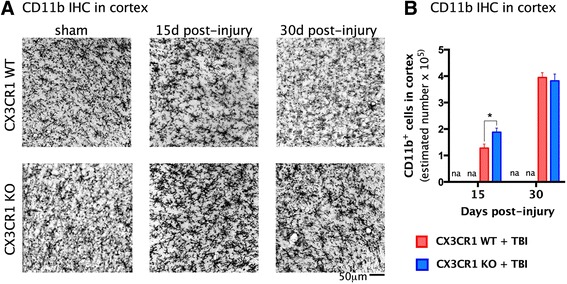
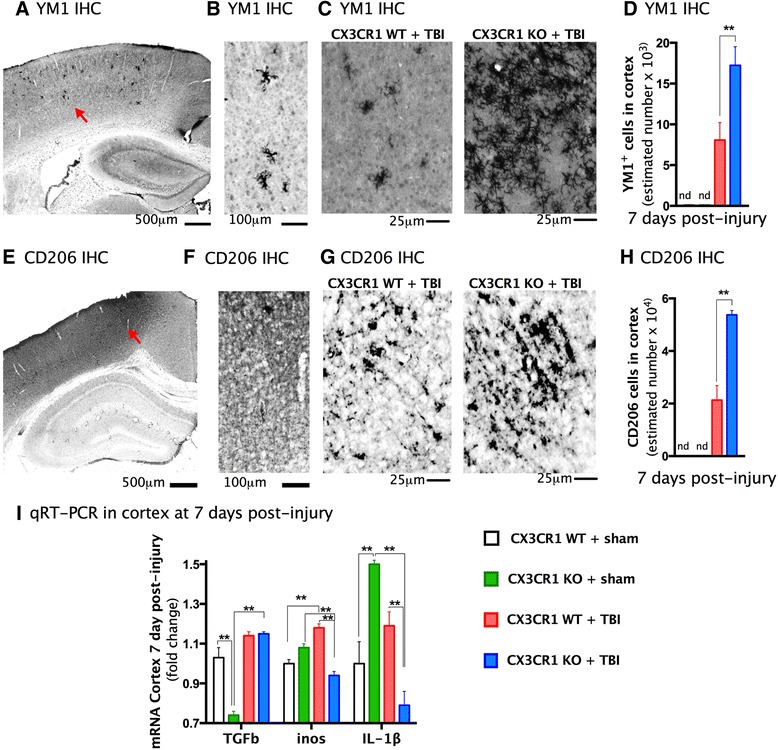
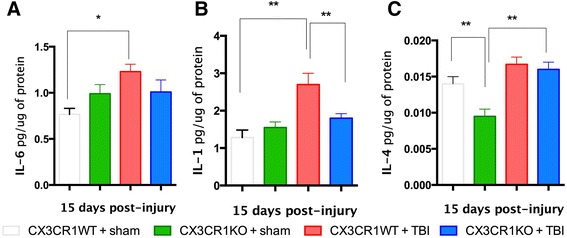
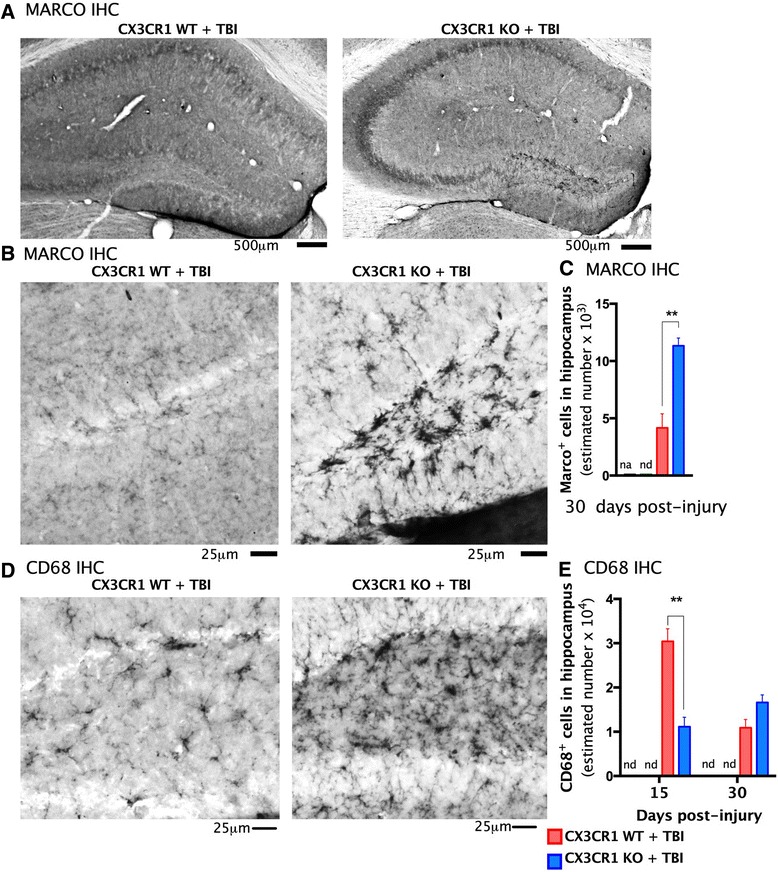
BACKGROUND: Neuroinflammation is an important secondary mechanism that is a key mediator of the long-term consequences of neuronal injury that occur in traumatic brain injury (TBI). Microglia are highly plastic cells with dual roles in neuronal injury and recovery. Recent studies suggest that the chemokine fractalkine (CX3CL1, FKN) mediates neural/microglial interactions via its sole receptor CX3CR1. CX3CL1/CX3CR1 signaling modulates microglia activation, and depending upon the type and time of injury, either protects or exacerbates neurological diseases. METHODS: In this study, mice deficient in CX3CR1 were subjected to mild controlled cortical impact injury (CCI), a model of TBI. We evaluated the effects of genetic deletion of CX3CR1 on histopathology, cell death/survival, microglia activation, and cognitive function for 30 days post-injury. RESULTS: During the acute post-injury period (24 h-15 days), motor deficits, cell death, and neuronal cell loss were more profound in injured wild-type than in CX3CR1(-/-) mice. In contrast, during the chronic period of 30 days post-TBI, injured CX3CR1(-/-) mice exhibited greater cognitive dysfunction and increased neuronal death than wild-type mice. The protective and deleterious effects of CX3CR1 were associated with changes in microglia phenotypes; during the acute phase CX3CR1(-/-) mice showed a predominant anti-inflammatory M2 microglial response, with increased expression of Ym1, CD206, and TGFβ. In contrast, increased M1 phenotypic microglia markers, Marco, and CD68 were predominant at 30 days post-TBI. CONCLUSION: Collectively, these novel data demonstrate a time-dependent role for CX3CL1/CX3CR1 signaling after TBI and suggest that the acute and chronic responses to mild TBI are modulated in part by distinct microglia phenotypes.
Overview
The claims and statistics of this paper haven’t been checked yet.
Run the check — free, no account needed. It reads the open-access text and checks the sources it cites.
Integrity signals
Registry
Cites
Statistics
Figures
Verification
Claims the paper makes
The claims and statistics of this paper haven’t been checked yet.
Run the check — free, no account needed. It reads the open-access text and checks the sources it cites.
Claims other papers make about this one
Each is checked against this paper’s own text: does it say what the citing paper says it does?
The source backs part of the claim, not all of it — or backs it for a different population, condition or comparison.
In the citing paper
“After a single CCI TBI, Cx3cr1−/− mice have improved motor recovery and decreased neuronal loss through 15 days post-injury (DPI).”
From The Inflammatory Continuum of Traumatic Brain Injury and Alzheimer’s Disease (2018) · cites this paper as [80]
Experimental — accuracy not yet measuredThe cited source says what the claim attributes to it.
In the citing paper
“By 30 DPI, however, these Cx3cr1−/− mice have worse cognitive dysfunction and neuronal loss compared to wild-type controls.”
From The Inflammatory Continuum of Traumatic Brain Injury and Alzheimer’s Disease (2018) · cites this paper as [80]
The cited source says what the claim attributes to it.
In the citing paper
“These changes are directly associated with an altered and time-dependent inflammatory profile in microglia (80).”
From The Inflammatory Continuum of Traumatic Brain Injury and Alzheimer’s Disease (2018) · cites this paper as [80]
Self-check
Percentages, sums and reported differences re-computed from the paper’s own numbers.
The self-check needs the paper’s full text.
Citations
Cites
The chemokine system in diverse forms of macrophage activation and polarization
MANTOVANI, A., SICA, A., SOZZANI, S., ALLAVENA, P., VECCHI, A., & LOCATI, M. (2004) · Trends in Immunology · doi:10.1016/j.it.2004.09.015 · Cited by 6,534 · cited 1×
“M1 microglia are generally considered pro-inflammatory whereas, M2 microglia are generally anti-inflammatory [29 – 34].”
Alternative activation of macrophages
Gordon, S. (2003) · Nature Reviews Immunology · doi:10.1038/nri978 · Cited by 6,189 · cited 1×
“M1 microglia are generally considered pro-inflammatory whereas, M2 microglia are generally anti-inflammatory [29–34].”
Blood Monocytes Consist of Two Principal Subsets with Distinct Migratory Properties
Geissmann, F., Jung, S., & Littman, D. R. (2003) · Immunity · doi:10.1016/s1074-7613(03)00174-2 · Cited by 3,504 · cited 1×
“Conversely, monocytes of the subset Ly6C low /CX3CR1 high are CCR2 deficient and are dependent on CX3CR1 for recruitment [51 – 53].”
West, M. J., Slomianka, L., & Gundersen, H. J. G. (1991) · The Anatomical Record · doi:10.1002/ar.1092310411 · Cited by 2,994 · cited 1×
“All cell counts were obtained using the Optical Fractionator method of unbiased stereological counting techniques [39].”
Jung, S., Aliberti, J., Graemmel, P., Sunshine, M. J., Kreutzberg, G. W., Sher, A., & Littman, D. R. (2000) · Molecular and Cellular Biology · doi:10.1128/mcb.20.11.4106-4114.2000 · Cited by 2,632 · cited 1×
“Indeed, deleting CX3CR1 [4] exacerbates microglial neurotoxicity induced by systemic inflammation in rodent models of Parkinson’s disease and amyotrophic lateral sclerosis [5].”
Nahrendorf, M., Swirski, F. K., Aikawa, E., Stangenberg, L., Wurdinger, T., Figueiredo, J.-L., Libby, P., Weissleder, R., & Pittet, M. J. (2007) · The Journal of Experimental Medicine · doi:10.1084/jem.20070885 · Cited by 2,300 · cited 2×
“For example, in a model of myocardial infarction, tissue repair requires recruitment of Ly6C and then Ly6C monocytes [53].”
Kigerl, K. A., Gensel, J. C., Ankeny, D. P., Alexander, J. K., Donnelly, D. J., & Popovich, P. G. (2009) · The Journal of Neuroscience · doi:10.1523/jneurosci.3257-09.2009 · Cited by 2,130 · cited 2×
“Ly6C monocytes are proteolitic, degrade injured tissue, and give rise to M1 macrophages in vivo [35, 56].”
Arnold, L., Henry, A., Poron, F., Baba-Amer, Y., van Rooijen, N., Plonquet, A., Gherardi, R. K., & Chazaud, B. (2007) · The Journal of Experimental Medicine · doi:10.1084/jem.20070075 · Cited by 2,002 · cited 1×
“CX3CR1 monocytes may differentiate from Ly6C monocytes in tissue and thus may not require CX3CR1 for recruitment [54, 55].”
Microglia Shape Adult Hippocampal Neurogenesis through Apoptosis-Coupled Phagocytosis
Sierra, A., Encinas, J. M., Deudero, J. J. P., Chancey, J. H., Enikolopov, G., Overstreet-Wadiche, L. S., Tsirka, S. E., & Maletic-Savatic, M. (2010) · Cell Stem Cell · doi:10.1016/j.stem.2010.08.014 · Cited by 1,622 · cited 10×
“Antibodies and dilutions were as follows: rat CD11b (Serotec, Raleigh, NC, USA; 1:500); mouse CD68 (Serotec; 1:200); rabbit YM1 (Stem cell technology, Vancouver, BC, Canada; 1:400); rat Marco (Serotec; 1:500); mouse NeuN (Millipore, Temecula, CA, USA; 1:1000).”
InfluentialControl of microglial neurotoxicity by the fractalkine receptor
Cardona, A. E., Pioro, E. P., Sasse, M. E., Kostenko, V., Cardona, S. M., Dijkstra, I. M., Huang, D., Kidd, G., Dombrowski, S., Dutta, R., et al. (2006) · Nature Neuroscience · doi:10.1038/nn1715 · Cited by 1,531 · cited 2×
“Indeed, deleting CX3CR1 [4] exacerbates microglial neurotoxicity induced by systemic inflammation in rodent models of Parkinson’s disease and amyotrophic lateral sclerosis [5].”
Self-citation
Research works printed but not linked: 2
- Frank-Cannon TC, Alto LT, McAlpine FE, Tansey MG. Does neuroinflammation fan the flame in neurodegenerative diseases? Mol Neurodegener. 2009;4:47. · DOI · Paper page
- Gaetani P, Pisano P, Solinas G, Colombo P, Destro A, Levi D, et al. Immunohistohemical expression of the chemokine fractalkine and its receptor in the human brain cortex after severe traumatic brain injury and brain hemorrhage. J Neurosurg Sci. 2013;57(1):55–62.
Cited by
Sorted by citations
Microglia in Pain: Detrimental and Protective Roles in Pathogenesis and Resolution of Pain
Chen, G., Zhang, Y., Qadri, Y. J., Serhan, C. N., & Ji, R. (2018) · Neuron · doi:10.1016/j.neuron.2018.11.009 · Cited by 801
Bidirectional Microglia–Neuron Communication in Health and Disease
Szepesi, Z., Manouchehrian, O., Bachiller, S., & Deierborg, T. (2018) · Frontiers in Cellular Neuroscience · doi:10.3389/fncel.2018.00323 · Cited by 459
“The activity of macrophages appears to be a potential therapeutic target in different TBI settings in adult, but not young, rodents (Febinger et al., 2015; Erturk et al., 2016; Hanlon et al., 2016; Zanier et al., 2016; Chhor et al., 2017; Saber et al., 2017).”
BackgroundResultInfluentialMicroglial Activation in Traumatic Brain Injury
Donat, C. K., Scott, G., Gentleman, S., & Sastre, M. (2017) · Frontiers in Aging Neuroscience · doi:10.3389/fnagi.2017.00208 · Cited by 512
“…2014 Mouse C57Bl/6 ♂ CCI, moderate 3 mm dpi: 3, 7 M1: CD11b, TNF-α, CD68, CD86, IL-1β M2a/c: Ym1, Arg-1, CD206, SOCS3, IL-10 Mixed expression of M1 and M2 marker mRNA M1: N at 3 + 7 dpi M2: N Ym1, Arg-1, SOCS3 at 3 dpi Febinger et al., 2015 Mouse CX3CR1−/− CX3CR1+/+ ♂ CCI, mild 3 mm dpi: 7, 15,…”
Commonalities in epileptogenic processes from different acute brain insults: Do they translate?
Klein, P., Dingledine, R. J., Aronica, E., Bernard, C., Blümcke, I., Boison, D., Brodie, M. J., Brooks‐Kayal, A. R., Engel, J., Forcelli, P. A., et al. (2017) · Epilepsia · doi:10.1111/epi.13965 · Cited by 300
Shaping Neuronal Fate: Functional Heterogeneity of Direct Microglia-Neuron Interactions
Cserép, C., Pósfai, B., & Dénes, Á. (2021) · Neuron · doi:10.1016/j.neuron.2020.11.007 · Cited by 256
“, 2016), whereas time-dependent effects were found concerning cognitive dysfunction after mild brain trauma (Febinger et al., 2015).”
Xiong, Y., Mahmood, A., & Chopp, M. (2018) · Chinese Journal of Traumatology · doi:10.1016/j.cjtee.2018.02.003 · Cited by 253
Abels, E. R., Maas, S. L. N., Nieland, L., Wei, Z., Cheah, P. S., Tai, E., Kolsteeg, C.-J., Dusoswa, S. A., Ting, D. T., Hickman, S., et al. (2019) · Cell Reports · doi:10.1016/j.celrep.2019.08.036 · Cited by 199
“Increased levels of proliferation in microglia have been reported in neuro-inflammation and traumatic brain injury, indicating that disruption of CNS homeostasis as is also occurring during tumor growth can result in proliferation of microglia (Febinger et al., 2015; Pepe et al., 2017).”
BackgroundCX3CL1/CX3CR1 signaling targets for the treatment of neurodegenerative diseases
Subbarayan, M. S., Joly‐Amado, A., Bickford, P. C., & Nash, K. R. (2021) · Pharmacology & Therapeutics · doi:10.1016/j.pharmthera.2021.107989 · Cited by 204
Alzheimer’s Disease Pathogenesis: Role of Autophagy and Mitophagy Focusing in Microglia
Eshraghi, M., Adlimoghaddam, A., Mahmoodzadeh, A., Sharifzad, F., Yasavoli-Sharahi, H., Lorzadeh, S., Albensi, B. C., & Ghavami, S. (2021) · International Journal of Molecular Sciences · doi:10.3390/ijms22073330 · Cited by 158
“, TNF-α, IL-1β, IL-6), neurotoxicity, and microglial activity [278].”
Dysregulated phosphoinositide 3-kinase signaling in microglia: shaping chronic neuroinflammation
Chu, E., Mychasiuk, R., Hibbs, M. L., & Semple, B. D. (2021) · Journal of Neuroinflammation · doi:10.1186/s12974-021-02325-6 · Cited by 152
“Moreover, CX3CR1 deficiency has also been linked to elevated pro-inflammatory microglial markers and pronounced cognitive deficits after mild head trauma [148].”
BackgroundThe immunological response to traumatic brain injury
Needham, E., Helmy, A. E., Zanier, E. R., Jones, J., Coles, A. J., & Menon, D. K. (2019) · Journal of Neuroimmunology · doi:10.1016/j.jneuroim.2019.04.005 · Cited by 161
Microglia in Alzheimer's Disease: Risk Factors and Inflammation
Katsumoto, A., Takeuchi, H., Takahashi, K., & Tanaka, F. (2018) · Frontiers in Neurology · doi:10.3389/fneur.2018.00978 · Cited by 140
“On the other hand, blocking neural/microglial interaction via CX3CR1 deficiency conferred neurological protection at early time points after TBI, but caused appreciable impairments accompanied by persistent neuronal death at later times (31, 32).”
BackgroundThe Inflammatory Continuum of Traumatic Brain Injury and Alzheimer’s Disease
Kokiko-Cochran, O. N., & Godbout, J. P. (2018) · Frontiers in Immunology · doi:10.3389/fimmu.2018.00672 · Cited by 128
“These changes are directly associated with an altered and timedependent inflammatory profile in microglia (80).”
BackgroundNeuroinflammation and fractalkine signaling in Alzheimer’s disease
Finneran, D. J., & Nash, K. R. (2019) · Journal of Neuroinflammation · doi:10.1186/s12974-019-1412-9 · Cited by 132
“However, 30 days after injury Cx3cr1−/− mice have significantly greater memory impairment on the Morris water maze as well as significantly elevated pro-inflammatory markers compared to wild-type controls [66].”
BackgroundPoniatowski, Ł. A., Wojdasiewicz, P., Krawczyk, M., Szukiewicz, D., Gasik, R., Kubaszewski, Ł., & Kurkowska‐Jastrzębska, I. (2016) · Molecular Neurobiology · doi:10.1007/s12035-016-9787-4 · Cited by 107
Cx3cr1- deficient microglia exhibit a premature aging transcriptome
Gyoneva, S., Hosur, R., Gosselin, D., Zhang, B., Ouyang, Z., Cotleur, A. C., Peterson, M., Allaire, N., Challa, R., Cullen, P., et al. (2019) · Life Science Alliance · doi:10.26508/lsa.201900453 · Cited by 103
“Both protective and detrimental effects have also been reported for Cx3cr1 deletion in varied models of traumatic brain injury, including at different time points in the same model (Febinger et al, 2015; Erturk etal, 2016; Zanier etal, 2016).”
Chronic Pain After Traumatic Brain Injury: Pathophysiology and Pain Mechanisms
Irvine, K., & Clark, J. D. (2017) · Pain Medicine · doi:10.1093/pm/pnx153 · Cited by 126
“Furthermore, studies have also implicated pain-related chemokine signaling in TBI-induced neuroinflammation through the CX3CR1 and CCR2 receptors [88,118].”
BackgroundFractalkine/CX3CR1 is involved in the cross-talk between neuron and glia in neurological diseases
Luo, P., Chu, S., Zhang, Z., Xia, C., & Chen, N. (2018) · Brain Research Bulletin · doi:10.1016/j.brainresbull.2018.11.017 · Cited by 92
Puntambekar, S. S., Saber, M., Lamb, B. T., & Kokiko‐Cochran, O. N. (2018) · Brain Behavior and Immunity · doi:10.1016/j.bbi.2018.03.033 · Cited by 79
“Although injured CX3CR1 -/and WT controls showed similar absolute numbers of CD68 + cells in the hippocampus at chronic time-points, these inflammatory phagocytes displayed a hypertrophic morphology (29) with elevated CD11b expression, consistent”
InfluentialCX3CL1/CX3CR1 in Alzheimer’s Disease: A Target for Neuroprotection
Chen, P., Zhao, W., Guo, Y., Xu, J., & Yin, M. (2016) · BioMed Research International · doi:10.1155/2016/8090918 · Cited by 67
Bolton-Hall, A. N., Joseph, B., Brelsfoard, J., & Saatman, K. E. (2016) · PLoS ONE · doi:10.1371/journal.pone.0159442 · Cited by 72
Taylor, X., Cisternas, P., You, Y., You, Y., Xiang, S., Marambio, Y. G., Zhang, J., Vidal, R., & Lasagna‐Reeves, C. A. (2020) · Journal of Neuroinflammation · doi:10.1186/s12974-020-01900-7 · Cited by 93
Microglia Receptors in Animal Models of Traumatic Brain Injury
Younger, D., Murugan, M., Rao, K. V. R., Wu, L., & Chandra, N. (2018) · Molecular Neurobiology · doi:10.1007/s12035-018-1428-7 · Cited by 69
Traumatic Brain Injury: An Age-Dependent View of Post-Traumatic Neuroinflammation and Its Treatment
Delage, C., Taib, T., Mamma, C., Lerouet, D., & Besson, V. C. (2021) · Pharmaceutics · doi:10.3390/pharmaceutics13101624 · Cited by 72
“This phenomenon could explain why an undifferentiated total depletion of microglial phenotype does not always demonstrate protective effects [100,101].”
BackgroundRoche, S. L., Wyse‐Jackson, A. C., Gómez‐Vicente, V., Lax, P., Ruiz‐Lopez, A. M., Byrne, A. M., Cuenca, N., & Cotter, T. G. (2016) · PLoS ONE · doi:10.1371/journal.pone.0165197 · Cited by 55
Zhang, J., Liu, Y., Liu, X., Li, S., Cheng, C., Chen, S., & Le, W. (2018) · Translational Neurodegeneration · doi:10.1186/s40035-018-0138-4 · Cited by 57
Divolis, G., Stavropoulos, A., Manioudaki, M., Apostolidou, A. C., Doulou, A., Gavriil, A., Dafnis, I., Chroni, A., Mummery, C. L., Xilouri, M., et al. (2019) · Brain Communications · doi:10.1093/braincomms/fcz028 · Cited by 51
“Notably, the CX3CL1/ CX3CR1 axis has been associated with reduced neurotoxicity and microglial activation (Mizuno et al., 2003; Pabon et al., 2011; Febinger et al., 2015).”
BackgroundNeuroinflammation and Hypothalamo-Pituitary Dysfunction: Focus of Traumatic Brain Injury
Mele, C., Pingue, V., Caputo, M., Zavattaro, M., Pagano, L., Prodam, F., Nardone, A., Aimaretti, G., & Marzullo, P. (2021) · International Journal of Molecular Sciences · doi:10.3390/ijms22052686 · Cited by 60
“Studies on mice models of TBI have demonstrated microglial polarization [71,72] and the transient upregulation of the M2-like phenotype, which is subsequently replaced by a predominant M1- or mixed Mtransition (Mtran) phenotype, associated with increased cortical and hippocampal neurodegeneration [67].”
BackgroundEnam, S. F., Kader, S. R., Bodkin, N., Lyon, J. G., Calhoun, M. A., Azrak, C., Tiwari, P. M., Vanover, D. A., Wang, H., Santangelo, P. J., et al. (2020) · Journal of Neuroinflammation · doi:10.1186/s12974-020-01860-y · Cited by 55
Zhang, J., Zhang, Z. G., Lü, M., Zhang, Y., Shang, X., & Chopp, M. (2019) · Neurobiology of Disease · doi:10.1016/j.nbd.2019.01.019 · Cited by 59
Crosstalk between Microglia and Neurons in Neurotrauma: An Overview of the Underlying Mechanisms
Shaito, A. A., Kobeissy, F. H., Haidar, M. A., Ibeh, S., Shakkour, Z., Reslan, M. A., Nwaiwu, J. I., Moqidem, Y. A., Sader, G., Nickles, R. G., et al. (2021) · Current Neuropharmacology · doi:10.2174/1570159x19666211202123322 · Cited by 51
“For instance, the neuronally-derived soluble CX3CL1 maintains microglia in a neuroprotective state, and any disruptions in this signaling dysregulate the microglial phenotype, resulting in neuronal damage [162].”
Toutonji, A., Mandava, M., Guglietta, S., & Tomlinson, S. (2021) · Acta Neuropathologica Communications · doi:10.1186/s40478-021-01226-2 · Cited by 43
Mesenchymal stromal cell secretome for traumatic brain injury: Focus on immunomodulatory action
Pischiutta, F., Caruso, E., Cavaleiro, H., Salgado, A. J., Loane, D. J., & Zanier, E. R. (2022) · Experimental Neurology · doi:10.1016/j.expneurol.2022.114199 · Cited by 43
“The protective and deleterious effects of CX3CR1 were associated with changes in macrophage/microglia activation status (Febinger et al., 2015; Zanier et al., 2016).”
BackgroundMethodInfluentialDwyer, Z., Rudyk, C., Thompson, A., Farmer, K., Fenner, B. M., Fortin, T., Derksen, A., Sun, H., & Hayley, S. P. (2020) · Neurobiology of Aging · doi:10.1016/j.neurobiolaging.2020.02.017 · Cited by 46
Donison, N. S., Palik, J., Volkening, K., & Strong, M. J. (2025) · Molecular Neurodegeneration · doi:10.1186/s13024-025-00842-z · Cited by 42
“In the case of TBI, mice lacking CX3 CR1 had less neurodegeneration in the acute phase, but worse outcomes in the chronic neuroinflammatory phase [342].”
CX3CL1/CX3CR1 signal mediates M1-type microglia and accelerates high-altitude-induced forgetting
Wang, X., Xie, Y., Niu, Y., Wan, B., Lu, Y., Luo, Q., & Zhu, L. (2023) · Frontiers in Cellular Neuroscience · doi:10.3389/fncel.2023.1189348 · Cited by 32
CD200 modulates spinal cord injury neuroinflammation and outcome through CD200R1.
Lago, N., Pannunzio, B., Amo-Aparicio, J., López-Vales, R., & Peluffo, H. (2018) · Brain, behavior, and immunity · doi:10.1016/j.bbi.2018.06.002 · Cited by 38
Thomasy, H. E., Febinger, H. Y., Ringgold, K. M., Gemma, C., & Opp, M. R. (2017) · Neurobiology of Sleep and Circadian Rhythms · doi:10.1016/j.nbscr.2016.03.001 · Cited by 37
“After the 48-h baseline recordings, mice were randomized to sham surgeries (n1⁄47; control mice), or to controlled cortical impact (CCI; n1⁄416) to induce TBI as previously described (Febinger et al., 2015).”
BackgroundMethodInfluentialSelf-citationTweedie, D., Karnati, H. K., Mullins, R. J., Pick, C. G., Hoffer, B. J., Goetzl, E. J., Kapogiannis, D., & Greig, N. H. (2020) · eLife · doi:10.7554/elife.55827 · Cited by 42
Microglial CX3CR1 production increases in Alzheimer's disease and is regulated by noradrenaline
González‐Prieto, M., Gutiérrez, I. L., García‐Bueno, B., Caso, J. R., Leza, J. C., Ortega‐Hernández, A., Gómez‐Garré, D., & Madrigal, J. L. M. (2020) · Glia · doi:10.1002/glia.23885 · Cited by 42
“, 2006), stroke (Briones, Woods, & Wadowska, 2014), traumatic brain injury (Febinger et al., 2015), amyotrophic lateral sclerosis (Cardona et al.”
BackgroundSanchís, P., Fernández‐Gayol, O., Vizueta, J., Comes, G., Canal, C., Escrig, A., Molinero, A., Giralt, M., & Hidalgo, J. (2019) · Glia · doi:10.1002/glia.23758 · Cited by 54
“Interestingly, no significant differences on IL-6 protein levels were observed between sham-WT and sham-Cx3Cr1 KO mice nor between lesioned-WT and lesioned-Cx3cr1 KO mice (Febinger et al., 2015), which suggests that there is no feed-back loop between both genes.”
BackgroundHypocretin Mediates Sleep and Wake Disturbances in a Mouse Model of Traumatic Brain Injury
Thomasy, H. E., & Opp, M. R. (2019) · Journal of Neurotrauma · doi:10.1089/neu.2018.5810 · Cited by 35
“37,55 We previously demonstrated that 1mm depth CCI produces moderate TBI and significant changes in sleep–wake behavior, 37 and we used the same parameters in this study.”
Self-citationChaikittisilpa, N., Krishnamoorthy, V. K., Lele, A. V., Qiu, Q., & Vavilala, M. S. (2017) · Journal of Neuroscience Research · doi:10.1002/jnr.24100 · Cited by 39
“Preclinical studies have documented a neuroinflammatory response following TBI (Febinger et al., 2015).”
BackgroundKatsumoto, A., de Miranda, A. S., Butovsky, O., Teixeira, A. L., Ransohoff, R. M., & Lamb, B. T. (2018) · Journal of Neuroinflammation · doi:10.1186/s12974-018-1075-y · Cited by 39
“, early protection but late worsening [43, 44].”
CX3CL1 Pathway as a Molecular Target for Treatment Strategies in Alzheimer’s Disease
Bivona, G., Iemmolo, M., & Ghersi, G. (2023) · International Journal of Molecular Sciences · doi:10.3390/ijms24098230 · Cited by 35
“In 2015, Febinger et al., demonstrated that altering FKN signalling leads to a dysfunctional microglial response and subsequent neuronal damage [47].”
BackgroundNiu, X., Bai, L., Sun, Y., Wang, Y., Bai, G., Yin, B., Wang, S., Gan, S., Jia, X., & Liu, H. (2020) · The Journal of Headache and Pain · doi:10.1186/s10194-020-01201-7 · Cited by 36
Li, N., Lu, W., Tang, L., Zhu, L., Deng, W., Liu, H., Huang, C., Jin, J., Zeng, J., Chen, S., et al. (2025) · CNS Neuroscience & Therapeutics · doi:10.1111/cns.70568 · Cited by 32
“…representative pair of molecules, and a study has found that during the chronic period of 30 days post-TBI, mice deficient in CX3CR1 that are subjected to CCI exhibit more obvious cognitive impairment and more neuronal death, which may be related to the polarization of M1 phenotype microglia [50].”
Neuro-Inflammation in Pediatric Traumatic Brain Injury—from Mechanisms to Inflammatory Networks
Fraunberger, E. A., & Esser, M. J. (2019) · Brain Sciences · doi:10.3390/brainsci9110319 · Cited by 36
“The converse can also occur, with microglia inducing a toxic astrocyte phenotype through secreting TNFα, IL-1β, and C1q [54] - CX3CR1 on microglia exhibits a time dependent effect on outcome after injury, playing a key role in inflammation (accumulation of leukocytes [55]), but is required for proper recovery in sever…”
BackgroundDeplete and repeat: microglial CSF1R inhibition and traumatic brain injury
Boland, R., & Kokiko‐Cochran, O. N. (2024) · Frontiers in Cellular Neuroscience · doi:10.3389/fncel.2024.1352790 · Cited by 32
membership, C., Rudyk, C., Dwyer, Z., & Hayley, S. P. (2019) · Journal of Neuroinflammation · doi:10.1186/s12974-019-1483-7 · Cited by 29
Packer, J. M., Giammo, S. G., Wangler, L. M., Davis, A. C., Bray, C. E., & Godbout, J. P. (2025) · Journal of Neuroinflammation · doi:10.1186/s12974-025-03451-1 · Cited by 31
Timaru‐Kast, R., Gotthardt, P., Luh, C., Huang, C., Hummel, R., Schäfer, M. K. E., & Thal, S. C. (2019) · Frontiers in Aging Neuroscience · doi:10.3389/fnagi.2019.00063 · Cited by 28
Gupta, M., Paliwal, V., & Babu, G. (2021) · Metabolic brain disease · doi:10.1007/s11011-021-00801-9 · Cited by 24
Yang, S., Li, L., Liu, Y., Wang, J., Chu, J., Zhang, T., Ning, L., Shi, Y., Fang, Y., Zeng, P. H., et al. (2016) · International Journal of Molecular Sciences · doi:10.3390/ijms17071181 · Cited by 28
“CD68, a lysosomal activity marker expressed during inflammatory processes by microglia/macrophages, is regarded as a marker of M1 microglia/macrophages [13,17,18].”
BackgroundMethodInfluentialHyperthermia and Mild Traumatic Brain Injury: Effects on Inflammation and the Cerebral Vasculature
Truettner, J. S., Bramlett, H. M., & Dietrich, W. D. (2017) · Journal of Neurotrauma · doi:10.1089/neu.2017.5303 · Cited by 26
Ouyang, W., Yan, Q., Zhang, Y., & Fan, Z. (2017) · PLoS ONE · doi:10.1371/journal.pone.0171976 · Cited by 22
Mini Review of Controlled Cortical Impact: A Well-Suited Device for Concussion Research
Osier, N. D., & Dixon, C. E. (2017) · Brain Sciences · doi:10.3390/brainsci7070088 · Cited by 14
Revisiting the critical roles of reactive microglia in traumatic brain injury
Zhao, J., Zhou, Y., Zhou, C.-W., Zhan, K., Yang, M., Wen, M., & Zhu, L. (2025) · International Journal of Surgery · doi:10.1097/js9.0000000000002420 · Cited by 30
“This transition in phenotypic expression is linked to the differing effects of CX3CR1 deletion after TBI [ 397 ] .”
Cohen, E. M., Mohammed, S., Kavurma, M. M., Nedoboy, P. E., Cartland, S. P., Farnham, M. M. J., & Pilowsky, P. M. (2018) · Autonomic Neuroscience · doi:10.1016/j.autneu.2018.12.002 · Cited by 20
Kim, M., Jung, K., Ko, Y., Kim, I., Hwang, K., Jang, J., Shin, J. E., & Park, K. I. (2020) · Cells · doi:10.3390/cells9051195 · Cited by 20
Caspase inhibition impaired the neural stem/progenitor cell response after cortical ischemia in mice
Osman, A. M., Neumann, S., Kuhn, H. G., & Blomgren, K. (2015) · Oncotarget · doi:10.18632/oncotarget.6803 · Cited by 15
“No difference in the numbers of Iba-1+ cells or the percentage of Iba-1+/ CD68+ cells was detected in the peri-infarct cortex (Figure 3E and 3F, respectively).”
BackgroundInfluentialToutonji, A., Krieg, C., Borucki, D. M., Mandava, M., Guglietta, S., & Tomlinson, S. (2023) · Acta Neuropathologica Communications · doi:10.1186/s40478-023-01583-0 · Cited by 17
“In this context, CX3CR1 has been shown to have a neuroprotective role in chronic TBI, and CX3CR1 deficiency was recently shown to be associated with worse cognitive performance and increased neuronal cell death at day 30 after TBI [37, 38].”
BackgroundVérité, J., Janet, T., Chassaing, D., Fauconneau, B., Rabeony, H., & Page, G. (2018) · Journal of Neuroinflammation · doi:10.1186/s12974-018-1220-7 · Cited by 25
“These different effects were related to changes in microglia phenotypes, with enhancing of the neuroprotective and anti-inflammatory state [80].”
BackgroundKim, B., Vasanthakumar, A., Li, Q. S., Nudelman, K. N. H., Risacher, S. L., Davis, J. W., Idler, K. B., Lee, J., Seo, S. W., Waring, J. F., et al. (2022) · Alzheimer s & Dementia Diagnosis Assessment & Disease Monitoring · doi:10.1002/dad2.12354 · Cited by 13
Liu, J., Wang, Y., Sun, H., Lei, D., Liu, J.-F., Fei, Y., Wang, C., & Han, C. (2024) · Neuroscience Letters · doi:10.1016/j.neulet.2024.138089 · Cited by 13
Inampudi, C., Ciccotosto, G. D., Cappai, R., & Crack, P. J. (2020) · Journal of Neurotrauma · doi:10.1089/neu.2019.6955 · Cited by 12
Machado, C. A., Oliveira, B. D. S., Dias, T. L., de Barros, J. L. V. M., Ferreira, G., Cordeiro, T., Feracin, V., Alexandre, C. H., Abreu, L. K. S., da Silva, W. N., et al. (2023) · Journal of Neuroimmunology · doi:10.1016/j.jneuroim.2023.578242 · Cited by 12
Pre-Clinical and Clinical Methods in Brain Trauma Research
Cox, A. (2018) · Neuromethods · doi:10.1007/978-1-4939-8564-7 · Cited by 11
“Marshall and colleagues, using the National Traumatic Coma Database, developed a CT-based classification of brain trauma [39].”
MethodZhang, Q. C., Cao, X., Yang, H., Liu, X., Lou, S., Kong, L., Rong, L., Shan, J.-J., & Xu, Y. (2022) · Neural Regeneration Research · doi:10.4103/1673-5374.355759 · Cited by 13
“CX3CL1/ CX3CR1 signaling is crucial for microglia-neuron cross-talk (Mizuno et al., 2003; Pabon et al., 2011; Shan et al., 2011; Lee et al., 2014; Febinger et al., 2015; Luo et al., 2019).”
BackgroundTufan, E., Taheri, S., Karaca, Z., Mehmetbeyoğlu, E., Şükranlı, Z. Y., Bayramov, K. K., Ulutabanca, H., Tanrıverdi, F., Ünlühızarcı, K., Rassoulzadegan, M., et al. (2023) · Neuroendocrinology · doi:10.1159/000535748 · Cited by 9
CX3CR1 mediates motor dysfunction in mice through 5-HTR2a
Pei, J., Zou, Y., Wan, C., Liu, S., Hu, B., Li, Z., & Tang, Z. (2023) · Behavioural Brain Research · doi:10.1016/j.bbr.2023.114837 · Cited by 9
“Heidi et al. found that following mild controlled cortical impact injury, motor deficits, cells death, and neuronals damage were more severe in injured wild-type mice compared to CX3CR1-/- mice [24].”
Paul, D., & Basavan, D. (2022) · Future Journal of Pharmaceutical Sciences · doi:10.1186/s43094-022-00446-0 · Cited by 5
Wu, Y., Park, T., Kwon, E. E., Feng, S. X., Schweder, P. M., Dragunow, M., Shim, V., & Rosset, S. (2022) · Frontiers in Neuroscience · doi:10.3389/fnins.2022.994251 · Cited by 9
“Various experimental models have already been developed, including in vivo animal models, and in vitro models with cultured animal and human brain cells, where the majority of studies used animal cells (Arun et al., 2011; Febinger et al., 2015; Ravin et al., 2016; Sherman et al., 2016; Zanier et al., 2016).”
BackgroundMarcatti, M., Labastida, J. A., Tang, T. Z., Ahmad, A., Payne, C. K., Schwartz, N., Villarreal, P., Solomon, O. D., Vargas, G., Wu, P., et al. (2026) · Proceedings of the National Academy of Sciences of the United States of America · doi:10.1073/pnas.2527009123 · Cited by 6
“Notably, while mTBI does not cause immediate tissue damage or DAMP generation, microglial activation still occurs (53).”
Amato, S., & Arnold, A. (2025) · Bulletin of Mathematical Biology · doi:10.1007/s11538-025-01412-6 · Cited by 7
“…strokewithmeasurementstakeninthethalamusoripsilateralbrainregionsaswellas in neuroinflammation following TBI over longer time intervals (Rupalla et al. 1998; Bodhankar et al. 2015; Stubbe et al. 2013; Febinger et al. 2015; Younger et al. 2019; Donat et al. 2017).”
Dwyer, M. K. R., Amelinez-Robles, N., Polsfuss, I., Herbert, K. L., Kim, C., Varghese, N. J., Parry, T. J., Buller, B., Verdoorn, T. A., Billing, C. B., et al. (2023) · Experimental Neurology · doi:10.1016/j.expneurol.2023.114608 · Cited by 6
“CD206 increases due to injury in in vivo TBI models (Jin et al., 2012; Febinger et al., 2015).”
BackgroundEmerging Roles of Microglia in Blood-Brain Barrier Integrity in Aging and Neurodegeneration
Zhang, S., Meng, R., Jiang, M., Qing, H., & Ni, J. (2023) · Current Neuropharmacology · doi:10.2174/1570159x21666230203103910 · Cited by 16
“CX3CL1 is involved in the interaction of neurons and microglia, and CX3CL1-CX3CR1 damage dysregulates microglial responses and leads to neuronal injury [117].”
BackgroundEarly-Life Mild Traumatic Brain Injury Alters Neurodevelopment and Behavior in Mice
Corrigan, R. R., Lanier, A., Dresher, E. S., Sran, S., & Bedrosian, T. A. (2025) · Neurotrauma Reports · doi:10.1089/neur.2025.0016 · Cited by 3
“34 We compared Cx3Cr1 expression relative to b -actin among groups using Western blot (Fig.”
Chamera, K., Curzytek, K., Kamińska, K., Leśkiewicz, M., & Basta‐Kaim, A. (2024) · Life · doi:10.3390/life14060721 · Cited by 4
“Dysfunction in these axes exaggerates the proinflammatory response of these cells to immune challenges [84,85] and/or causes a prolonged inflammatory response [86,87].”
BackgroundData-driven modeling and prediction of microglial cell dynamics in the ischemic penumbra
Amato, S., & Arnold, A. (2025) · Mathematical Biosciences · doi:10.1016/j.mbs.2025.109549 · Cited by 2
“…and evaluate forecast predictions based on information obtained from experimental literature on microglial cell counts following MCAO-induced ischemic stroke with measurements taken in the thalamus or ipsilateral brain regions and in neuroinflammation following TBI [50, 57, 58, 59, 60, 61, 62].”
Timaru-Kast, R., Coronel-Castello, S. P., Krämer, T. J., Hugonnet, A. V., Schäfer, M. K. E., Sebastiani, A., & Thal, S. (2023) · Scientific Reports · doi:10.1038/s41598-023-33797-6 · Cited by 2
A Controlled Cortical Impact Mouse Model for Mild Traumatic Brain Injury
Febinger, H. Y., Thomasy, H. E., & Gemma, C. (2016) · BIO-PROTOCOL · doi:10.21769/bioprotoc.1901 · Cited by 2
“Furthermore, we provide protocols for validating TBI models using behavioral tests that examine post-traumatic neuromotor deficits resulting from TBI neuropathology (Fujimoto et al., 2004; Febinger et al., 2015; Smith et al., 1995; Bolkvadze and Pitkanen, 2012).”
MethodSelf-citationOptical Windows for Transcranial Brain Imaging in Living Mice: Skull Thinning, Clearing, and Beyond
Fu, Y., Yan, G., She, Z., He, Y., Liu, K., & Qu, J. Y. (2026) · Advanced Science · doi:10.1002/advs.76237 · Cited by 1
Zhang, R., Tan, X.-Y., Zhang, Y.-H., Ma, Y.-Z., You, Z.-Y., Huang, Y., & Yang, L.-N. (2025) · Phytotherapy Research · doi:10.1002/ptr.70133 · Cited by 1
“Altering CX3CL1 signal leads to microglia dysfunction and subsequent neuronal damage (Church et al. 2023; Febinger et al. 2015).”
Machado, C. A., Oliveira, B. D. S., Fernandes, H. D. B., de Carvalho, R. T., Pozzolin, E. T., Kangussu, L., Carvalho, B., Teixeira, A. L., & de Miranda, A. D. (2025) · Molecular and cellular neurosciences · doi:10.1016/j.mcn.2025.104013 · Cited by 1
Park, E., Lyon, J. G., Alvarado-Velez, M., Betancur, M. I., Mokarram, N., Shin, J., & Bellamkonda, R. (2020) · doi:10.1101/2020.11.07.372979 · Cited by 1
“CD45 antibody was used to differentiate resident microglia (CD45low) from blood-derived leukocytes (CD45high) (Febinger et al., 2015; Posel et al., 2016).”
MethodControlled Cortical Impact for Modeling Traumatic Brain Injury in Animals
Osier, N. D., & Dixon, C. E. (2018) · Neuromethods · doi:10.1007/978-1-4939-8564-7_5 · Cited by 3
HISTOLOGICAL AND BEHAVIORAL CONSEQUENCES OF REPEATED MILD TRAUMATIC BRAIN INJURY IN MICE
Hall, B. (2016) · UKnowledge (University of Kentucky) · doi:10.13023/etd.2016.165
Bonaterra, G. A., Much, L., Hahn, J., Aziz-Kalbhenn, H., Kelber, O., Bedal, K., Schwarzbach, H., Schwarz, A., & Kinscherf, R. (2026) · Frontiers in Pharmacology · doi:10.3389/fphar.2026.1916960
Decouty‐Pérez, C., Álvarez‐Rubal, M., Polo-Fernandez, I., Martínez-Cuevas, E., Ruiz, C., Fuertes-Yebra, E., Chioua, M., Diez‐Iriepa, D., Marco, J. L., Valencia, I., et al. (2026) · ACS Pharmacology & Translational Science · doi:10.1021/acsptsci.6c00341
Lv, C., Zhu, W., Wen, X., & Da, Y. (2026) · ASN NEURO · doi:10.1080/17590914.2026.2715625
“Previous studies further suggest that CX3CR1 may regulate microglial phenotypes in a stage-dependent manner (Febinger et al., 2015), with potentially protective effects during early disease but dysregulated pro-inflammatory consequences during later stages (Zhang et al., 2018).”
Scutellarin Alleviates Neuronal Apoptosis After Ischemia and Hypoxia via the HIF‐1α–CX3CR1 Axis
Pei, J., Hu, B., Wen, Z., Wan, C., Zhang, F., Li, S., Wang, L., Li, Z., & Tang, Z. (2026) · CNS Neuroscience & Therapeutics · doi:10.1002/cns.71098
CX3CL1/CX3CR1 axis dysregulation contributes to epileptogenic mechanisms in focal cortical dysplasia
Lei, L., Yang, S., Li, Y., Tian, J., Fang, Y., Huang, T., Chen, S., & Zhou, L. (2026) · Acta Neuropathologica Communications · doi:10.1186/s40478-026-02274-2
“…regulation of microglial phenotype by CX3CR1 parallels findings in other neurological disorders, such as amyotrophic lateral sclerosis (ALS) and traumatic brain injury (TBI), where its function shifts from an early protective role to a later detrimental state of inflammatory dysregulation [3, 21].”
Pediatric Repetitive Mild Traumatic Brain Injury Elicits T Cell-Mediated Neuroinflammation
Shumilov, K., Arellano, L. D., Shin, Y., Dominguez, G., Swarup, R., Bernhardt, W., Greer, J., McAllister, J. P., García-Bonilla, M. J., Jacobs, K. M., et al. (2026) · Neurotrauma Reports · doi:10.1177/2689288x251400587
“12 This may be related to the continuous presence of peripheral immune cells.”
Zhao, F., Shi, J., Zhang, Y., & Cao, L. (2026) · Pain Research and Management · doi:10.1155/prm/2444554
de Barros, J. L. V. M., Cardoso, M. G. D. F., Almeida, D. E. D. S., da Silva, A. S., Machado, C. A., Oliveira, B. D. S., de Abreu, I. A. T., Fontes, P., Rocha, N. P., Pedroso, V. S. P., et al. (2026) · Molecular Neurobiology · doi:10.1007/s12035-026-06130-1
“…to mild controlled cortical impact, deletion of CX3CR1 reduced early neuromotor impairment and neuronal loss but led to greater delayed neuron death and worse spatial learning at 30 days, indicating that CX3CR1 signaling has opposite effects in the acute and chronic phases after mTBI [28].”
Timaru-Kast, R., Coronel-Castello, S. P., Krämer, T. J., Hugonnet, A. V., Schäfer, M. K. E., Sebastiani, A., & Thal, S. (2021) · doi:10.21203/rs.3.rs-999453/v1
Zhang, Q., Cao, X., Yang, H., Liu, X., Lou, S., Kong, L., Rong, L., Shan, J.-J., & Xu, Y. (2021) · Research Square · doi:10.21203/rs.3.rs-687096/v1
“CX3CL1/CX3CR1 signaling is crucial for microglia-neuron cross-talk [24-28,38].”
BackgroundZhang, Q., Cao, X., Yang, H., Liu, X., Lou, S., Kong, L., Rong, L., Shan, J.-J., & Xu, Y. (2021) · Research Square · doi:10.21203/rs.3.rs-538353/v1
Fractalkine signaling in psychiatric disorder : observations in the postmortem brain
Hill, S. L. (2019) · cIRcle (University of British Columbia) · doi:10.14288/1.0384590
“, mean, SD) 0 85,004 (100,335) 10,212 (22,871) Prescribed Mood Stabilizers (No.”
Metadata
- Authors
- Febinger, H. Y., Thomasy, H. E., Pavlova, M. N., Ringgold, K. M., Barf, P. R., George, A. M., Grillo, J. N., Bachstetter, A. D., Garcia, J. A., Cardona, A. E., Opp, M. R., & Gemma, C.
- Affiliations
- University of Washington (US)
- University of Kentucky (US)
- The University of Texas at San Antonio (US)
- Corresponding author
- Gemma, Carmelina
- Venue
- Journal of Neuroinflammation
- Published
- 2015-09-02
- Volume
- 12
- Issue
- 1
- Pages
- 154-154
- ISSN
- 1742-2094 (ISSN-L)
- PMC
- PMC4557842
- OpenAlex
- W1944546979
- Cited by
- 110
- References
- 58
- Citations by year
- 2026: 10 · 2025: 8 · 2024: 5 · 2023: 10 · 2022: 6 · 2021: 15 · 2020: 10 · 2019: 13 · 2018: 16 · 2017: 7 · 2016: 9 · 2015: 1
- FWCI
- 7.76
- Type
- journal article
- Language
- en
- Open access
- gold
- doi.org
- Locations
- Journal of Neuroinflammation (publishedVersion, cc-by)
- Europe PMC (PubMed Central) (publishedVersion, cc-by)
- PubMed Central (publishedVersion, cc-by)
- PubMed (publishedVersion)
- UKnowledge (University of Kentucky) (submittedVersion, cc-by)
- Funders
- National Institutes of Health (SC1GM095426)
- Topics
- Health Sciences › Medicine › Clinical Neurology › Traumatic Brain Injury and Neurovascular Disturbances
- Life Sciences › Neuroscience › Neurology › Neuroinflammation and Neurodegeneration Mechanisms
- Health Sciences › Medicine › Clinical Neurology › Traumatic Brain Injury Research
- Keywords
- CX3CR1, fractalkine, mild traumatic brain injury, microglial activation, M1/M2 microglial polarization, neuroinflammation, controlled cortical impact, neuronal cell death, cognitive impairment, CX3CR1 knockout mice
- MeSH terms
- CX3C Chemokine Receptor 1, Analysis of Variance, Animals, Brain, Brain Injuries, Disease Models, Animal, Exploratory Behavior, Flow Cytometry, Fluoresceins, Leukocytes, Mononuclear, Macrophage Activation, Male, Mice, Transgenic, Neurons, Psychomotor Disorders, Time Factors, Maze Learning, Receptors, Chemokine, Rotarod Performance Test, Green Fluorescent Proteins, Mice
About these checks
Registry, retraction, Cites and statistics results are computed, not judged, with one exception: a printed reference that no index lists is read once by a model before it counts as a citation error. Claims are extracted by a model and kept only when their quote appears verbatim in the text; each cited source is then checked, with a model’s help, for whether it says what the claim relies on. Those verdicts can be wrong — read the claim’s quote and the cited source before relying on one.
Statistics and arithmetic are recomputed, not judged.
Confidence bands are shown only for fields calibrated on our annotated test set. None is calibrated yet, so no band is shown.
What counts as a claim ›How we measure confidence ›How we check this ›
Are you an author, or do you see a problem with this page? Request a review
