

The DOI matches its Crossref record; 46 of the 46 references it cites were found in a registry or an index.
Absence of CX3CR1 impairs the internalization of Tau by microglia
Open accessAbstract
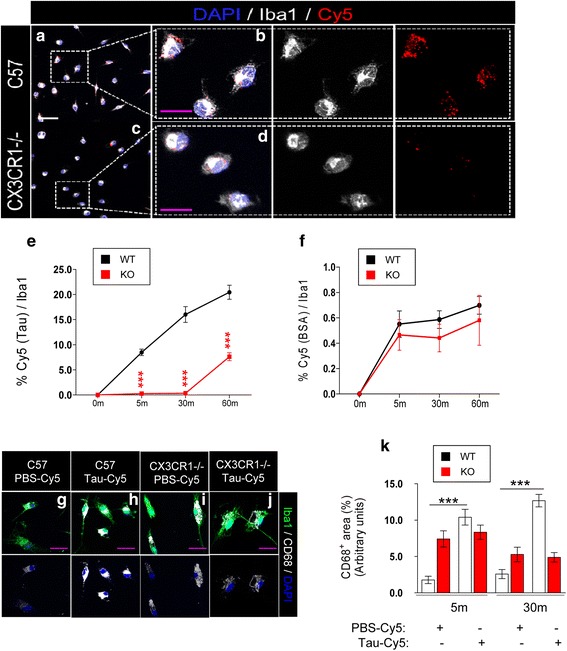
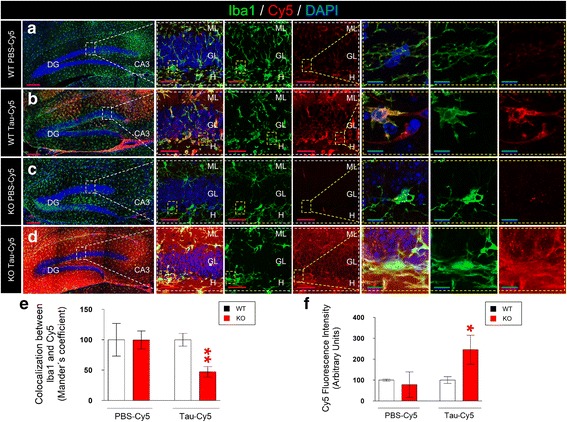
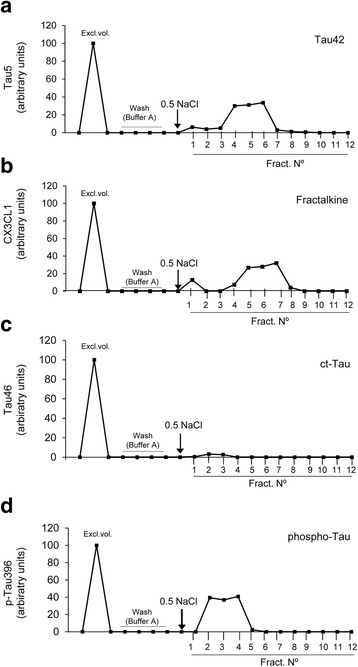
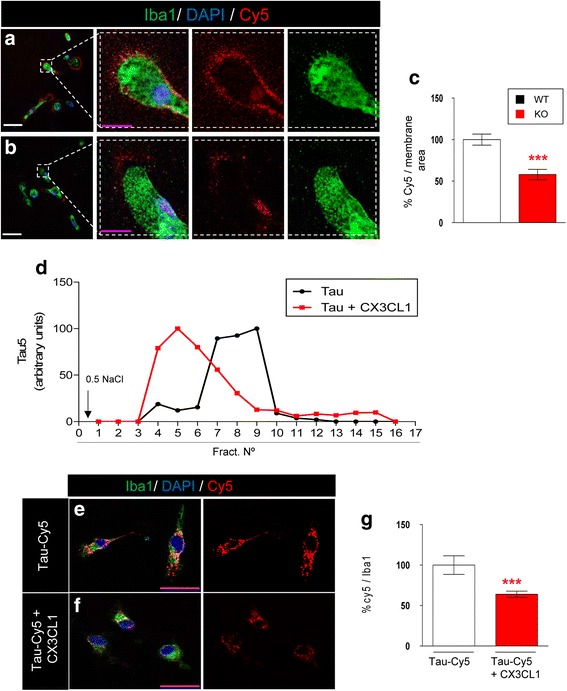
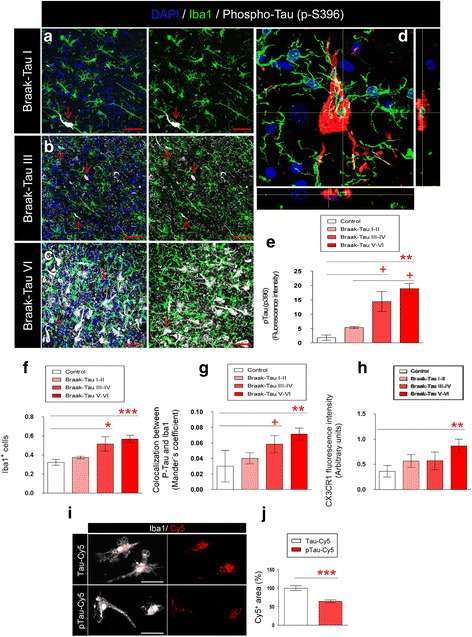
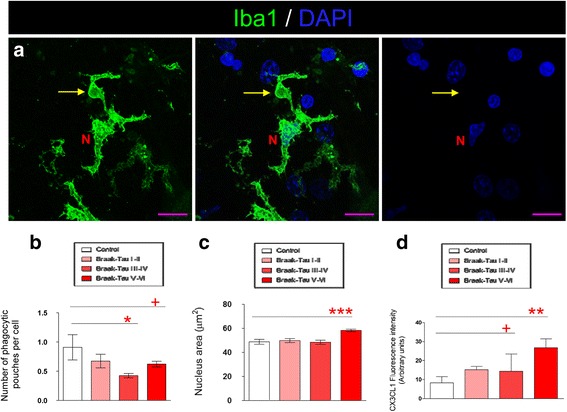
Extracellular Tau is toxic for neighboring cells, and it contributes to the progression of AD. The CX3CL1/CX3CR1 axis is an important neuron/microglia communication mechanism. We studied Tau clearance by microglia both in vitro (microglia primary cultures treated with Cy5-Tau, affinity chromatography to study the binding of Tau to CX3CR1, and Tau-CX3CL1 competition assays) and in vivo (stereotaxic injection of Cy5-Tau into WT and CX3CR1 −/− mice). The expression of CX3CR1, CX3CL1 and the microglial phagocytic phenotype were studied in brain tissue samples from AD patients. Tau binding to CX3CR1 triggers the internalization of the former by microglia, whereas S396 Tau phosphorylation decreases the binding affinity of this protein to CX3CR1. Of note, the progressive increase in the levels of phosho-Tau occurred in parallel with an increase in CX3CR1. In addition, our studies suggest that the phagocytic capacity of microglia in brain tissue samples from AD patients is decreased. Furthermore, the CX3CR1/CX3CL1 axis may be impaired in late stages of the disease. Our data suggest that the CX3CR1/CX3CL1 axis plays a key role in the phagocytosis of Tau by microglia in vitro and in vivo and that it is affected as AD progresses. Taken together, our results reveal CX3CR1 as a novel target for the clearance of extracellular Tau.
Overview
The claims and statistics of this paper haven’t been checked yet.
Run the check — free, no account needed. It reads the open-access text and checks the sources it cites.
Integrity signals
Registry
Cites
Statistics
Figures
Verification
Claims the paper makes
The claims and statistics of this paper haven’t been checked yet.
Run the check — free, no account needed. It reads the open-access text and checks the sources it cites.
Claims other papers make about this one
Each is checked against this paper’s own text: does it say what the citing paper says it does?
In the citing paper
“CX3CR1 binds to tau, and to a lesser extent to hyperphosphorylated tau [263].”
From Molecular and cellular mechanisms underlying the pathogenesis of Alzheimer’s disease (2020) · cites this paper as [263]
In the citing paper
“CX3CR1 deficiency impairs microglia-mediated tau internalization in vitro, and promotes the accumulation of hyperphosphorylated tau in vivo [263, 429].”
From Molecular and cellular mechanisms underlying the pathogenesis of Alzheimer’s disease (2020) · cites this paper as [263]
In the citing paper
“Microglia could phagocytize different tau species,386,387 and this process was partly dependent on microglial fractalkine receptor (CX3CR1) receptor.388”
From Microglia in neurodegenerative diseases: mechanism and potential therapeutic targets (2023) · cites this paper as [388]
Self-check
Percentages, sums and reported differences re-computed from the paper’s own numbers.
The self-check needs the paper’s full text.
Citations
Cites
Neuropathological stageing of Alzheimer-related changes.
Braak, H., & Braak, E. (1991) · Acta Neuropathologica · doi:10.1007/bf00308809 · Cited by 16,123 · cited 1×
“In 1991, Braak and Braak proposed a neuropathological classification to differentiate Braak-Tau initial (I–II), intermediate (III–IV), and advanced (V–VI) stages of AD on the basis of the spread of neurofibrillary tangles within the brain [34].”
BackgroundA guided tour into subcellular colocalization analysis in light microscopy
Bolte, S., & Cordelières, F. P. (2006) · Journal of Microscopy · doi:10.1111/j.1365-2818.2006.01706.x · Cited by 5,506
Fate Mapping Analysis Reveals That Adult Microglia Derive from Primitive Macrophages
Ginhoux, F., Greter, M., Leboeuf, M., Nandi, S., See, P., Gokhan, S., Mehler, M. F., Conway, S. J., Ng, L. G., Stanley, E. R., et al. (2010) · Science · doi:10.1126/science.1194637 · Cited by 5,175
Microglia: a sensor for pathological events in the CNS
Kreutzberg, G. W. (1996) · Trends in Neurosciences · doi:10.1016/0166-2236(96)10049-7 · Cited by 4,396
TREM2 Variants in Alzheimer's Disease
Guerreiro, R., Wojtas, A., Bras, J., Carrasquillo, M., Rogaeva, E., Majounie, E., Cruchaga, C., Sassi, C., Kauwe, J. S. K., Younkin, S., et al. (2013) · New England Journal of Medicine · doi:10.1056/nejmoa1211851 · Cited by 3,020
Jung, S., Aliberti, J., Graemmel, P., Sunshine, M. J., Kreutzberg, G. W., Sher, A., & Littman, D. R. (2000) · Molecular and Cellular Biology · doi:10.1128/mcb.20.11.4106-4114.2000 · Cited by 2,632
Microglial M1/M2 polarization and metabolic states
Orihuela, R., McPherson, C. A., & Harry, G. J. (2016) · British Journal of Pharmacology · doi:10.1111/bph.13139 · Cited by 2,070
Microglia as a source and target of cytokines
Hanisch, U. (2002) · Glia · doi:10.1002/glia.10161 · Cited by 1,645 · cited 1×
“These microglial functions are regulated by communication between neurons, astrocytes and microglia [8] through cytokines, chemokines, trophic factors, and other molecules.”
BackgroundMicroglia Shape Adult Hippocampal Neurogenesis through Apoptosis-Coupled Phagocytosis
Sierra, A., Encinas, J. M., Deudero, J. J. P., Chancey, J. H., Enikolopov, G., Overstreet-Wadiche, L. S., Tsirka, S. E., & Maletic-Savatic, M. (2010) · Cell Stem Cell · doi:10.1016/j.stem.2010.08.014 · Cited by 1,622
Depletion of microglia and inhibition of exosome synthesis halt tau propagation
Asai, H., Ikezu, S., Tsunoda, S., Medalla, M., Luebke, J., Haydar, T., Wolozin, B., Butovsky, O., Kügler, S., & Ikezu, T. (2015) · Nature Neuroscience · doi:10.1038/nn.4132 · Cited by 1,591
Cited by
Sorted by citations
Neuroinflammation and microglial activation in Alzheimer disease: where do we go from here?
Leng, F., & Edison, P. (2021) · Nature Reviews Neurology · doi:10.1038/s41582-020-00435-y · Cited by 3,179
Microglia in neurodegenerative diseases: mechanism and potential therapeutic targets
Gao, C., Jiang, J., Tan, Y., & Chen, S. (2023) · Signal Transduction and Targeted Therapy · doi:10.1038/s41392-023-01588-0 · Cited by 1,616
Moreno-Jiménez, E. P., Flor-García, M., Terreros-Roncal, J., Rábano, A., Cafini, F., Pallas-Bazarra, N., Ávila, J., & Llorens-Martín, M. (2019) · Nature Medicine · doi:10.1038/s41591-019-0375-9 · Cited by 1,577
Self-citationMolecular and cellular mechanisms underlying the pathogenesis of Alzheimer’s disease
Guo, T., Zhang, D., Zeng, Y., Huang, T. Y., Xu, H., & Zhao, Y. (2020) · Molecular Neurodegeneration · doi:10.1186/s13024-020-00391-7 · Cited by 994
Microglial activation and tau propagate jointly across Braak stages
Pascoal, T. A., Benedet, A. L., Ashton, N. J., Kang, M. S., Therriault, J., Chamoun, M., Savard, M., Lussier, F. Z., Tissot, C., Karikari, T. K., et al. (2021) · Nature Medicine · doi:10.1038/s41591-021-01456-w · Cited by 490
Metadata
- Authors
- Bolós, M., Llorens-Martín, M., Perea, J. R., Jurado-Arjona, J., Rábano, A., Hernández, F., & Avila, J.
- Affiliations
- Consejo Superior de Investigaciones Científicas (ES)
- Biomedical Research Networking Center on Neurodegenerative Diseases (ES)
- Fundacion Centro De Investigacion De Enfermedades Neurologicas (ES)
- Corresponding author
- Bolós, Marta
- Venue
- Molecular Neurodegeneration
- Published
- 2017-08-15
- Volume
- 12
- Issue
- 1
- Pages
- 59-59
- ISSN
- 1750-1326 (ISSN-L)
- PMC
- PMC5558740
- OpenAlex
- W2745518706
- Cited by
- 231
- References
- 46
- Citations by year
- 2026: 22 · 2025: 28 · 2024: 27 · 2023: 32 · 2022: 31 · 2021: 36 · 2020: 23 · 2019: 20 · 2018: 11
- FWCI
- 10.93
- Type
- journal article
- Language
- en
- Open access
- gold
- doi.org
- Licence
- cc-by
- Locations
- Molecular Neurodegeneration (publishedVersion, cc-by)
- PubMed Central (publishedVersion, cc-by)
- PubMed (publishedVersion)
- DIGITAL.CSIC (Spanish National Research Council (CSIC)) (acceptedVersion, other-oa)
- DIGITAL.CSIC (Spanish National Research Council (CSIC)) (submittedVersion, public-domain)
- DOAJ (DOAJ: Directory of Open Access Journals) (submittedVersion, cc-by-sa)
- Funders
- Spanish Ministry of Health (SAF-2014-53040-P)
- The Alzheimer´s Association (2015-NIRG-340709)
- Centro de Investigación Biomédica en Red sobre Enfermedades Neurodegenerativas (CIBERNED, ISCIII
- Association for Frontotemporal Degeneration (US) (Basic Science Pilot Grant Award 2016)
- Topics
- Life Sciences › Neuroscience › Cellular and Molecular Neuroscience › Alzheimer's disease research and treatments
- Life Sciences › Neuroscience › Neurology › Neuroinflammation and Neurodegeneration Mechanisms
- Life Sciences › Neuroscience › Neurology › Neurological Disease Mechanisms and Treatments
- Keywords
- CX3CR1, fractalkine, microglia, tau clearance, Alzheimer's disease, microglial phagocytosis, neuron-microglia communication, extracellular tau, CX3CR1 knockout mice
- MeSH terms
- CX3C Chemokine Receptor 1, Alzheimer Disease, Animals, Brain, Neurons, Phosphorylation, tau Proteins, Microglia, Mice, Knockout
About these checks
Registry, retraction, Cites and statistics results are computed, not judged, with one exception: a printed reference that no index lists is read once by a model before it counts as a citation error. Claims are extracted by a model and kept only when their quote appears verbatim in the text; each cited source is then checked, with a model’s help, for whether it says what the claim relies on. Those verdicts can be wrong — read the claim’s quote and the cited source before relying on one.
Statistics and arithmetic are recomputed, not judged.
Confidence bands are shown only for fields calibrated on our annotated test set. None is calibrated yet, so no band is shown.
What counts as a claim ›How we measure confidence ›How we check this ›
Are you an author, or do you see a problem with this page? Request a review
