

The DOI matches its Crossref record; 57 of the 57 references it cites were found in a registry or an index.
Early increase of CSF sTREM2 in Alzheimer’s disease is associated with tau related-neurodegeneration but not with amyloid-β pathology
Open accessAbstract
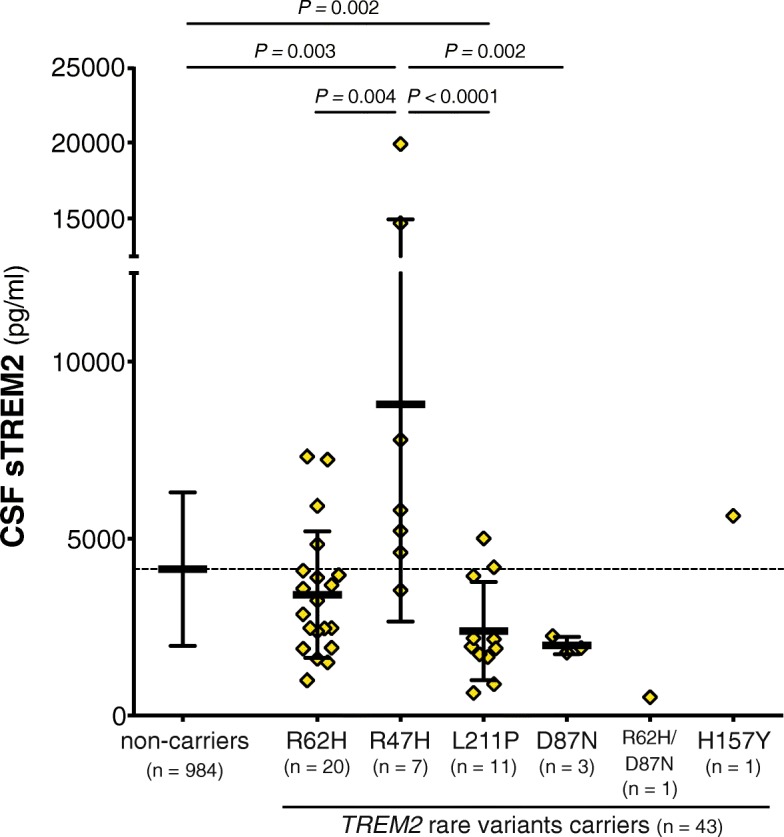
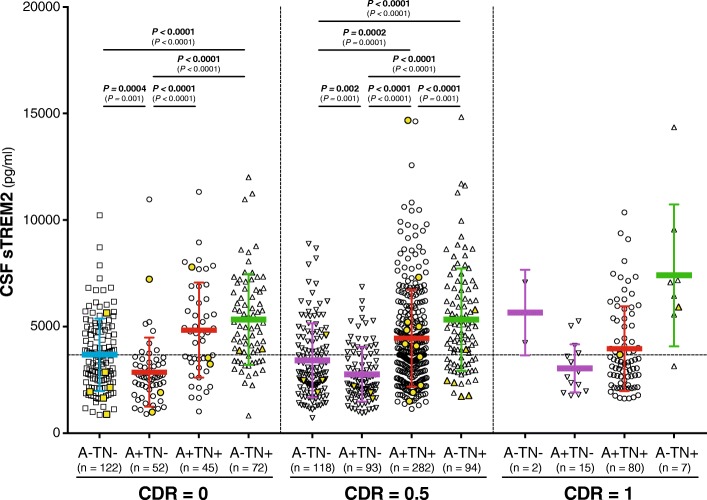
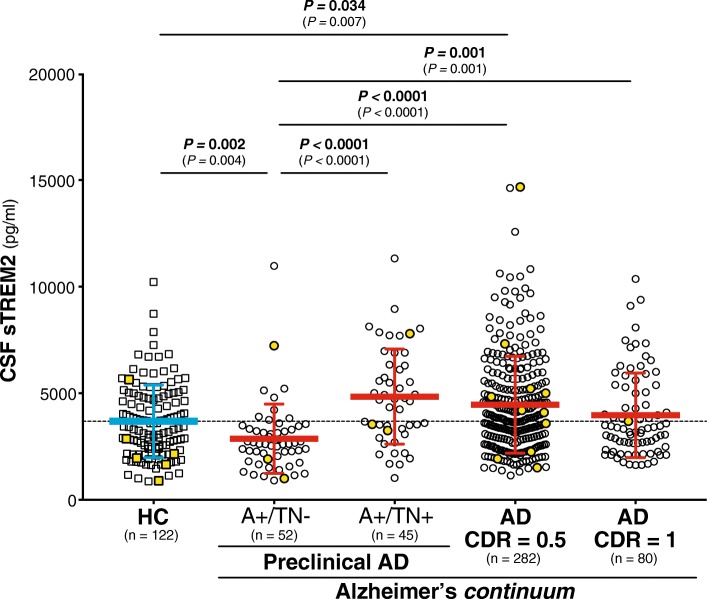
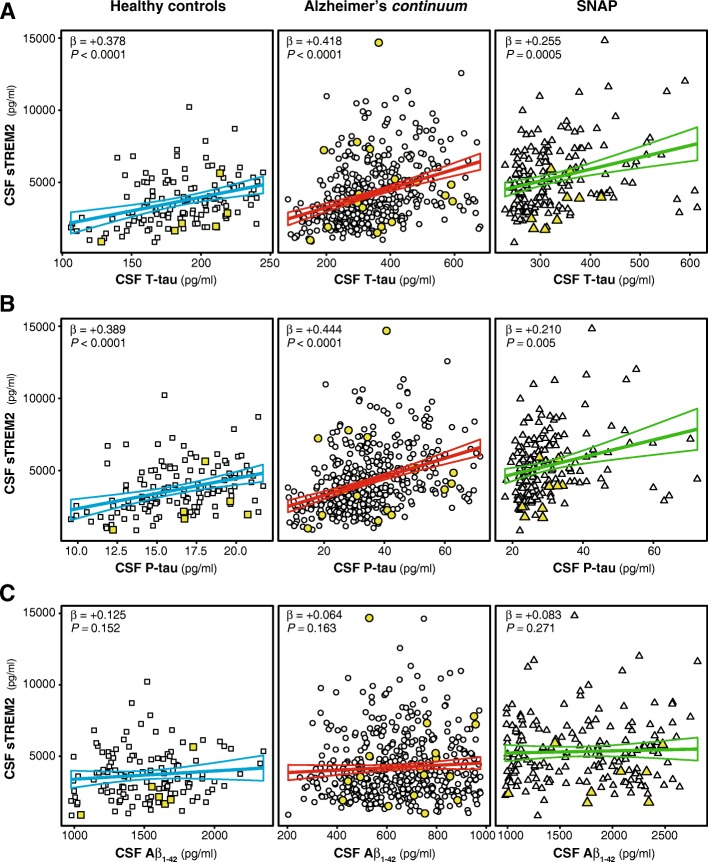
BACKGROUND: TREM2 is a transmembrane receptor that is predominantly expressed by microglia in the central nervous system. Rare variants in the TREM2 gene increase the risk for late-onset Alzheimer's disease (AD). Soluble TREM2 (sTREM2) resulting from shedding of the TREM2 ectodomain can be detected in the cerebrospinal fluid (CSF) and is a surrogate measure of TREM2-mediated microglia function. CSF sTREM2 has been previously reported to increase at different clinical stages of AD, however, alterations in relation to Amyloid β-peptide (Aβ) deposition or additional pathological processes in the amyloid cascade (such as tau pathology or neurodegeneration) remain unclear. In the current cross-sectional study, we employed the biomarker-based classification framework recently proposed by the NIA-AA consensus guidelines, in combination with clinical staging, in order to examine the CSF sTREM2 alterations at early asymptomatic and symptomatic stages of AD. METHODS: (A), phosphorylated tau (T) and total tau as a marker of neurodegeneration (N), at different clinical stages defined by the clinical dementia rating (CDR) score. RESULTS: CSF sTREM2 differed between TREM2 variants, whereas the p.R47H variant had higher CSF sTREM2, p.L211P had lower CSF sTREM2 than non-carriers. We found that CSF sTREM2 increased in early symptomatic stages of late-onset AD but, unexpectedly, we observed decreased CSF sTREM2 levels at the earliest asymptomatic phase when only abnormal Aβ pathology (A+) but no tau pathology or neurodegeneration (TN-), is present. CONCLUSIONS: Aβ pathology (A) and tau pathology/neurodegeneration (TN) have differing associations with CSF sTREM2. While tau-related neurodegeneration is associated with an increase in CSF sTREM2, Aβ pathology in the absence of downstream tau-related neurodegeneration is associated with a decrease in CSF sTREM2.
Overview
The claims and statistics of this paper haven’t been checked yet.
Run the check — free, no account needed. It reads the open-access text and checks the sources it cites.
Integrity signals
Registry
Cites
Statistics
Figures
Verification
Claims the paper makes
The claims and statistics of this paper haven’t been checked yet.
Run the check — free, no account needed. It reads the open-access text and checks the sources it cites.
Claims other papers make about this one
Each is checked against this paper’s own text: does it say what the citing paper says it does?
The check wasn’t confident either way, so it gives no verdict — never disputed.
In the citing paper
“These inconsistent findings can be attributed to the different mouse models used and the different disease stages investigated in the studies79.”
From INPP5D/SHIP1 regulates endo-lysosomal function and cargo-selective phagocytosis in human microglia (2025) · cites this paper as [79]
Experimental — accuracy not yet measured
Self-check
Percentages, sums and reported differences re-computed from the paper’s own numbers.
The self-check needs the paper’s full text.
Citations
Cites
McKhann, G. M., Knopman, D. S., Chertkow, H., Hyman, B. T., Jack, C. R., Kawas, C. H., Klunk, W. E., Koroshetz, W. J., Manly, J. J., Mayeux, R., et al. (2011) · Alzheimer's & Dementia · doi:10.1016/j.jalz.2011.03.005 · Cited by 18,657
NIA‐AA Research Framework: Toward a biological definition of Alzheimer's disease
Jack, C. R., Bennett, D. A., Blennow, K., Carrillo, M. C., Dunn, B., Haeberlein, S. B., Holtzman, D. M., Jagust, W., Jessen, F., Karlawish, J., et al. (2018) · Alzheimer's & Dementia · doi:10.1016/j.jalz.2018.02.018 · Cited by 10,537
Albert, M. S., DeKosky, S. T., Dickson, D., Dubois, B., Feldman, H. H., Fox, N. C., Gamst, A., Holtzman, D. M., Jagust, W. J., Petersen, R. C., et al. (2011) · Alzheimer's & Dementia · doi:10.1016/j.jalz.2011.03.008 · Cited by 10,152
The Clinical Dementia Rating (CDR): Current version and scoring rules
Morris, J. C. (1993) · Neurology · doi:10.1212/wnl.43.11.2412-a · Cited by 9,882
Sperling, R. A., Aisen, P. S., Beckett, L. A., Bennett, D. A., Craft, S., Fagan, A. M., Iwatsubo, T., Jack, C. R., Kaye, J., Montine, T. J., et al. (2011) · Alzheimer's & Dementia · doi:10.1016/j.jalz.2011.03.003 · Cited by 7,155
A Unique Microglia Type Associated with Restricting Development of Alzheimer’s Disease
Keren-Shaul, H., Spinrad, A., Weiner, A., Matcovitch-Natan, O., Dvir-Szternfeld, R., Ulland, T. K., David, E., Baruch, K., Lara-Astaiso, D., Toth, B., et al. (2017) · Cell · doi:10.1016/j.cell.2017.05.018 · Cited by 5,493
TREM2 Variants in Alzheimer's Disease
Guerreiro, R., Wojtas, A., Bras, J., Carrasquillo, M., Rogaeva, E., Majounie, E., Cruchaga, C., Sassi, C., Kauwe, J. S. K., Younkin, S., et al. (2013) · New England Journal of Medicine · doi:10.1056/nejmoa1211851 · Cited by 3,020
Self-citationKrasemann, S., Madore, C., Cialic, R., Baufeld, C., Calcagno, N., El Fatimy, R., Beckers, L., O’Loughlin, E., Xu, Y., Fanek, Z., et al. (2017) · Immunity · doi:10.1016/j.immuni.2017.08.008 · Cited by 2,979
Self-citationAlbert, M., DeKosky, S. T., Dickson, D. W., Dubois, B., Feldman, H., Fox, N. C., Gamst, A. C., Holtzman, D. M., Jagust, W. J., Petersen, R. C., et al. (2013) · FOCUS The Journal of Lifelong Learning in Psychiatry · doi:10.1176/appi.focus.11.1.96 · Cited by 2,643
Variant of TREM2 Associated with the Risk of Alzheimer's Disease
Jonsson, T., Stefansson, H., Steinberg, S., Jonsdottir, I., Jonsson, P. V., Snaedal, J., Bjornsson, S., Huttenlocher, J., Levey, A. I., Lah, J. J., et al. (2013) · New England Journal of Medicine · doi:10.1056/nejmoa1211103 · Cited by 2,558
A/T/N: An unbiased descriptive classification scheme for Alzheimer disease biomarkers
Jack, C. R., Bennett, D. A., Blennow, K., Carrillo, M. C., Feldman, H. H., Frisoni, G. B., Hampel, H., Jagust, W. J., Johnson, K. A., Knopman, D. S., et al. (2016) · Neurology · doi:10.1212/wnl.0000000000002923 · Cited by 1,864
TREM2 Lipid Sensing Sustains the Microglial Response in an Alzheimer’s Disease Model
Wang, Y., Cella, M., Mallinson, K., Ulrich, J. D., Young, K. L., Robinette, M. L., Gilfillan, S., Krishnan, G. M., Sudhakar, S., Zinselmeyer, B. H., et al. (2015) · Cell · doi:10.1016/j.cell.2015.01.049 · Cited by 1,736
The microglial sensome revealed by direct RNA sequencing
Hickman, S. E., Kingery, N. D., Ohsumi, T. K., Borowsky, M. L., Wang, L.-C., Means, T. K., & El Khoury, J. (2013) · Nature Neuroscience · doi:10.1038/nn.3554 · Cited by 1,511
TREM2-mediated early microglial response limits diffusion and toxicity of amyloid plaques
Wang, Y., Ulland, T. K., Ulrich, J. D., Song, W., Tzaferis, J. A., Hole, J. T., Yuan, P., Mahan, T. E., Shi, Y., Gilfillan, S., et al. (2016) · Journal of Experimental Medicine · doi:10.1084/jem.20151948 · Cited by 840
Hansson, O., Seibyl, J., Stomrud, E., Zetterberg, H., Trojanowski, J. Q., Bittner, T., Lifke, V., Corradini, V., Eichenlaub, U., Batrla, R., et al. (2018) · Alzheimer's & Dementia · doi:10.1016/j.jalz.2018.01.010 · Cited by 808
Self-citationTREM2 mutations implicated in neurodegeneration impair cell surface transport and phagocytosis
Kleinberger, G., Yamanishi, Y., Suárez-Calvet, M., Czirr, E., Lohmann, E., Cuyvers, E., Struyfs, H., Pettkus, N., Wenninger-Weinzierl, A., Mazaheri, F., et al. (2014) · Science Translational Medicine · doi:10.1126/scitranslmed.3009093 · Cited by 798
Self-citationMicroglia constitute a barrier that prevents neurotoxic protofibrillar Aβ42 hotspots around plaques
Condello, C., Yuan, P., Schain, A., & Grutzendler, J. (2015) · Nature Communications · doi:10.1038/ncomms7176 · Cited by 718
Paloneva, J., Manninen, T., Christman, G., Hovanes, K., Mandelin, J., Adolfsson, R., Bianchin, M., Bird, T., Miranda, R., Salmaggi, A., et al. (2002) · The American Journal of Human Genetics · doi:10.1086/342259 · Cited by 683
Chiu, I. M., Morimoto, E. T. A., Goodarzi, H., Liao, J. T., O’Keeffe, S., Phatnani, H. P., Muratet, M., Carroll, M. C., Levy, S., Tavazoie, S., et al. (2013) · Cell Reports · doi:10.1016/j.celrep.2013.06.018 · Cited by 651
Holtman, I. R., Raj, D. D., Miller, J. A., Schaafsma, W., Yin, Z., Brouwer, N., Wes, P. D., Möller, T., Orre, M., Kamphuis, W., et al. (2015) · Acta Neuropathologica Communications · doi:10.1186/s40478-015-0203-5 · Cited by 619
Jack, C. R., Knopman, D. S., Weigand, S. D., Wiste, H. J., Vemuri, P., Lowe, V., Kantarci, K., Gunter, J. L., Senjem, M. L., Ivnik, R. J., et al. (2012) · Annals of Neurology · doi:10.1002/ana.22628 · Cited by 602
Tau Kinetics in Neurons and the Human Central Nervous System
Sato, C., Barthélemy, N. R., Mawuenyega, K. G., Patterson, B. W., Gordon, B. A., Jockel-Balsarotti, J., Sullivan, M., Crisp, M. J., Kasten, T., Kirmess, K. M., et al. (2018) · Neuron · doi:10.1016/j.neuron.2018.02.015 · Cited by 586
Self-citationSuárez‐Calvet, M., Kleinberger, G., Araque Caballero, M. Á., Brendel, M., Rominger, A., Alcolea, D., Fortea, J., Lleó, A., Blesa, R., Gispert, J. D., et al. (2016) · EMBO Molecular Medicine · doi:10.15252/emmm.201506123 · Cited by 522
Self-citationTREM2 in Neurodegenerative Diseases
Jay, T. R., von Saucken, V. E., & Landreth, G. E. (2017) · Molecular Neurodegeneration · doi:10.1186/s13024-017-0197-5 · Cited by 427
TREM2 variants: new keys to decipher Alzheimer disease pathogenesis
Colonna, M., & Wang, Y. (2016) · Nature Reviews Neuroscience · doi:10.1038/nrn.2016.7 · Cited by 418
Rayaprolu, S., Mullen, B., Baker, M., Lynch, T., Finger, E., Seeley, W. W., Hatanpaa, K. J., Lomen-Hoerth, C., Kertesz, A., Bigio, E. H., et al. (2013) · Molecular Neurodegeneration · doi:10.1186/1750-1326-8-19 · Cited by 404
Isolation of glia from Alzheimer’s mice reveals inflammation and dysfunction
Orre, M., Kamphuis, W., Osborn, L. M., Jansen, A. H. P., Kooijman, L., Bossers, K., & Hol, E. M. (2014) · Neurobiology of Aging · doi:10.1016/j.neurobiolaging.2014.06.004 · Cited by 394
Bittner, T., Zetterberg, H., Teunissen, C. E., Ostlund, R. E., Militello, M., Andreasson, U., Hubeek, I., Gibson, D., Chu, D. C., Eichenlaub, U., et al. (2016) · Alzheimer's & Dementia · doi:10.1016/j.jalz.2015.09.009 · Cited by 374
TREM2 deficiency impairs chemotaxis and microglial responses to neuronal injury
Mazaheri, F., Snaidero, N., Kleinberger, G., Madore, C., Daria, A., Werner, G., Krasemann, S., Capell, A., Trümbach, D., Wurst, W., et al. (2017) · The EMBO Reports · doi:10.15252/embr.201743922 · Cited by 351
Self-citationCerebrospinal fluid soluble TREM2 is higher in Alzheimer disease and associated with mutation status
Piccio, L., Deming, Y., Del-Águila, J. L., Ghezzi, L., Holtzman, D. M., Fagan, A. M., Fenoglio, C., Galimberti, D., Borroni, B., & Cruchaga, C. (2016) · Acta Neuropathologica · doi:10.1007/s00401-016-1533-5 · Cited by 337
Self-citationWeiner, M. W., Veitch, D. P., Aisen, P. S. S., Beckett, L. A., Cairns, N. J., Green, R. C., Harvey, D. J., Jack, C. R., Jagust, W. J., Morris, J. C., et al. (2017) · Alzheimer s & Dementia · doi:10.1016/j.jalz.2016.11.007 · Cited by 325
Self-citationSuspected non-Alzheimer disease pathophysiology — concept and controversy
Jack, C. R., Knopman, D. S., Chételat, G., Dickson, D. W., Fagan, A. M., Frisoni, G. B., Jagust, W. J., Mormino, E. C., Petersen, R. C., Sperling, R. A., et al. (2016) · Nature Reviews Neurology · doi:10.1038/nrneurol.2015.251 · Cited by 313
Piccio, L. M., Buonsanti, C., Cella, M., Tassi, I., Schmidt, R. E., Fenoglio, C., Rinker, J. R., Naismith, R. T., Panina‐Bordignon, P., Passini, N., et al. (2008) · Brain · doi:10.1093/brain/awn217 · Cited by 311
Self-citationIncreased cerebrospinal fluid soluble TREM2 concentration in Alzheimer’s disease
Heslegrave, A., Heywood, W., Paterson, R., Magdalinou, N., Svensson, J., Johansson, P., Öhrfelt, A., Blennow, K., Hardy, J., Schott, J., et al. (2016) · Molecular Neurodegeneration · doi:10.1186/s13024-016-0071-x · Cited by 303
Wunderlich, P., Glebov, K., Kemmerling, N., Tien, N. T., Neumann, H., & Walter, J. (2013) · Journal of Biological Chemistry · doi:10.1074/jbc.m113.517540 · Cited by 296
Suárez-Calvet, M., Araque Caballero, M. Á., Kleinberger, G., Bateman, R. J., Fagan, A. M., Morris, J. C., Levin, J., Danek, A., Ewers, M., Haass, C., et al. (2016) · Science Translational Medicine · doi:10.1126/scitranslmed.aag1767 · Cited by 272
Self-citationSchlepckow, K., Kleinberger, G., Fukumori, A., Feederle, R., Lichtenthaler, S. F., Steiner, H., & Haass, C. (2017) · EMBO Molecular Medicine · doi:10.15252/emmm.201707672 · Cited by 266
Self-citationTREM2 Variant p.R47H as a Risk Factor for Sporadic Amyotrophic Lateral Sclerosis
Cady, J., Koval, E. D., Benitez, B. A., Zaidman, C., Jockel-Balsarotti, J., Allred, P., Baloh, R. H., Ravits, J., Simpson, E., Appel, S. H., et al. (2014) · JAMA Neurology · doi:10.1001/jamaneurol.2013.6237 · Cited by 262
Self-citationKleinberger, G., Brendel, M., Mracsko, E. Z., Wefers, B., Groeneweg, L., Xiang, X., Focke, C., Deußing, M., Suárez‐Calvet, M., Mazaheri, F., et al. (2017) · The EMBO Journal · doi:10.15252/embj.201796516 · Cited by 249
Self-citationTREM2 is upregulated in amyloid plaque-associated microglia in aged APP23 transgenic mice
Frank, S., Burbach, G. J., Bonin, M., Walter, M., Streit, W., Bechmann, I., & Deller, T. (2008) · Glia · doi:10.1002/glia.20710 · Cited by 247
Thornton, P., Sevalle, J., Deery, M. J., Fraser, G., Zhou, Y., Ståhl, S., Franssen, E. H., Dodd, R. B., Qamar, S., Gomez Perez‐Nievas, B., et al. (2017) · EMBO Molecular Medicine · doi:10.15252/emmm.201707673 · Cited by 200
Cuyvers, E., Bettens, K., Philtjens, S., Langenhove, T. V., Gijselinck, I., van der Zee, J., Engelborghs, S., Vandenbulcke, M., Dongen, J. V., Geerts, N., et al. (2013) · Neurobiology of Aging · doi:10.1016/j.neurobiolaging.2013.09.009 · Cited by 185
TREM2 deficiency reduces the efficacy of immunotherapeutic amyloid clearance
Xiang, X., Werner, G., Bohrmann, B., Liesz, A., Mazaheri, F., Capell, A., Feederle, R., Knuesel, I., Kleinberger, G., & Haass, C. (2016) · EMBO Molecular Medicine · doi:10.15252/emmm.201606370 · Cited by 183
Self-citationFeuerbach, D., Schindler, P. A., Barske, C., Joller, S., Beng-Louka, E., Worringer, K. A., Kommineni, S., Kaykas, A., Ho, D. J., Ye, C., et al. (2017) · Neuroscience Letters · doi:10.1016/j.neulet.2017.09.034 · Cited by 179
Heterozygous TREM2 mutations in frontotemporal dementia
Borroni, B., Ferrari, F., Galimberti, D., Nacmias, B., Barone, C., Bagnoli, S., Fenoglio, C., Piaceri, I., Archetti, S., Bonvicini, C., et al. (2014) · Neurobiology of Aging · doi:10.1016/j.neurobiolaging.2013.09.017 · Cited by 173
Guerreiro, R., Bilgic, B., Guven, G., Brás, J., Rohrer, J., Lohmann, E., Hanagasi, H., Gurvit, H., & Emre, M. (2013) · Neurobiology of Aging · doi:10.1016/j.neurobiolaging.2013.06.005 · Cited by 158
Lue, L., Schmitz, C. T., Serrano, G., Sue, L. I., Beach, T. G., & Walker, D. G. (2015) · Brain Pathology · doi:10.1111/bpa.12190 · Cited by 154
TREM2 is associated with increased risk for Alzheimer’s disease in African Americans
Jin, S. C., Carrasquillo, M. M., Benitez, B. A., Skorupa, T., Carrell, D., Patel, D., Lincoln, S., Krishnan, S., Kachadoorian, M., Reitz, C., et al. (2015) · Molecular Neurodegeneration · doi:10.1186/s13024-015-0016-9 · Cited by 153
Self-citationCerebrospinal fluid soluble TREM2 in aging and Alzheimer’s disease
Henjum, K., Almdahl, I. S., Årskog, V., Minthon, L., Hansson, O., Fladby, T., & Nilsson, L. N. G. (2016) · Alzheimer s Research & Therapy · doi:10.1186/s13195-016-0182-1 · Cited by 145
Mild cognitive impairment with suspected nonamyloid pathology (SNAP): Prediction of progression
Caroli, A., Prestia, A., Galluzzi, S., Ferrari, C., van der Flier, W. M., Ossenkoppele, R., Van Berckel, B., Barkhof, F., Teunissen, C., Wall, A. E., et al. (2015) · Neurology · doi:10.1212/wnl.0000000000001209 · Cited by 142
Self-citationA rare coding variant in TREM2 increases risk for Alzheimer's disease in Han Chinese
Jiang, T., Tan, L., Chen, Q., Tan, M.-S., Zhou, J.-S., Zhu, X.-C., Lu, H., Wang, H.-F., Zhang, Y.-D., & Yu, J.-T. (2016) · Neurobiology of Aging · doi:10.1016/j.neurobiolaging.2016.02.023 · Cited by 110
Roussos, P., Katsel, P., Fam, P., Tan, W., Purohit, D. P., & Haroutunian, V. (2015) · Alzheimer's & Dementia · doi:10.1016/j.jalz.2014.10.013 · Cited by 103
Soluble TREM2 changes during the clinical course of Alzheimer’s disease: A meta-analysis
Liu, D., Cao, B., Zhao, Y., Huang, H., McIntyre, R. S., Rosenblat, J. D., & Zhou, H. (2018) · Neuroscience Letters · doi:10.1016/j.neulet.2018.08.038 · Cited by 88
Brendel, M., Kleinberger, G., Probst, F., Jaworska, A., Overhoff, F., Blume, T., Albert, N. L., Carlsen, J., Lindner, S., Gildehaus, F. J., et al. (2017) · Frontiers in Aging Neuroscience · doi:10.3389/fnagi.2017.00008 · Cited by 66
Self-citationInvestigation of the role of rare TREM2 variants in frontotemporal dementia subtypes
Thelen, M., Razquín, C., Hernández, I., Gorostidi, A., Sánchez‐Valle, R., Ortega‐Cubero, S., Wolfsgruber, S., Drichel, D., Fließbach, K., Duenkel, T., et al. (2014) · Neurobiology of Aging · doi:10.1016/j.neurobiolaging.2014.06.018 · Cited by 53
Suspected non-Alzheimer's pathology – Is it non-Alzheimer's or non-amyloid?
Dani, M., Brooks, D. J., & Edison, P. (2017) · Ageing Research Reviews · doi:10.1016/j.arr.2017.02.003 · Cited by 50
TREM2 variants and risk of Alzheimer’s disease: a meta-analysis
Lu, Y., Liu, W., & Wang, X. (2015) · Neurological Sciences · doi:10.1007/s10072-015-2274-2 · Cited by 37
Cited by
Sorted by citations
The Physiology, Pathology, and Potential Therapeutic Applications of the TREM2 Signaling Pathway
Deczkowska, A., Weiner, A., & Amit, I. (2020) · Cell · doi:10.1016/j.cell.2020.05.003 · Cited by 648
Immune Signaling in Neurodegeneration
Hammond, T. R., Marsh, S. E., & Stevens, B. (2019) · Immunity · doi:10.1016/j.immuni.2019.03.016 · Cited by 336
Enhancing protective microglial activities with a dual function TREM2 antibody to the stalk region
Schlepckow, K., Monroe, K. M., Kleinberger, G., Cantuti‐Castelvetri, L., Parhizkar, S., Xia, D., Willem, M., Werner, G., Pettkus, N., Brunner, B., et al. (2020) · EMBO Molecular Medicine · doi:10.15252/emmm.201911227 · Cited by 324
Self-citationMicroglia in Alzheimer’s disease: pathogenesis, mechanisms, and therapeutic potentials
Miao, J., Ma, H., Yang, Y., Liao, Y., Lin, C., Zheng, J., Yu, M., & Lan, J. (2023) · Frontiers in Aging Neuroscience · doi:10.3389/fnagi.2023.1201982 · Cited by 293
Milà‐Alomà, M., Salvadó, G., Gispert, J. D., Vilor‐Tejedor, N., Grau‐Rivera, O., Sala‐Vila, A., Sánchez‐Benavides, G., Arenaza‐Urquijo, E. M., Crous‐Bou, M., González‐de‐Echávarri, J. M., et al. (2020) · Alzheimer's & Dementia · doi:10.1002/alz.12131 · Cited by 241
Self-citation
Metadata
- Authors
- Initiative, F. T. A. D. N., Suárez-Calvet, M., Morenas-Rodríguez, E., Kleinberger, G., Schlepckow, K., Araque Caballero, M. Á., Franzmeier, N., Capell, A., Fellerer, K., Nuscher, B., Eren, E., Levin, J., Deming, Y., Piccio, L., Karch, C. M., Cruchaga, C., Shaw, L. M., Trojanowski, J. Q., Weiner, M., Ewers, M., & Haass, C.
- Affiliations
- German Center for Neurodegenerative Diseases (DE)
- Institut für Schlaganfall- und Demenzforschung (DE)
- Ludwig-Maximilians-Universität München (DE)
- Dokuz Eylül University (TR)
- Washington University in St. Louis (US)
- University of Pennsylvania (US)
- University of California, San Francisco (US)
- Munich Cluster for Systems Neurology (DE)
- Corresponding author
- Haass, Christian
- ORCID
- Venue
- Molecular Neurodegeneration
- Published
- 2019-01-10
- Volume
- 14
- Issue
- 1
- Pages
- 1-1
- ISSN
- 1750-1326 (ISSN-L)
- PMC
- PMC6327425
- OpenAlex
- W2911811341
- Cited by
- 347
- References
- 57
- Citations by year
- 2026: 31 · 2025: 56 · 2024: 67 · 2023: 52 · 2022: 49 · 2021: 35 · 2020: 42 · 2019: 13
- FWCI
- 23.84
- Type
- journal article
- Language
- en
- Open access
- gold
- doi.org
- Locations
- Molecular Neurodegeneration (publishedVersion, cc-by)
- Europe PMC (PubMed Central) (publishedVersion, cc-by)
- PubMed Central (publishedVersion, cc-by)
- PubMed (publishedVersion)
- Digital Commons@Becker (Washington University School of Medicine) (submittedVersion, cc-by)
- Dipòsit Digital de Documents de la UAB (Universitat Autònoma de Barcelona) (submittedVersion, cc-by)
- DIGITAL.CSIC (Spanish National Research Council (CSIC)) (submittedVersion, cc-by)
- LA Referencia (Red Federada de Repositorios Institucionales de Publicaciones Científicas) (submittedVersion, cc-by)
- DOAJ (DOAJ: Directory of Open Access Journals) (submittedVersion)
- Open access LMU (Ludwid Maxmilian's Universitat Munchen) (submittedVersion, cc-by)
- eScholarship (California Digital Library) (submittedVersion, cc-by)
- DZNE Pub (submittedVersion, other-oa)
- Funders
- Deutsche Forschungsgemeinschaft (EXC 1010SyNergy, HA1737/16-1)
- Association for Frontotemporal Degeneration (-)
- National Institutes of Health (R01AG044546, RF1AG053303, RF1AG058501, and U01AG058922)
- Fondazione Italiana Sclerosi Multipla (FISM 2017/R/20)
- Instituto de Salud Carlos III (-)
- H2020 Marie Skłodowska-Curie Actions (752310)
- Topics
- Life Sciences › Neuroscience › Cellular and Molecular Neuroscience › Alzheimer's disease research and treatments
- Life Sciences › Neuroscience › Neurology › Neuroinflammation and Neurodegeneration Mechanisms
- Health Sciences › Medicine › Psychiatry and Mental health › Dementia and Cognitive Impairment Research
- Keywords
- soluble TREM2, Alzheimer's disease, cerebrospinal fluid biomarkers, tau phosphorylation, total tau, amyloid-beta pathology, neurodegeneration, microglia, Clinical Dementia Rating, asymptomatic Alzheimer's disease, amyloid hypothesis
- MeSH terms
- Aged, Aged, 80 and over, Alzheimer Disease, Cross-Sectional Studies, Female, Humans, Male, Membrane Glycoproteins, Middle Aged, Nerve Degeneration, Receptors, Immunologic, Biomarkers, Amyloid beta-Peptides, tau Proteins
About these checks
Registry, retraction, Cites and statistics results are computed, not judged, with one exception: a printed reference that no index lists is read once by a model before it counts as a citation error. Claims are extracted by a model and kept only when their quote appears verbatim in the text; each cited source is then checked, with a model’s help, for whether it says what the claim relies on. Those verdicts can be wrong — read the claim’s quote and the cited source before relying on one.
Statistics and arithmetic are recomputed, not judged.
Confidence bands are shown only for fields calibrated on our annotated test set. None is calibrated yet, so no band is shown.
What counts as a claim ›How we measure confidence ›How we check this ›
Are you an author, or do you see a problem with this page? Request a review
