

The DOI matches its Crossref record; 46 of the 46 references it cites were found in a registry or an index.
Peptide-based PROTAC degrader of FOXM1 suppresses cancer and decreases GLUT1 and PD-L1 expression
Open accessAbstract
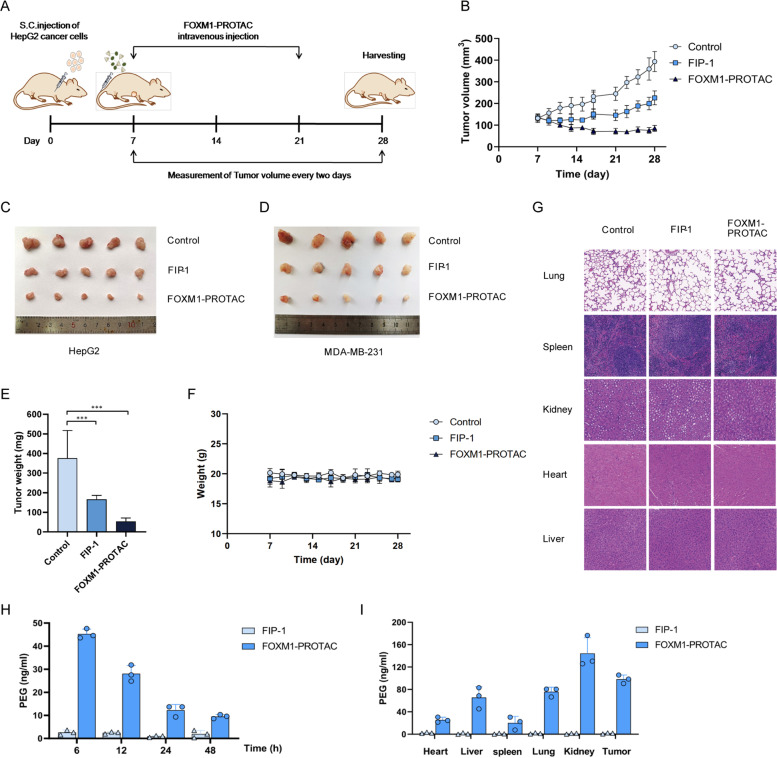
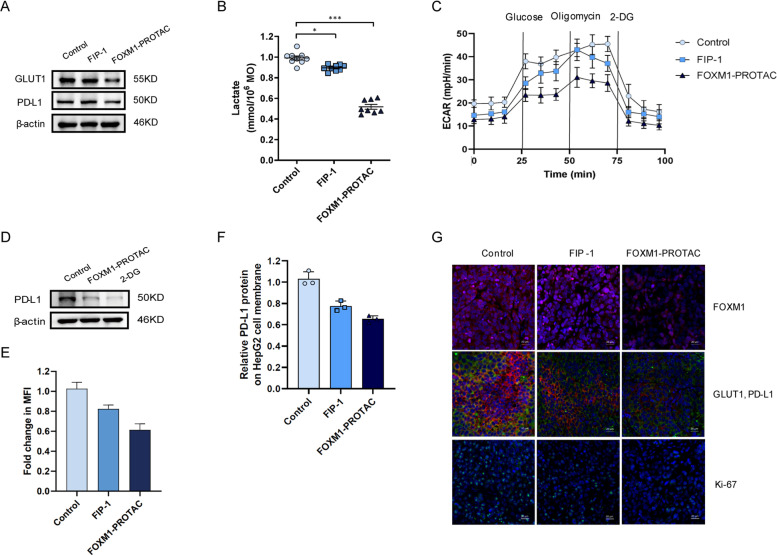
Background: Peptide proteolysis-targeting chimeras (p-PROTACs) with advantages of high specificity and low toxicity have emerged as a powerful technology of targeted protein degradation for biomedical applications. FOXM1, a proliferation-associated transcription factor, is overexpressed in a variety of human tumors as a key driver of tumorigenesis and cancer progression, and is a potential anticancer therapeutic target. However, FOXM1-targeting p-PROTACs has not been researched. Methods: Here, we first analyzed the expression of FOXM1, GLUT1 and PD-L1 in liver cancer through database and clinical samples of patients. FOXM1-targeting peptides, selected by screening phage display library, are verified its targeting effect by immunofluorescence and CCK-8 test. The novel p-PROTAC degrader of FOXM1 is chemically synthesis, named FOXM1-PROTAC, by linking a FOXM1-binding antagonistic peptide, with the E3 ubiquitin ligase recruitment ligand Pomalidomide and with the cell membrane penetrating peptide TAT. Its degradation effect on FOXM1 was detected by Western blotting, qPCR, and we verified its effect on the behavior of cancer cells by flow cytometry, scratch assay, and Transwell in vitro. The tumor xenografted mice model was used for evaluating FOXM1-PROTAC therapeutic response in vivo. Finally, we detected the expression of GLUT1 and PD-L1 after FOXM1-PROTAC degraded FOXM1 by using Western Blotting and hippocampal detectors and dual immunofluorescence. Results: We found that the novel FOXM1-PROTAC efficiently entered cells and induced degradation of FOXM1 protein, which strongly inhibits viability as well as migration and invasion in various cancer cell lines, and suppressed tumor growth in HepG2 and MDA-MB-231 cells xenograft mouse models, without detected toxicity in normal tissues. Meanwhile, FOXM1-PROTAC decreased the cancer cells glucose metabolism via downregulating the protein expression levels of glucose transporter GLUT1 and the immune checkpoint PD-L1, which suggests involvement of FOXM1 in cancer cell metabolism and immune regulation. Conclusions: Our results indicate that biologically targeted degradation of FOXM1 is an attractive therapeutic strategy, and antagonist peptide-containing FOXM1-PROTACs as both degrader and inhibitor of FOXM1 could be developed as a safe and promising drug for FOXM1-overexpressed cancer therapy.
Overview
The claims and statistics of this paper haven’t been checked yet.
Run the check — free, no account needed. It reads the open-access text and checks the sources it cites.
Integrity signals
Registry
Cites
Statistics
Figures
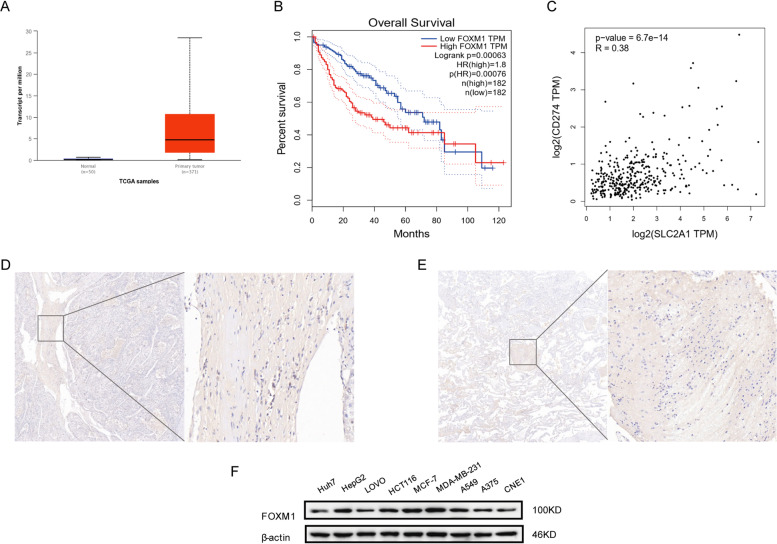
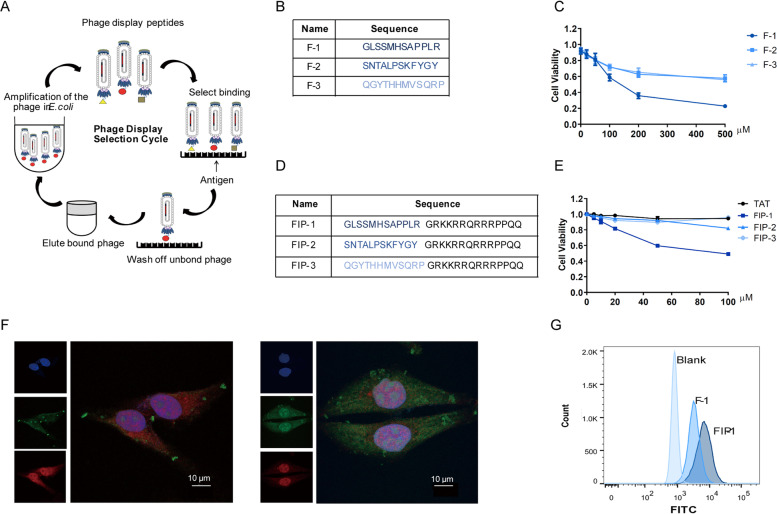
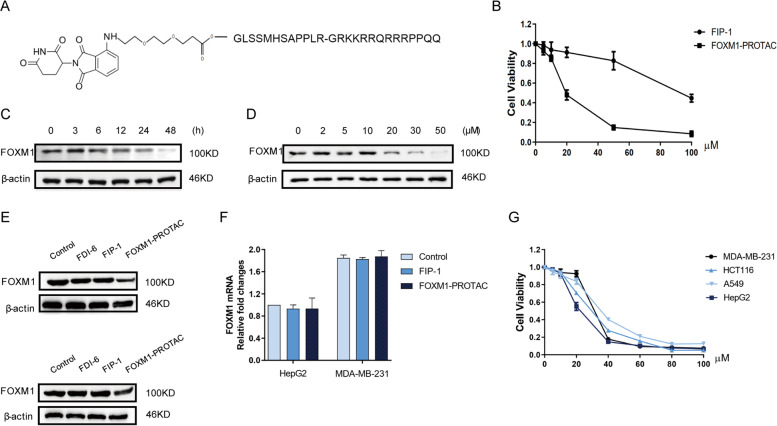
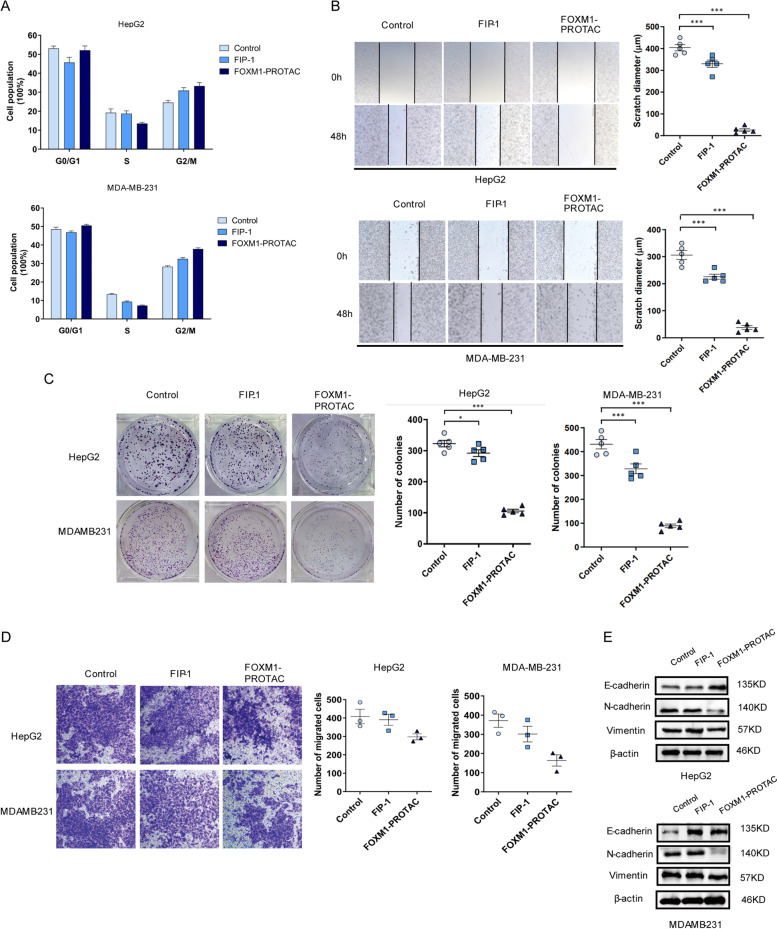
Verification
Claims the paper makes
The claims and statistics of this paper haven’t been checked yet.
Run the check — free, no account needed. It reads the open-access text and checks the sources it cites.
Claims other papers make about this one
Each is checked against this paper’s own text: does it say what the citing paper says it does?
In the citing paper
“Developing small molecule inhibitors that directly target FoxM1 has proven challenging due to the absence of a well-defined binding site or large interaction interface.”
From Recent advances in targeting the “undruggable” proteins: from drug discovery to clinical trials (2023) · cites this paper as [513]
Self-check
Percentages, sums and reported differences re-computed from the paper’s own numbers.
The self-check needs the paper’s full text.
Citations
Cites
Trends in peptide drug discovery
Muttenthaler, M., King, G. F., Adams, D. J., & Alewood, P. F. (2021) · Nature Reviews Drug Discovery · doi:10.1038/s41573-020-00135-8 · Cited by 2,074
Ubiquitin ligases: structure, function, and regulation
Zheng, N., & Shabek, N. (2017) · Annual Review of Biochemistry · doi:10.1146/annurev-biochem-060815-014922 · Cited by 1,499
Proteolysis-Targeting Chimeras as Therapeutics and Tools for Biological Discovery
Burslem, G. M., & Crews, C. M. (2020) · Cell · doi:10.1016/j.cell.2019.11.031 · Cited by 1,079
Cell-Penetrating Peptides: Design, Synthesis, and Applications
Copolovici, D. M., Langel, K., Eriste, E., & Langel, Ü. (2014) · ACS Nano · doi:10.1021/nn4057269 · Cited by 997
PROTAC-induced BET protein degradation as a therapy for castration-resistant prostate cancer
Raina, K., Lu, J., Qian, Y., Altieri, M., Gordon, D., Rossi, A. M. K., Wang, J., Chen, X., Dong, H., Siu, K., et al. (2016) · Proceedings of the National Academy of Sciences · doi:10.1073/pnas.1521738113 · Cited by 852
A selective BCL-XL PROTAC degrader achieves safe and potent antitumor activity
Khan, S., Zhang, X., Lv, D., Zhang, Q., He, Y., Zhang, P., Liu, X., Thummuri, D., Yuan, Y., Wiegand, J. S., et al. (2019) · Nature Medicine · doi:10.1038/s41591-019-0668-z · Cited by 688
PROTACs: great opportunities for academia and industry
Sun, X., Gao, H., Yang, Y., He, M., Wu, Y., Song, Y.-G., Tong, Y., & Rao, Y. (2019) · Signal Transduction and Targeted Therapy · doi:10.1038/s41392-019-0101-6 · Cited by 663
Targeted protein degradation by PROTACs
Neklesa, T. K., Winkler, J. D., & Crews, C. M. (2017) · Pharmacology & Therapeutics · doi:10.1016/j.pharmthera.2017.02.027 · Cited by 599
Targeted protein degradation: elements of PROTAC design
Paiva, S.-L., & Crews, C. M. (2019) · Current Opinion in Chemical Biology · doi:10.1016/j.cbpa.2019.02.022 · Cited by 598
Cotton, A. D., Nguyen, D. P., Gramespacher, J. A., Seiple, I. B., & Wells, J. A. (2021) · Journal of the American Chemical Society · doi:10.1021/jacs.0c10008 · Cited by 551
Anders, L., Ke, N., Hydbring, P., Choi, Y. J., Widlund, H. R., Chick, J. M., Zhai, H., Vidal, M., Gygi, S. P., Braun, P., et al. (2011) · Cancer Cell · doi:10.1016/j.ccr.2011.10.001 · Cited by 543
Internalization mechanisms of cell-penetrating peptides
Ruseska, I., & Zimmer, A. (2020) · Beilstein Journal of Nanotechnology · doi:10.3762/bjnano.11.10 · Cited by 452
Targeted Degradation of Oncogenic KRAS G12C by VHL-Recruiting PROTACs
Bond, M. J., Chu, L., Nalawansha, D. A., Li, K., & Crews, C. M. (2020) · ACS Central Science · doi:10.1021/acscentsci.0c00411 · Cited by 450
Buhimschi, A. D., Armstrong, H. A., Toure, M., Jaime-Figueroa, S., Chen, T. L., Lehman, A. M., Woyach, J. A., Johnson, A. J., Byrd, J. C., & Crews, C. M. (2018) · Biochemistry · doi:10.1021/acs.biochem.8b00391 · Cited by 394
GLUT1 Expression Is Increased in Hepatocellular Carcinoma and Promotes Tumorigenesis
Amann, T., Maegdefrau, U., Hartmann, A., Agaimy, A., Marienhagen, J., Weiß, T. S., Stoeltzing, O., Warnecke, C., Schölmerich, J., Oefner, P. J., et al. (2009) · American Journal Of Pathology · doi:10.2353/ajpath.2009.080596 · Cited by 370
FOXM1, a typical proliferation-associated transcription factor
Wierstra, I., & Alves, J. (2007) · Biological Chemistry · doi:10.1515/bc.2007.159 · Cited by 313
Light-induced control of protein destruction by opto-PROTAC
Liu, J., Chen, H., Ma, L., He, Z., Wang, D., Liu, Y., Lin, Q., Zhang, T., Gray, N. S., Kanıskan, H. Ü., et al. (2020) · Science Advances · doi:10.1126/sciadv.aay5154 · Cited by 310
Impact of linker length on the activity of PROTACs
Cyrus, K., Wehenkel, M., Choi, E.-Y., Han, H.-J., Lee, H., Swanson, H., & Kim, K.-B. (2010) · Molecular BioSystems · doi:10.1039/c0mb00074d · Cited by 232
E3 Ligase Ligands in Successful PROTACs: An Overview of Syntheses and Linker Attachment Points
Bricelj, A., Steinebach, C., Kuchta, R. D., Gütschow, M., & Sosič, I. (2021) · Frontiers in Chemistry · doi:10.3389/fchem.2021.707317 · Cited by 232
Suppression of the FOXM1 transcriptional programme via novel small molecule inhibition
Gormally, M. V., Dexheimer, T. S., Marsico, G., Sanders, D. A., Lowe, C. E., Matak‐Vinković, D., Michael, S., Jadhav, A., Rai, G., Maloney, D. J., et al. (2014) · Nature Communications · doi:10.1038/ncomms6165 · Cited by 223
PROTACs: A novel strategy for cancer therapy
Liu, J., Ma, J., Liu, Y., Xia, J., Li, Y., Wang, Z. P., & Wei, W. (2020) · Seminars in Cancer Biology · doi:10.1016/j.semcancer.2020.02.006 · Cited by 186
Over‐expression of FoxM1 stimulates cyclin B1 expression
Leung, T. W. C., Sau-wah, S. L., Tsang, A. C. C., Tong, C. S. W., Ching, J. C. Y., Leung, W. Y., Gimlich, R. L., Wong, G. G., & Yao, K. (2001) · FEBS Letters · doi:10.1016/s0014-5793(01)02915-5 · Cited by 180
Targeted degradation of the enhancer lysine acetyltransferases CBP and p300
Vannam, R., Sayilgan, J., Ojeda, S., Karakyriakou, B., Hu, E., Kreuzer, J., Morris, R., Herrera Lopez, X. I., Rai, S., Haas, W., et al. (2021) · Cell Chemical Biology · doi:10.1016/j.chembiol.2020.12.004 · Cited by 177
The prognostic value of GLUT1 in cancers: a systematic review and meta-analysis
Yu, M., Yongzhi, H., Chen, S., Luo, X., Lin, Y., Zhou, Y., Jin, H., Hou, B., Deng, Y., Tu, L., et al. (2017) · Oncotarget · doi:10.18632/oncotarget.17445 · Cited by 167
The peptide PROTAC modality: a novel strategy for targeted protein ubiquitination
Jin, J., Wu, Y., Chen, J., Shen, Y., Zhang, L., Zhang, H., Chen, L., Yuan, H., Chen, H., Zhang, W., et al. (2020) · Theranostics · doi:10.7150/thno.46985 · Cited by 148
Zhang, H., Zhao, H., Xi, X.-X., Liu, Y., Xin, M., Mao, S., Zhang, J., Lu, A., & Zhang, S. (2020) · European Journal of Medicinal Chemistry · doi:10.1016/j.ejmech.2020.112061 · Cited by 131
Development of Stabilized Peptide-Based PROTACs against Estrogen Receptor α
Jiang, Y., Deng, Q. W., Zhao, H., Xie, M., Chen, L., Yin, F., Qin, X., Zheng, W., Zhao, Y. J., & Li, Z. (2017) · ACS Chemical Biology · doi:10.1021/acschembio.7b00985 · Cited by 125
Yang, C., Chen, H., Tan, G., Gao, W., Cheng, L., Jiang, X., Li, Y., & Tan, Y. (2013) · Cancer Letters · doi:10.1016/j.canlet.2013.07.004 · Cited by 115
Nakamura, S., Hirano, I., Okinaka, K., Takemura, T., Yokota, D., Ono, T., Shigeno, K., SHIBATA, K., Fujisawa, S., & Ohnishi, K. (2010) · Carcinogenesis · doi:10.1093/carcin/bgq185 · Cited by 105
Proliferative potential and resistance to immune checkpoint blockade in lung cancer patients
Pabla, S., Conroy, J. M., Nesline, M., Glenn, S. T., Papanicolau‐Sengos, A., Burgher, B., Hagen, J., Giamo, V., Andreas, J., Lenzo, F. L., et al. (2019) · Journal for ImmunoTherapy of Cancer · doi:10.1186/s40425-019-0506-3 · Cited by 95
Kopanja, D., Pandey, A., Kiefer, M. M., Wang, Z., Chandan, N., Carr, J. R., Franks, R. R., Yu, D., Guzman, G., Maker, A. V., et al. (2015) · Journal of Hepatology · doi:10.1016/j.jhep.2015.03.023 · Cited by 94
Zhang, J., Zhou, Q., Xie, K., Liang Cheng, C., Peng, S., Xie, R., Liu, L., Zhang, Y., Dong, W., Han, J., et al. (2021) · Journal of Experimental & Clinical Cancer Research · doi:10.1186/s13046-021-01989-5 · Cited by 87
Prognostic value of FOXM1 in solid tumors: a systematic review and meta-analysis
Li, L., Yu, Q., Yu, Q., Li, L., & Wu, P. (2017) · Oncotarget · doi:10.18632/oncotarget.15764 · Cited by 84
FOXM1 Promotes Lung Adenocarcinoma Invasion and Metastasis by Upregulating SNAIL
Wei, P., Zhang, N., Wang, Y., Li, D., Wang, L., Sun, X., Shen, C., Yang, Y., Zhou, X., & Du, X. (2015) · International Journal of Biological Sciences · doi:10.7150/ijbs.10634 · Cited by 76
Wang, Y., Yun, Y., Wu, B., Wen, L., Wen, M., Yang, H., Zhao, L., Liu, W., Huang, S., Wen, N., et al. (2016) · Oncotarget · doi:10.18632/oncotarget.10103 · Cited by 73
Tang, H.-M. (2011) · Oncology Reports · doi:10.3892/or.2011.1230 · Cited by 63
Discovery of a PROTAC targeting ALK with in vivo activity
Yan, G., Zhong, X.-X., Lin, Y., Pu, C., Shan, H., Lan, S., Zhou, M., Hou, X., Yang, J., & Li, R. (2021) · European Journal of Medicinal Chemistry · doi:10.1016/j.ejmech.2020.113150 · Cited by 59
A gene expression signature of FOXM1 predicts the prognosis of hepatocellular carcinoma
Song, B.-N., & Chu, I. (2018) · Experimental & Molecular Medicine · doi:10.1038/emm.2017.159 · Cited by 51
Shang, R., Pu, M., Li, Y., & Wang, D. (2017) · Oncology Reports · doi:10.3892/or.2017.5472 · Cited by 47
Roles of FoxM1 in cell regulation and breast cancer targeting therapy
Song, X., Kenston, S. S. F., Zhao, J., Yang, D., & Gu, Y. (2017) · Medical Oncology · doi:10.1007/s12032-017-0888-3 · Cited by 45
FOXM1 Regulated by ERK Pathway MediatesTGF-1-Induced EMT in NSCLC
Kong, F., Zhu, Y., Yuan, H.-H., Wang, J., Zhao, M., Gong, X., Liu, F., Zhang, W., Wang, C., & Jiang, B. (2014) · Oncology Research Featuring Preclinical and Clinical Cancer Therapeutics · doi:10.3727/096504014x14078436004987 · Cited by 33
Yang, K., Jiang, B., Lu, Y., Shu, Q., Zhai, P., Zhi, Q., & Li, Q. (2019) · Cancer Management and Research · doi:10.2147/cmar.s185438 · Cited by 32
Peptide-Based PROTAC: The Predator of Pathological Proteins
Au, Y. Z., Wang, T., Sigua, L. H., & Qi, J. (2020) · Cell Chemical Biology · doi:10.1016/j.chembiol.2020.06.002 · Cited by 28
Koh, Y. W., Han, J.-H., Park, S. Y., Yoon, D. H., Suh, C., & Huh, J. (2017) · Journal of Pathology and Translational Medicine · doi:10.4132/jptm.2016.11.03 · Cited by 21
Detarya, M., Thaenkaew, S., Seubwai, W., Indramanee, S., Phoomak, C., Saengboonmee, C., Wongkham, S., & Wongkham, C. (2021) · Life Sciences · doi:10.1016/j.lfs.2021.119114 · Cited by 20
Kyuno, T., Kohno, T., Konno, T., Yamaguchi, H., Kyuno, D., Imamura, M., Kimura, Y., Kojima, T., & Takemasa, I. (2020) · Pancreas · doi:10.1097/mpa.0000000000001485 · Cited by 11
Cited by
Sorted by citations
Recent advances in targeting the “undruggable” proteins: from drug discovery to clinical trials
Xie, X., Yu, T., Li, X., Zhang, N., Foster, L. J., Peng, C., Huang, W., & He, G. (2023) · Signal Transduction and Targeted Therapy · doi:10.1038/s41392-023-01589-z · Cited by 396
Chinnadurai, R. K., Khan, N., Meghwanshi, G. K., Ponne, S., Althobiti, M. M., & Kumar, R. (2023) · Biomedicine & Pharmacotherapy · doi:10.1016/j.biopha.2023.114996 · Cited by 144
FOXM1: A small fox that makes more tracks for cancer progression and metastasis
Khan, M. A., Κhan, P., Ahmad, A., Fatima, M., & Nasser, M. W. (2023) · Seminars in Cancer Biology · doi:10.1016/j.semcancer.2023.03.007 · Cited by 131
Peptide-functionalized, -assembled and -loaded nanoparticles in cancer therapy
Dai, J., Ashrafizadeh, M., Aref, A. R., Sethi, G., & Ertaş, Y. N. (2024) · Drug Discovery Today · doi:10.1016/j.drudis.2024.103981 · Cited by 122
Targeting the undruggables—the power of protein degraders
Zhang, C., Liu, Y., Li, G., Yang, Z., Han, C., Sun, X., Sheng, C., Ding, K., & Rao, Y. (2024) · 中国科学通报:英文版 · doi:10.1016/j.scib.2024.03.056 · Cited by 112
Metadata
- Authors
- Wang, K., Dai, X., Yu, A., Feng, C., Liu, K., & Huang, L.
- Affiliations
- Tsinghua–Berkeley Shenzhen Institute (CN)
- Corresponding author
- Huang, Laiqiang
- Venue
- Journal of Experimental & Clinical Cancer Research
- Published
- 2022-09-29
- Volume
- 41
- Issue
- 1
- Pages
- 289-289
- ISSN
- 0392-9078 (ISSN-L)
- 1756-9966
- PMC
- PMC9520815
- OpenAlex
- W4297521487
- Cited by
- 115
- References
- 46
- Citations by year
- 2026: 28 · 2025: 40 · 2024: 26 · 2023: 19 · 2022: 2
- FWCI
- 7.10
- Type
- journal article
- Language
- en
- Open access
- gold
- doi.org
- Locations
- Journal of Experimental & Clinical Cancer Research (publishedVersion, cc-by)
- PubMed Central (publishedVersion, cc-by)
- PubMed (publishedVersion)
- DOAJ (DOAJ: Directory of Open Access Journals) (submittedVersion, cc-by-sa)
- Funders
- National Natural Science Foundation of China (81872368, 81641051)
- Topics
- Life Sciences › Biochemistry, Genetics and Molecular Biology › Molecular Biology › Protein Degradation and Inhibitors
- Physical Sciences › Chemistry › Organic Chemistry › Chemical Synthesis and Analysis
- Life Sciences › Biochemistry, Genetics and Molecular Biology › Molecular Biology › Ubiquitin and proteasome pathways
- Keywords
- FOXM1, targeted protein degradation, GLUT1, PD-L1, glucose metabolism, cancer immunotherapy, liver cancer, breast cancer, tumor xenografts, pomalidomide, TAT peptide, tumor cell migration and invasion, tumor cell proliferation
- MeSH terms
- Forkhead Box Protein M1, Animals, Glucose, Humans, Ligands, Neoplasms, Ubiquitin-Protein Ligases, Glucose Transporter Type 1, Mice, Cell-Penetrating Peptides, Proteolysis, B7-H1 Antigen
About these checks
Registry, retraction, Cites and statistics results are computed, not judged, with one exception: a printed reference that no index lists is read once by a model before it counts as a citation error. Claims are extracted by a model and kept only when their quote appears verbatim in the text; each cited source is then checked, with a model’s help, for whether it says what the claim relies on. Those verdicts can be wrong — read the claim’s quote and the cited source before relying on one.
Statistics and arithmetic are recomputed, not judged.
Confidence bands are shown only for fields calibrated on our annotated test set. None is calibrated yet, so no band is shown.
What counts as a claim ›How we measure confidence ›How we check this ›
Are you an author, or do you see a problem with this page? Request a review
