

The DOI matches its Crossref record; 41 of the 41 references it cites were found in a registry or an index.
Time in blood glucose range 70 to 140 mg/dl >80% is strongly associated with increased survival in non-diabetic critically ill adults
Open accessAbstract
Introduction: Hyperglycemia, hypoglycemia and increased glucose variability are independently associated with increased risk of death in critically ill adults. The relationship between time in targeted blood glucose range (TIR) and mortality is not well described and may be a factor that has confounded the results of the major interventional trials of intensive insulin therapy. Methods: We conducted a retrospective analysis of prospectively collected data involving 3,297 patients with intensive care unit (ICU) lengths of stay (LOS) of ≥1.0 day who were admitted between 1 January 2009 and 31 December 2013 to a single mixed medical-surgical ICU. We investigated the relationship between TIR 70 to 140 mg/dl with mortality and compared outcomes of non-diabetics (NON) and individuals with diabetes mellitus (DM), including stratifying by TIR above (TIR-hi) and below (TIR-lo) the median value for the NON and DM groups. Results: There were 85,799 blood glucose (BG) values for the NON group and 32,651 for the DM group, and we found that 75.5% and 54.8%, respectively, were between 70 and 140 (P <0.0001). The median (interquartile range) TIR (%) values for the NON and DM groups were 80.6% (61.4% to 94.0%) and 55.0% (35.5% to 71.1%), respectively (P <0.0001). For the NON group, mortality was 8.47% and 15.71% for TIR-hi and TIR-lo, respectively (P <0.0001). For the DM group, mortality was 16.09% and 14.44% for TIR-hi and TIR-lo, respectively (P = NS). We observed similar relationships for the NON group when we stratified by ICU LOS or severity of illness, especially in the most severely ill patients. There was a cumulative interaction of indices of hypoglycemia, hyperglycemia or glucose variability with TIR. Multivariable analysis demonstrated, for the NON group, that TIR-hi was independently associated with increased survival (P =0.0019). For the NON group, the observed-to-expected mortality ratios for TIR-hi and TIR-lo, based on Acute Physiology and Chronic Health Evaluation IV methodology, were 0.53 and 0.78, respectively. In contrast, among those in the DM group, there was no clear relationship between TIR 70 to 140 mg/dl and survival. Conclusions: Independently of ICU LOS and severity of illness, TIR 70 to 140 mg/dl >80% is strongly associated with survival in critically ill patients without diabetes. These findings have implications for the design of clinical protocols for glycemic control in critically ill patients as well for the design of future interventional trials of intensive insulin therapy.
Overview
The claims and statistics of this paper haven’t been checked yet.
Run the check — free, no account needed. It reads the open-access text and checks the sources it cites.
Integrity signals
Registry
Cites
Statistics
Figures
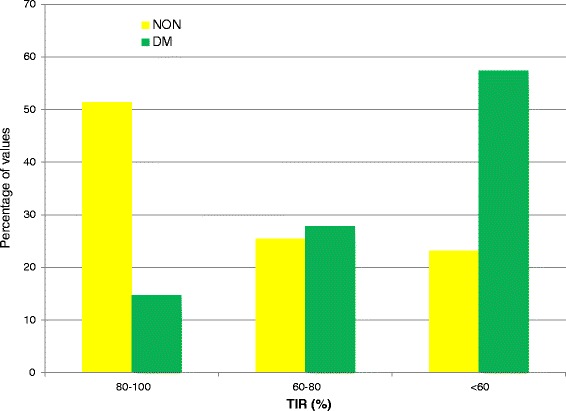
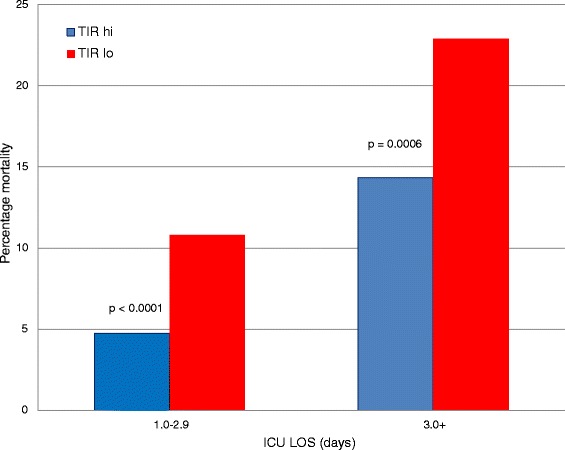
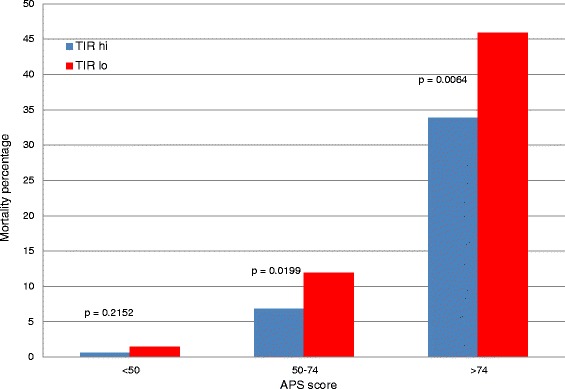
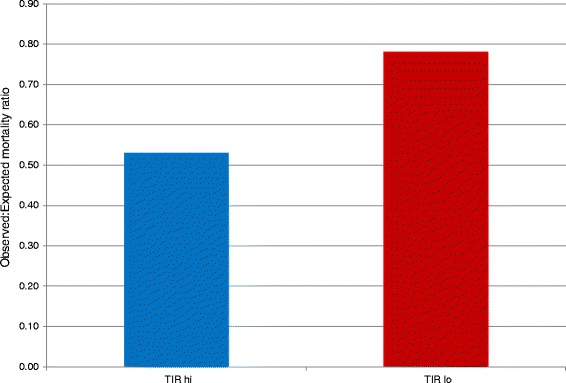
Verification
Claims the paper makes
The claims and statistics of this paper haven’t been checked yet.
Run the check — free, no account needed. It reads the open-access text and checks the sources it cites.
Claims other papers make about this one
Each is checked against this paper’s own text: does it say what the citing paper says it does?
The source backs part of the claim, not all of it — or backs it for a different population, condition or comparison.
In the citing paper
“A number of observational studies confirmed a strong association between severe hyperglycemia (> 180 mg/dl, 10 mmol/l) (355), marked glycemic variability (coefficient of variation > 20%) (356, 357), mild hypoglycemia (< 70 mg/dl, 3.9 mmol/l) (358) and increased mortality.”
From ESPEN guideline on clinical nutrition in the intensive care unit. (2019) · cites this paper as [355]
Experimental — accuracy not yet measured
Self-check
Percentages, sums and reported differences re-computed from the paper’s own numbers.
The self-check needs the paper’s full text.
Citations
Cites
Intensive insulin therapy in critically ill patients.
Van den Berghe, G., Wouters, P., Weekers, F., Verwaest, C., Bruyninckx, F., Schetz, M., Vlasselaers, D., Ferdinande, P., Lauwers, P., & Bouillon, R. (2001) · New England Journal of Medicine · doi:10.1056/nejmoa011300 · Cited by 9,977
Intensive versus Conventional Glucose Control in Critically Ill Patients
(2009) · New England Journal of Medicine · doi:10.1056/nejmoa0810625 · Cited by 5,119
Intensive insulin therapy in the medical ICU
Van den Berghe, G., Wilmer, A., Hermans, G., Meersseman, W., Wouters, P. J., Milants, I., Van Wijngaerden, E., Bobbaers, H., & Bouillon, R. (2006) · New England Journal of Medicine · doi:10.1056/nejmoa052521 · Cited by 3,639
Standards of medical care in diabetes 2010
American Diabetes Association (2010) · Diabetes Care · doi:10.2337/dc10-s011 · Cited by 3,470
Basevi, V., Mario, S. D., Morciano, C., Nonino, F., & Magrini, N. (2011) · Diabetes Care · doi:10.2337/dc11-0174 · Cited by 3,058
Intensive insulin therapy and pentastarch resuscitation in severe sepsis
Brunkhorst, F. M., Engel, C., Bloos, F., Meier-Hellmann, A., Ragaller, M., Weiler, N., Moerer, O., Gruendling, M., Oppert, M., Grond, S., et al. (2008) · New England Journal of Medicine · doi:10.1056/nejmoa070716 · Cited by 2,921
Zimmerman, J. E., Kramer, A. A., McNair, D. S., & Malila, F. M. (2006) · Critical Care Medicine · doi:10.1097/01.ccm.0000215112.84523.f0 · Cited by 1,764
Krinsley, J. S. (2003) · Mayo Clinic Proceedings · doi:10.4065/78.12.1471 · Cited by 1,165
Self-citationHypoglycemia and risk of death in critically ill patients
The NICE-SUGAR Study Investigators (2012) · New England Journal of Medicine · doi:10.1056/nejmoa1204942 · Cited by 1,009
Preiser, J.-C., Devos, P., Ruiz-Santana, S., Mélot, C., Annane, D., Groeneveld, J., Iapichino, G., Leverve, X., Nitenberg, G., Singer, P., et al. (2009) · Intensive Care Medicine · doi:10.1007/s00134-009-1585-2 · Cited by 911
Self-citationVariability of Blood Glucose Concentration and Short-term Mortality in Critically Ill Patients
Egi, M., Bellomo, R., Stachowski, E., French, C., & Hart, G. K. (2006) · Anesthesiology · doi:10.1097/00000542-200608000-00006 · Cited by 853
Glycemic variability: A strong independent predictor of mortality in critically ill patients.
Krinsley, J. S. (2008) · Critical Care Medicine · doi:10.1097/ccm.0b013e31818b38d2 · Cited by 729
Self-citationSevere hypoglycemia in critically ill patients: risk factors and outcomes
Krinsley, J. S., & Grover, A. (2007) · Critical Care Medicine · doi:10.1097/01.ccm.0000282073.98414.4b · Cited by 671
Self-citationHyperglycemia-related mortality in critically ill patients varies with admission diagnosis
Falciglia, M., Freyberg, R. W., Almenoff, P. L., D’Alessio, D. A., & Render, M. L. (2009) · Critical Care Medicine · doi:10.1097/ccm.0b013e3181b083f7 · Cited by 576
Hypoglycemia and outcome in critically ill patients
Egi, M., Bellomo, R., Stachowski, E., French, C. J., Hart, G. K., Taori, G., Hegarty, C., & Bailey, M. (2010) · Mayo Clinic Proceedings · doi:10.4065/mcp.2009.0394 · Cited by 432
Reliability of point-of-care testing for glucose measurement in critically ill adults*
Kanji, S., Buffie, J., Hutton, B., Bunting, P. S., Singh, A., McDonald, K. B., Fergusson, D. A., McIntyre, L., & Hébert, P. C. (2005) · Critical Care Medicine · doi:10.1097/01.ccm.0000189939.10881.60 · Cited by 393
Krinsley, J. S., Egi, M., Kiss, A., Devendra, A. N., Schüetz, P., Maurer, P., Schultz, M. J., van Hooijdonk, R. T. M., Kiyoshi, M., Mackenzie, I. M. J., et al. (2013) · Critical Care · doi:10.1186/cc12547 · Cited by 376
Self-citationQaseem, A., Humphrey, L. L., Chou, R., Snow, V., & Shekelle, P. (2011) · Annals of Internal Medicine · doi:10.7326/0003-4819-154-4-201102150-00007 · Cited by 333
Chase, J., Shaw, G. M., Compte, A. L., Lonergan, T., Willacy, M., Wong, X., Lin, J., Lotz, T., Lee, D., & Hann, C. E. (2008) · Critical Care · doi:10.1186/cc6868 · Cited by 264
Dysglycaemia in the critically ill and the interaction of chronic and acute glycaemia with mortality
Plummer, M. P., Bellomo, R., Cousins, C. E., Annink, C. E., Sundararajan, K., Reddi, B. A. J., Raj, J. P., Chapman, M. J., Horowitz, M., & Deane, A. M. (2014) · Intensive Care Medicine · doi:10.1007/s00134-014-3287-7 · Cited by 235
Egi, M., Bellomo, R., Stachowski, E., French, C., Hart, G. K., Taori, G., Hegarty, C., & Bailey, M. (2010) · Critical Care Medicine · doi:10.1097/ccm.0b013e3181feb5ea · Cited by 234
Finfer, S. R., Wernerman, J., Preiser, J., Cass, T., Desaive, T., Hovorka, R., Joseph, J. I., Kosiborod, M., Krinsley, J. S., Mackenzie, I. M. J., et al. (2013) · Critical Care · doi:10.1186/cc12537 · Cited by 216
Self-citationReal-Time Continuous Glucose Monitoring in Critically Ill Patients
Holzinger, U., Warszawska, J. M., Kitzberger, R., Wewalka, M., Miehsler, W., Herkner, H., & Madl, C. (2009) · Diabetes Care · doi:10.2337/dc09-1352 · Cited by 215
Meyfroidt, G., Keenan, D. M., Wang, X., Wouters, P. J., Veldhuis, J. D., & den Berghe, G. V. (2010) · Critical Care Medicine · doi:10.1097/ccm.0b013e3181cf710e · Cited by 201
Mild hypoglycemia is independently associated with increased mortality in the critically ill
Krinsley, J. S., Schultz, M. J., Spronk, P. E., Harmsen, R. E., Houckgeest, F. V. B., van der Sluijs, J. P., Mélot, C., & Preiser, J. (2011) · Critical Care · doi:10.1186/cc10322 · Cited by 181
Self-citationCorstjens, A. M., Ligtenberg, J. J. M., van der Horst, I. C. C., Spanjersberg, R., Lind, J. S. W., Tulleken, J. E., Meertens, J. H. J. M., & Zijlstra, J. G. (2006) · Critical Care · doi:10.1186/cc5048 · Cited by 163
Tight computerized versus conventional glucose control in the ICU: a randomized controlled trial
Kalfon, P., Giraudeau, B., Ichaï, C., Guerrini, A., Bréchot, N., Cinotti, R., Dequin, P., Riu-Poulenc, B., Montravers, P., Annane, D., et al. (2014) · Intensive Care Medicine · doi:10.1007/s00134-013-3189-0 · Cited by 157
Desachy, A., Vuagnat, A., Ghazali, D. A., Baudin, O., Longuet, O., Calvat, S., & Gissot, V. (2008) · Mayo Clinic Proceedings · doi:10.4065/83.4.400 · Cited by 145
Association between intensive care unit-acquired dysglycemia and in-hospital mortality.
Badawi, O., Waite, M. D., Fuhrman, S. A., & Zuckerman, I. H. (2012) · Critical Care Medicine · doi:10.1097/ccm.0b013e3182656ae5 · Cited by 142
Organ failure and tight glycemic control in the SPRINT study
Chase, J. G., Pretty, C. G., Pfeifer, L., Shaw, G. M., Preiser, J., Compte, A. J. L., Lin, J., Hewett, D., Moorhead, K. T., & Desaive, T. (2010) · Critical Care · doi:10.1186/cc9224 · Cited by 133
Self-citationSechterberger, M. K., Bosman, R. J., Straaten, H. M. O., Siegelaar, S. E., Hermanides, J., Hoekstra, J. B. L., & DeVries, J. H. (2013) · Critical Care · doi:10.1186/cc12572 · Cited by 130
International recommendations for glucose control in adult non diabetic critically ill patients
Ichai, C., Preiser, J.-C., (SFAR), F. T. S. F. D.-R., & Société de Réanimation de langue Française (SRLF) and the Experts group (2010) · Critical Care · doi:10.1186/cc9258 · Cited by 127
Self-citationIntensive versus intermediate glucose control in surgical intensive care unit patients
Okabayashi, T., Shima, Y., Sumiyoshi, T., Kozuki, A., Tokumaru, T., Iiyama, T., Sugimoto, T., Kobayashi, M., Yokoyama, M., & Hanazaki, K. (2014) · Diabetes Care · doi:10.2337/dc13-1771 · Cited by 119
LOGIC-Insulin Algorithm–Guided Versus Nurse-Directed Blood Glucose Control During Critical Illness
Herpe, T. V., Mesotten, D., Wouters, P. J., Herbots, J., Voets, E., Buyens, J., Moor, B. D., & den Berghe, G. V. (2012) · Diabetes Care · doi:10.2337/dc12-0584 · Cited by 97
Lanspa, M. J., Dickerson, J., Morris, A. H., Orme, J. F., Holmen, J. R., & Hirshberg, E. L. (2014) · Critical Care · doi:10.1186/cc13851 · Cited by 91
Juneja, R., Roudebush, C. P., Nasraway, S. A., Golas, A. A., Jacobi, J., Carroll, J., Nelson, D., Abad, V. J., & Flanders, S. J. (2009) · Critical Care · doi:10.1186/cc8129 · Cited by 86 · cited 1×
“4% [35].”
Lanspa, M. J., Hirshberg, E. L., Phillips, G. D., Holmen, J. R., Stoddard, G. J., & Orme, J. F. (2012) · CHEST Journal · doi:10.1378/chest.12-2072 · Cited by 69
Signal, M., Compte, A. L., Shaw, G. M., & Chase, J. G. (2012) · Journal of Diabetes Science and Technology · doi:10.1177/193229681200600506 · Cited by 68
Penning, S., Chase, J. G., Preiser, J., Pretty, C. G., Signal, M., Mélot, C., & Desaive, T. (2014) · Journal of Critical Care · doi:10.1016/j.jcrc.2014.01.013 · Cited by 43
Self-citationKrinsley, J. S., Bruns, D. E., & Boyd, J. C. (2015) · Journal of Diabetes Science and Technology · doi:10.1177/1932296814566507 · Cited by 41
Self-citationvan Hooijdonk, R. T. M., Winters, T., Fischer, J., van Dongen-Lases, E. C., Krinsley, J. S., Preiser, J., & Schultz, M. J. (2014) · Annals of Intensive Care · doi:10.1186/2110-5820-4-8 · Cited by 25
Self-citation
Cited by
Sorted by citations
Surviving Sepsis Campaign: International guidelines for management of sepsis and septic shock: 2016.
Rhodes, A., Evans, L. E., Alhazzani, W., Levy, M. M., Antonelli, M., Ferrer, R., Kumar, A., Sevransky, J. E., Sprung, C. L., Nunnally, M. E., et al. (2017) · Intensive Care Medicine · doi:10.1007/s00134-017-4683-6 · Cited by 6,621
Surviving Sepsis Campaign: International guidelines for management of sepsis and septic shock: 2016.
Rhodes, A., Evans, L. E., Alhazzani, W., Levy, M. M., Antonelli, M., Ferrer, R., Kumar, A., Sevransky, J. E., Sprung, C. L., Nunnally, M. E., et al. (2017) · Critical Care Medicine · doi:10.1097/ccm.0000000000002255 · Cited by 3,652
ESPEN guideline on clinical nutrition in the intensive care unit.
Singer, P., Blaser, A. R., Berger, M. M., Alhazzani, W., Calder, P. C., Casaer, M. P., Hiesmayr, M., Mayer, K., Montejo, J. C., Pichard, C., et al. (2019) · Clinical Nutrition · doi:10.1016/j.clnu.2018.08.037 · Cited by 2,904
Self-citationChase, J. G., Preiser, J., Dickson, J. L., Pironet, A., Chiew, Y. S., Pretty, C. G., Shaw, G. M., Benyó, B. I., Möeller, K., Safaei, S., et al. (2018) · BioMedical Engineering OnLine · doi:10.1186/s12938-018-0455-y · Cited by 191
Self-citationMonitoring nutrition in the ICU
Berger, M. M., Reintam-Blaser, A., Calder, P. C., Casaer, M., Hiesmayr, M. J., Mayer, K., Montejo, J. C., Pichard, C., Preiser, J.-C., van Zanten, A. R. H., et al. (2019) · Clinical Nutrition · doi:10.1016/j.clnu.2018.07.009 · Cited by 171
Self-citation
Metadata
- Authors
- Krinsley, J. S., & Preiser, J.-C.
- Affiliations
- Stamford Hospital (US)
- Université Libre de Bruxelles (BE)
- Corresponding author
- Krinsley, James S
- Venue
- Critical Care
- Published
- 2015-12
- Volume
- 19
- Issue
- 1
- Pages
- 179-179
- ISSN
- 1364-8535 (ISSN-L)
- PMC
- PMC4446958
- OpenAlex
- W2072148089
- Cited by
- 174
- References
- 41
- Citations by year
- 2026: 15 · 2025: 10 · 2024: 12 · 2023: 9 · 2022: 13 · 2021: 15 · 2020: 23 · 2019: 25 · 2018: 15 · 2017: 21 · 2016: 10 · 2015: 6
- FWCI
- 15.07
- Type
- journal article
- Language
- en
- Open access
- gold
- doi.org
- Locations
- Critical Care (publishedVersion, cc-by)
- Europe PMC (PubMed Central) (publishedVersion, cc-by)
- PubMed Central (publishedVersion, cc-by)
- PubMed (publishedVersion)
- Dépôt institutionnel de l'Université libre de Bruxelles (Université Libre de Bruxelles) (submittedVersion, other-oa)
- Topics
- Health Sciences › Medicine › Endocrinology, Diabetes and Metabolism › Hyperglycemia and glycemic control in critically ill and hospitalized patients
- Health Sciences › Medicine › Endocrinology, Diabetes and Metabolism › Diabetes Management and Research
- Health Sciences › Medicine › Critical Care and Intensive Care Medicine › Intensive Care Unit Cognitive Disorders
- Keywords
- time in range, blood glucose, critically ill adults, mortality, intensive care unit, diabetes mellitus, non-diabetic patients, hypoglycemia, hyperglycemia, glycemic variability, intensive insulin therapy, disease severity, ICU length of stay, mortality risk factors, intensive care unit admission criteria
- MeSH terms
- Aged, Aged, 80 and over, Blood Chemical Analysis, Blood Glucose, Diabetes Mellitus, Female, Humans, Male, Middle Aged, Prospective Studies, Retrospective Studies, Time Factors, Cohort Studies, Survival Rate, Critical Illness
About these checks
Registry, retraction, Cites and statistics results are computed, not judged, with one exception: a printed reference that no index lists is read once by a model before it counts as a citation error. Claims are extracted by a model and kept only when their quote appears verbatim in the text; each cited source is then checked, with a model’s help, for whether it says what the claim relies on. Those verdicts can be wrong — read the claim’s quote and the cited source before relying on one.
Statistics and arithmetic are recomputed, not judged.
Confidence bands are shown only for fields calibrated on our annotated test set. None is calibrated yet, so no band is shown.
What counts as a claim ›How we measure confidence ›How we check this ›
Are you an author, or do you see a problem with this page? Request a review
