

The DOI matches its Crossref record; 10 of the 10 references it cites were found in a registry or an index.
Tools and best practices for data processing in allelic expression analysis.
Open accessPublished version of a preprint
Abstract
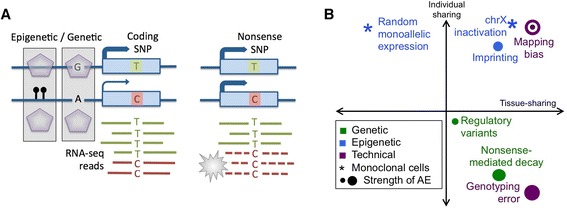
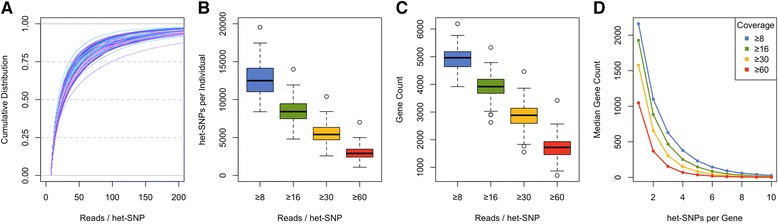
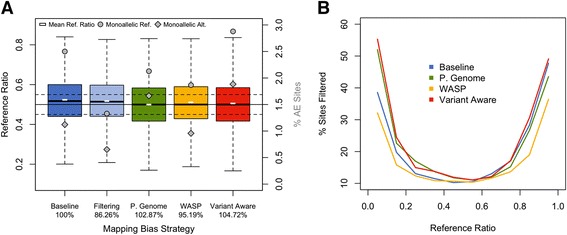
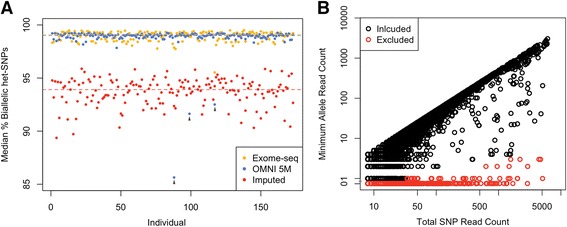
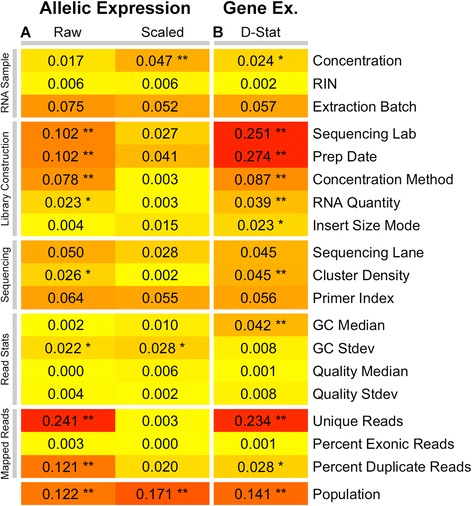
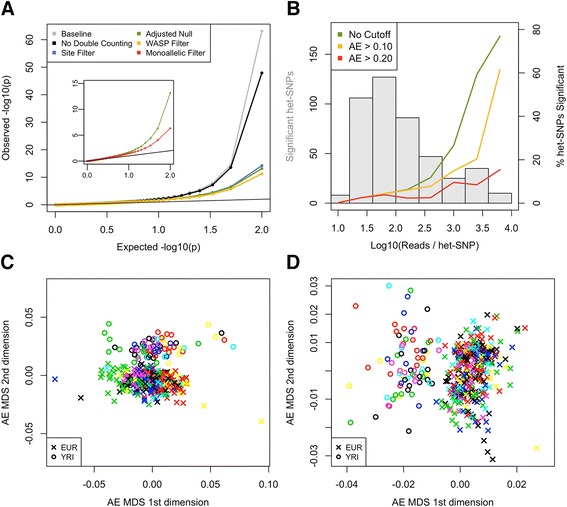
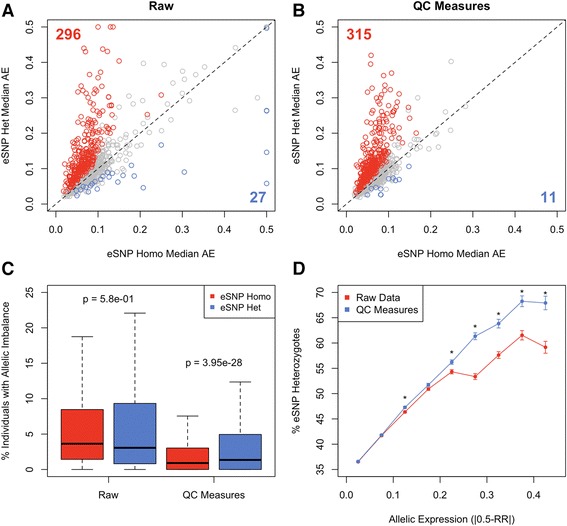
ABSTRACT Allelic expression (AE) analysis has become an important tool for integrating genome and transcriptome data to characterize various biological phenomena such as cis -regulatory variation and nonsense-mediated decay. In this paper, we systematically analyze the properties of AE read count data and technical sources of error, such as low-quality or double-counted RNA-seq reads, genotyping errors, allelic mapping bias, and technical covariates due to sample preparation and sequencing, and variation in total read depth. We provide guidelines for correcting and filtering for such errors, and show that the resulting AE data has extremely low technical noise. Finally, we introduce novel software for high-throughput production of AE data from RNA-sequencing data, implemented in the GATK framework. These improved tools and best practices for AE analysis yield higher quality AE data by reducing technical bias. This provides a practical framework for wider adoption of AE analysis by the genomics community.
Overview
The claims and statistics of this paper haven’t been checked yet.
Run the check — free, no account needed. It reads the open-access text and checks the sources it cites.
Integrity signals
Registry
Cites
Statistics
Figures
Verification
Claims the paper makes
The claims and statistics of this paper haven’t been checked yet.
Run the check — free, no account needed. It reads the open-access text and checks the sources it cites.
Claims other papers make about this one
Each is checked against this paper’s own text: does it say what the citing paper says it does?
The cited source says what the claim attributes to it.
In the citing paper
“The quality of the genotype calls is crucial for allele assignment, so the genotype data needs to be collected carefully and quality control and filtering is required to avoid biases and false positive hits 9.”
From SNPsplit: Allele-specific splitting of alignments between genomes with known SNP genotypes (2016) · cites this paper as [9]
Self-check
Percentages, sums and reported differences re-computed from the paper’s own numbers.
The self-check needs the paper’s full text.
Citations
Cites
Van der Auwera, G. A., Carneiro, M. O., Hartl, C., Poplin, R., del Angel, G., Levy‐Moonshine, A., Jordan, T., Shakir, K., Roazen, D., Thibault, J., et al. (2013) · Current Protocols in Bioinformatics · doi:10.1002/0471250953.bi1110s43 · Cited by 6,687
Self-citationThe Genotype-Tissue Expression (GTEx) pilot analysis: Multitissue gene regulation in humans
The GTEx Consortium, Ardlie, K. G., Deluca, D. S., Segrè, A. V., Sullivan, T. J., Young, T. R., Gelfand, E. T., Trowbridge, C. A., Maller, J. B., Tukiainen, T., et al. (2015) · Science · doi:10.1126/science.1262110 · Cited by 5,062
Self-citationTranscriptome and genome sequencing uncovers functional variation in humans
The Geuvadis Consortium, Lappalainen, T., Sammeth, M., Friedländer, M. R., ‘t Hoen, P. A. C., Monlong, J., Rivas, M. A., Gonzàlez-Porta, M., Kurbatova, N., Griebel, T., et al. (2013) · Nature · doi:10.1038/nature12531 · Cited by 1,888
Self-citationUnderstanding mechanisms underlying human gene expression variation with RNA sequencing
Pickrell, J. K., Marioni, J. C., Pai, A. A., Degner, J. F., Engelhardt, B. E., Nkadori, E., Veyrieras, J.-B., Stephens, M., Gilad, Y., & Pritchard, J. K. (2010) · Nature · doi:10.1038/nature08872 · Cited by 1,256
Transcriptome genetics using second generation sequencing in a Caucasian population
Montgomery, S. B., Sammeth, M., Gutierrez-Arcelus, M., Lach, R. P., Ingle, C., Nisbett, J., Guigo, R., & Dermitzakis, E. T. (2010) · Nature · doi:10.1038/nature08903 · Cited by 797
Effect of read-mapping biases on detecting allele-specific expression from RNA-sequencing data.
Degner, J. F., Marioni, J. C., Pai, A. A., Pickrell, J. K., Nkadori, E., Gilad, Y., & Pritchard, J. K. (2009) · Bioinformatics · doi:10.1093/bioinformatics/btp579 · Cited by 502
Passive and active DNA methylation and the interplay with genetic variation in gene regulation
Gutierrez-Arcelus, M., Lappalainen, T., Montgomery, S. B., Buil, A., Ongen, H., Yurovsky, A., Bryois, J., Giger, T., Romano, L., Planchon, A., et al. (2013) · eLife · doi:10.7554/elife.00523 · Cited by 440
Self-citationEffect of predicted protein-truncating genetic variants on the human transcriptome
Rivas, M. A., Pirinen, M., Conrad, D. F., Lek, M., Tsang, E. K., Karczewski, K. J., Maller, J. B., Kukurba, K. R., DeLuca, D. S., Fromer, M., et al. (2015) · Science · doi:10.1126/science.1261877 · Cited by 313
Self-citationReproducibility of high-throughput mRNA and small RNA sequencing across laboratories
The GEUVADIS Consortium, 't Hoen, P. A. C., Friedländer, M. R., Almlöf, J., Sammeth, M., Pulyakhina, I., Anvar, S. Y., Laros, J. F. J., Buermans, H. P. J., Karlberg, O., et al. (2013) · Nature Biotechnology · doi:10.1038/nbt.2702 · Cited by 250
Self-citationStevenson, K. R., Coolon, J. D., & Wittkopp, P. J. (2013) · BMC Genomics · doi:10.1186/1471-2164-14-536 · Cited by 140
Research works printed but not linked: 32
- Adoue V, Schiavi A, Light N, Almlöf JC, Lundmark P, Ge B, et al. Allelic expression mapping across cellular lineages to establish impact of non-coding SNPs. Mol Syst Biol. 2014;10:754. · DOI
- Buil A, Brown AA, Lappalainen T, Viñuela A, Davies MN, Zheng H-F, et al. Gene-gene and gene-environment interactions detected by transcriptome sequence analysis in twins. Nat Genet. 2015;47:88–91. · DOI
- Ge B, Pokholok DK, Kwan T, Grundberg E, Morcos L, Verlaan DJ, et al. Global patterns of cis variation in human cells revealed by high-density allelic expression analysis. Nat Genet. 2009;41:1216–22. · DOI
- Battle A, Mostafavi S, Zhu X, Potash JB, Weissman MM, McCormick C, et al. Characterizing the genetic basis of transcriptome diversity through RNA-sequencing of 922 individuals. Genome Res. 2014;24:14–24. · DOI · Paper page
- Kukurba KR, Zhang R, Li X, Smith KS, Knowles DA, How Tan M, et al. Allelic expression of deleterious protein-coding variants across human tissues. PLoS Genet. 2014;10, e1004304. · DOI
- MacArthur DG, Balasubramanian S, Frankish A, Huang N, Morris J, Walter K, et al. A systematic survey of loss-of-function variants in human protein-coding genes. Science. 2012;335:823–8. · DOI · Paper page
- Montgomery SB, Lappalainen T, Gutierrez-Arcelus M, Dermitzakis ET. Rare and common regulatory variation in population-scale sequenced human genomes. PLoS Genet. 2011;7, e1002144. · DOI
- Baran Y, Subramaniam M, Biton A, Tukiainen T, Tsang EK, Rivas MA, et al. The landscape of genomic imprinting across diverse adult human tissues. Genome Res. 2015;25:927–36. · DOI
- Morcos L, Ge B, Koka V, Lam KCL, Pokholok DK, Gunderson KL, et al. Genome-wide assessment of imprinted expression in human cells. Genome Biol. 2011;12:R25. · DOI
- Gimelbrant A, Hutchinson JN, Thompson BR, Chess A. Widespread monoallelic expression on human autosomes. Science. 2007;318:1136–40. · DOI · Paper page
- Borel C, Ferreira PG, Santoni F, Delaneau O, Fort A, Popadin KY, et al. Biased allelic expression in human primary fibroblast single cells. Am J Hum Genet. 2015;96:70–80. · DOI · Paper page
- Soderlund CA, Nelson WM, Goff SA. Allele Workbench: transcriptome pipeline and interactive graphics for allele-specific expression. PLoS One. 2014;9, e115740. · DOI
- Leung D, Jung I, Rajagopal N, Schmitt A, Selvaraj S, Lee AY, et al. Integrative analysis of haplotype-resolved epigenomes across human tissues. Nature. 2015;518:350–4. · DOI
- Li H, Su X, Gallegos J, Lu Y, Ji Y, Molldrem JJ, et al. dsPIG: a tool to predict imprinted genes from the deep sequencing of whole transcriptomes. BMC Bioinformatics. 2012;13:271. · DOI
- Pirinen M, Lappalainen T, Zaitlen NA, GTEx Consortium, Dermitzakis ET, Donnelly P, et al. Assessing allele-specific expression across multiple tissues from RNA-seq read data. Bioinformatics. 2015;31:2497–504. · DOI
- Cho H, Davis J, Li X, Smith KS, Battle A, Montgomery SB. High-resolution transcriptome analysis with long-read RNA sequencing. PLoS One. 2014;9, e108095. · DOI
- Turro E, Su S-Y, Gonçalves Â, Coin LJM, Richardson S, Lewin A. Haplotype and isoform specific expression estimation using multi-mapping RNA-seq reads. Genome Biol. 2011;12:R13. · DOI · Paper page
- McKenna A, Hanna M, Banks E, Sivachenko A, Cibulskis K, Kernytsky A, et al. The Genome Analysis Toolkit: a MapReduce framework for analyzing next-generation DNA sequencing data. Genome Res. 2010;20:1297–303. · DOI · Paper page
- DePristo MA, Banks E, Poplin R, Garimella KV, Maguire JR, Hartl C, et al. A framework for variation discovery and genotyping using next-generation DNA sequencing data. Nat Genet. 2011;43:491–8. · DOI
- Romanel A, Lago S, Prandi D, Sboner A, Demichelis F. ASEQ: fast allele-specific studies from next-generation sequencing data. BMC Med Genomics. 2015;8:9. · DOI
- Panousis NI, Gutierrez-Arcelus M, Dermitzakis ET, Lappalainen T. Allelic mapping bias in RNA-sequencing is not a major confounder in eQTL studies. Genome Biol. 2014;15:467. · DOI
- Gutierrez-Arcelus M, Ongen H, Lappalainen T, Montgomery SB, Buil A, Yurovsky A, et al. Tissue-specific effects of genetic and epigenetic variation on gene regulation and splicing. PLoS Genet. 2015;11, e1004958. · DOI
- Kilpinen H, Waszak SM, Gschwind AR, Raghav SK, Witwicki RM, Orioli A, et al. Coordinated effects of sequence variation on DNA binding, chromatin structure, and transcription. Science. 2013;342:744–7. · DOI · Paper page
- Gerstein MB, Kundaje A, Hariharan M, Landt SG, Yan K-K, Cheng C, et al. Architecture of the human regulatory network derived from ENCODE data. Nature. 2012;489:91–100. · DOI
- Rozowsky J, Abyzov A, Wang J, Alves P, Raha D, Harmanci A, et al. AlleleSeq: analysis of allele-specific expression and binding in a network framework. Mol Syst Biol. 2011;7:522–2. · DOI · Paper page
- Wu TD, Nacu S. Fast and SNP-tolerant detection of complex variants and splicing in short reads. Bioinformatics. 2010;26:873–81. · DOI · Paper page
- van de Geijn B, McVicker G, Gilad Y, Pritchard J. WASP: allele-specific software for robust discovery of molecular quantitative trait loci. bioRxiv. 2014. http://dx.doi.org/10.1101/011221 . · DOI
- Piskol R, Ramaswami G, Li JB. Reliable identification of genomic variants from RNA-seq data. Am J Hum Genet. 2013;93:641–51. · DOI
- Deelen P, Zhernakova DV, de Haan M, van der Sijde M, Bonder MJ, Karjalainen J, et al. Calling genotypes from public RNA-sequencing data enables identification of genetic variants that affect gene-expression levels. Genome Med. 2015;7:30. · DOI
- Kumasaka N, Knights A, Gaffney D. Fine-mapping cellular QTLs with RASQUAL and ATAC-seq. bioRxiv. 2015. http://dx.doi.org/10.1101/018788 . · DOI
- Skelly DA, Johansson M, Madeoy J, Wakefield J, Akey JM. A powerful and flexible statistical framework for testing hypotheses of allele-specific gene expression from RNA-seq data. Genome Res. 2011;21:1728–37. · DOI · Paper page
- Zhang R, Li X, Ramaswami G, Smith KS, Turecki G, Montgomery SB, et al. Quantifying RNA allelic ratios by microfluidic multiplex PCR and sequencing. Nat Methods. 2014;11:51–4. · DOI
Cited by
Sorted by citations
Items 101–200 of 344
Variant phasing and haplotypic expression from long-read sequencing in maize
Wang, B., Tseng, E., Baybayan, P., Eng, K., Regulski, M., Jiao, Y., Wang, L., Olson, A. C., Chougule, K., Buren, P. V., et al. (2020) · Communications Biology · doi:10.1038/s42003-020-0805-8 · Cited by 28
Zhang, B., Zhang, Z., Koeken, V. A. C. M., Kumar, S., Aillaud, M., Tsay, H.-C., Liu, Z., Kraft, A. R. M., Soon, C. F., Odak, I., et al. (2022) · Cell Genomics · doi:10.1016/j.xgen.2022.100232 · Cited by 26
“Afterward, the GATK/ASEReadCounter tool 66 was used to count allelic reads at each heterozygous site with the default parameters.”
Hybridization and gene expression: Beyond differentially expressed genes
Runemark, A., Moore, E. C., & Larson, E. L. (2024) · Molecular Ecology · doi:10.1111/mec.17303 · Cited by 32
“Evaluating ASE requires RNAseq reads at sufficient sequencing depth and genetic differentiation between the parental genomes to call variants within the sequenced read (Castel et al., 2015).”
Martínez‐Ruiz, C., Pracana, R., Stolle, E., Paris, C., Nichols, R. A., & Wurm, Y. (2020) · eLife · doi:10.7554/elife.55862 · Cited by 26
HaploCart: Human mtDNA haplogroup classification using a pangenomic reference graph
Rubin, J., Vogel, N., Gopalakrishnan, S., Sackett, P. W., & Renaud, G. (2022) · bioRxiv · doi:10.1101/2022.09.23.509203 · Cited by 25
X chromosome inactivation in the human placenta is patchy and distinct from adult tissues
Phung, T. N., Olney, K. C., Pinto, B. J., Silasi, M., Perley, L. E., O’Bryan, J., Kliman, H. J., & Wilson, M. A. (2022) · Human Genetics and Genomics Advances · doi:10.1016/j.xhgg.2022.100121 · Cited by 30
“Duplicated reads are suggested to be removed for allele specific expression analysis (Castel et al. 2015).”
BackgroundZhang, M., Lykke‐Andersen, S., Zhu, B., Xiao, W., Hoskins, J. W., Zhang, X., Rost, L. M., Collins, I. J., van de Bunt, M., Jia, J., et al. (2017) · Gut · doi:10.1136/gutjnl-2016-313146 · Cited by 26
Reduced Complexity Cross Design for Behavioral Genetics
Bryant, C. D., Ferris, M. T., De Villena, F. P. M., Damaj, M. I., Kumar, V., & Mulligan, M. K. (2018) · Molecular-Genetic and Statistical Techniques for Behavioral and Neural Research · doi:10.1016/b978-0-12-804078-2.00008-8 · Cited by 24
Kingman, G. A. R., Lee, D., Jones, F., Desmet, D., Bell, M., & Kingsley, D. (2021) · Proceedings of the National Academy of Sciences of the United States of America · doi:10.1073/pnas.2100694118 · Cited by 24
“At these sites, GATK ASEReadCounter was used to retrieve read count for each allele in each library.”
InfluentialLlavona, P., Pinelli, M., Mutarelli, M., Marwah, V. S., Schimpf‐Linzenbold, S., Thaler, S., Yoeruek, E., Vetter, J. M., Kohl, S., & Wissinger, B. (2017) · Genes · doi:10.3390/genes8100283 · Cited by 24
“Indeed, the presence of these cis-acting regulatory elements entail quantitative transcript alterations in an allele-specific fashion, also known as allelic expression imbalance (AEI) [11,12].”
BackgroundPerrin, H. J., Currin, K. W., Vadlamudi, S., Pandey, G. K., Ng, K. K. H., Wabitsch, M., Laakso, M., Love, M. I., & Mohlke, K. L. (2021) · PLoS Genetics · doi:10.1371/journal.pgen.1009865 · Cited by 29
“We counted reads aligning to each allele of biallelic heterozygous single nucleotide variants using ASEReadCounter [86] with the option–min-base-quality 30 and removed variants that had aligned bases other than the two genotyped alleles.”
MethodRNAseq analysis of bronchial epithelial cells to identify COPD-associated genes and SNPs
Yeo, J., Morales, D. A., Chen, T., Crawford, E. L., Zhang, X., Blomquist, T. M., Levin, A. M., Massion, P. P., Arenberg, D. A., Midthun, D. E., et al. (2018) · BMC Pulmonary Medicine · doi:10.1186/s12890-018-0603-y · Cited by 28
“Inter-individual variation in DAE of a gene is a manifestation of one or more cis-rSNPs [15, 17, 19, 22, 23].”
BackgroundImproving the reliability of peer-reviewed publications: We are all in it together
Bustin, S. A., & Nolan, T. (2016) · Biomolecular Detection and Quantification · doi:10.1016/j.bdq.2015.11.002 · Cited by 22
Križanac, A.-M., Reimer, C., Heise, J., Liu, Z., Pryce, J. E., Bennewitz, J., Thaller, G., Falker‐Gieske, C., & Tetens, J. (2025) · Genetics Selection Evolution · doi:10.1186/s12711-025-00951-9 · Cited by 31
Liu, Y., Long, H., Feng, S., Ma, T., Wang, M., Niu, L., Zhang, X., Wang, L., Lei, Y., Chen, Y., et al. (2021) · BMC Genomics · doi:10.1186/s12864-021-08141-9 · Cited by 29
“ASE analysis was carried out using the GATK ASEReadCounter tool [53] with the N-masking genome.”
MethodReplicate sequencing libraries are important for quantification of allelic imbalance
Mendelevich, A., Vinogradova, S. V., Gupta, S., Mironov, A. A., Sunyaev, S. R., & Gimelbrant, A. A. (2021) · Nature Communications · doi:10.1038/s41467-021-23544-8 · Cited by 23
“Data processing steps from read alignment to allelic counts were based on the ASEReadCounter tool in the GATK pipeline 24 .”
BackgroundMethodSurvey of allele specific expression in bovine muscle
Guillocheau, G., Hou, A. E., Meersseman, C., Esquerré, D., Rebours, E., Letaïef, R., Simao, M., Hypolite, N., Bourneuf, E., Bruneau, N., et al. (2019) · Scientific Reports · doi:10.1038/s41598-019-40781-6 · Cited by 25
Local Adaptation of Sun-Exposure-Dependent Gene Expression Regulation in Human Skin
Kita, R., & Fraser, H. B. (2016) · PLoS Genetics · doi:10.1371/journal.pgen.1006382 · Cited by 44
A pan-tissue survey of mosaic chromosomal alterations in 948 individuals
Gao, T., Kastriti, M. E., Ljungström, V., Heinzel, A., Tischler, A. S., Oberbauer, R. W., Loh, P., Adameyko, I. I., Park, P. J., & Kharchenko, P. V. (2023) · Nature Genetics · doi:10.1038/s41588-023-01537-1 · Cited by 24
“Furthermore, allele-specific expression can also arise due to transcription stochasticity, genomic imprinting and tissue-specific regulatory effects in the absence of genomic alterations, hindering the specificity of mCA detection 36,37 .”
BackgroundTrio RNA sequencing in a cohort of medically complex children
Deshwar, A. R., Yuki, K. E., Hou, H., Liang, Y., Khan, T. I., Celik, A., Ramani, A. K., Mendoza‐Londono, R., Marshall, C. R., Brudno, M., et al. (2023) · The American Journal of Human Genetics · doi:10.1016/j.ajhg.2023.03.006 · Cited by 28
He, L., Loika, Y., & Kulminski, A. M. (2022) · Translational Psychiatry · doi:10.1038/s41398-022-01913-1 · Cited by 24
Statistical framework for calling allelic imbalance in high-throughput sequencing data
Buyan, A., Meshcheryakov, G., Safronov, V., Abramov, S., Boytsov, A., Nozdrin, V., Baulin, E. F., Kolmykov, S. K., Vierstra, J. D., Kolpakov, F., et al. (2025) · Nature Communications · doi:10.1038/s41467-024-55513-2 · Cited by 23
“The analysis of ASEs became a major topic at the crossroads of genetics and functional genomics, and various strategies for allelic bias identification have been developed in the past decade 30 .”
van Beek, D., Verdonschot, J., Derks, K., Brunner, H., de Kok, T. M., Arts, I., Heymans, S., Kutmon, M., & Adriaens, M. (2023) · Scientific Reports · doi:10.1038/s41598-023-27591-7 · Cited by 20
Pan-human consensus genome significantly improves the accuracy of RNA-seq analysesPreprint
Kaminow, B., Ballouz, S., Gillis, J., & Dobin, A. (2022) · Genome Research · doi:10.1101/gr.275613.121 · Cited by 17
“This lack of variation information negatively affects allkinds ofgenomic analysesthat use the reference,suchas disease studies and GWAS analyses (Chen and Butte 2010; Rosenfeld et al. 2012; Stevenson et al. 2013; Buchkovich et al. 2015; Castel et al. 2015; Sherman et al. 2019).”
Kang, E. Y., Martin, L. J., Mangul, S., Isvilanonda, W., Zou, J., Ben‐David, E., Han, B., Lusis, A. J., Shifman, S., & Eskin, E. (2016) · Genetics · doi:10.1534/genetics.115.177246 · Cited by 19
“…and Beck 2009; Degner et al. 2009; Ge et al. 2009; Palacios et al. 2009; Daelemans et al. 2010; Gregg et al. 2010; Heap et al. 2010; Pastinen 2010; Ritchie et al. 2010; Sun et al. 2010; Wagner et al. 2010; Hill et al. 2011; Sun 2011; Wolff et al. 2011; Castel et al. 2015; van de Geijn et al. 2015).”
Expression profiles of east–west highly differentiated genes in Uyghur genomes
Ning, Z., Tan, X., Yuan, Y., Huang, K. Q., Pan, Y., Tian, L., Lü, Y., Wang, X., Qi, R., Lu, D., et al. (2023) · National Science Review · doi:10.1093/nsr/nwad077 · Cited by 22
“The driving force of the abovementioned phenomena could be cis genetic regulators or nonsense single-nucleotide polymorphisms (SNPs) where protein-truncating variants cause nonsensemediated decay (NMD) on ASE loci [28,29].”
BackgroundIntegration of solutions and services for multi-omics data analysis towards personalized medicine
Reska, D., Czajkowski, M., Jurczuk, K., Bołdak, C., Kwedlo, W., Bauer, W., Koszelew, J., & Krętowski, M. (2021) · Journal of Applied Biomedicine · doi:10.1016/j.bbe.2021.10.005 · Cited by 30
Airpart: interpretable statistical models for analyzing allelic imbalance in single-cell datasets
Mu, W.-C., Sarkar, H., Srivastava, A., Choi, K., Patro, R., & Love, M. (2021) · bioRxiv · doi:10.1093/bioinformatics/btac212 · Cited by 19
“…previous work, researchers often used a Binomial model (Castel et al. , 2020) or a Beta-Binomial (BB) model for the allelic counts (Castel et al. , 2015; Choi et al. , 2019; Edsga¨rd et al. , 2016; Heinen et al. , 2022; Santoni et al. , 2017; Skelly et al. , 2011; Zitovsky and Love, 2019), whereas…”
Genome-wide comparison of allele-specific gene expression between African and European populations
Tian, L., Khan, A., Ning, Z., Yuan, K., Zhang, C., Lou, H., Yuan, Y., & Xu, S. (2018) · Human Molecular Genetics · doi:10.1093/hmg/ddy027 · Cited by 18
“A previous study measured ASE distance between individuals as the proportion of non-shared ASE sites at shared heterozygous sites (19).”
BackgroundAraújo, G. D. S. M., Francisco, R. D. S., Ferreira, C. D. S., Rodrigues, P. T. M., Machado, D. T., de Souza, T. L., de Souza, J. T., da Silva, C. F. O., da Silva, A. F. A., Andrade, C. C. F., et al. (2018) · Frontiers in Genetics · doi:10.3389/fgene.2018.00036 · Cited by 21
“The R script was validated using the corresponding data for a reference gene set consisting of the 40 known imprinted genes reported by the GTEx Analysis Working Group (Dataset S2B: 40 known imprinted genes) (Babak et al., 2015; Baran et al., 2015), also accessible from the GTEx portal.”
MethodInfluentialA scoping review on deep learning for next-generation RNA-Seq. data analysis
Pandey, D., & Perumal, P. O. (2023) · Functional & Integrative Genomics · doi:10.1007/s10142-023-01064-6 · Cited by 20
Interactions between genetic variation and cellular environment in skeletal muscle gene expression
Taylor, D. L., Knowles, D. A., Scott, L. J., Ramirez, A. H., Casale, F. P., Wolford, B. N., Guan, L., Varshney, A., Albanus, R. D., Parker, S. C. J., et al. (2018) · PLoS ONE · doi:10.1371/journal.pone.0195788 · Cited by 15
“RNA-seq technology provides an information-dense molecular readout that includes ASE, an internally controlled experiment that minimizes technical artifacts by comparing read counts within samples instead of between samples [10,24].”
BackgroundSPLASH: a statistical, reference-free genomic algorithm unifies biological discovery
Chaung, K., Baharav, T. Z., Henderson, G., Wang, P. L., Zheludev, I., & Salzman, J. (2022) · bioRxiv · doi:10.1101/2022.06.24.497555 · Cited by 17
Yarahmadov, T., Robinson, S., Hanemian, M., Pulver, V., & Kuhlemeier, C. J. (2020) · The Plant Journal · doi:10.1111/tpj.14962 · Cited by 23
MMARGE: Motif Mutation Analysis for Regulatory Genomic Elements
Link, V. M., Romanoski, C. E., Metzler, D., & Glass, C. K. (2018) · Nucleic Acids Research · doi:10.1093/nar/gky491 · Cited by 16
A whole-organism landscape of X-inactivation in humans
Gylemo, B., Bensberg, M., & Nestor, C. (2025) · bioRxiv · doi:10.7554/elife.102701 · Cited by 16
“Classification of allelic imbalance (mono-allelic|bi-allelic) of individual alleles was initially determined by the binomial test ( P ADJ 0.01), according to best practice ( Castel et al., 2015 ).”
InfluentialFast effect size shrinkage software for beta-binomial models of allelic imbalance
Zitovsky, J. P., & Love, M. I. (2020) · F1000Research · doi:10.12688/f1000research.20916.2 · Cited by 19
“1 ."”
A strategy for building and using a human reference pangenome
Llamas, B., Narzisi, G., Schneider, V. A., Audano, P., Biederstedt, E., Blauvelt, L. J., Bradbury, P., Chang, X., Chin, C., Fungtammasan, A., et al. (2019) · F1000Research · doi:10.12688/f1000research.19630.1 · Cited by 16
“, 2009) and variant-aware mapping is one of the best ways to mitigate this problem (Castel et al., 2015).”
Rhoné, B., Mariac, C., Couderc, M., Berthouly‐Salazar, C., Salia, O. I., & Vigouroux, Y. (2017) · Genome Biology and Evolution · doi:10.1093/gbe/evx004 · Cited by 13
Genomic basis for RNA alterations revealed by whole-genome analyses of 27 cancer typesPreprint
PCAWG Transcriptome Core Group, Calabrese, C., Davidson, N. R., Fonseca, N. A., He, Y., Kahles, A., Lehmann, K.-V., Liu, F., Shiraishi, Y., Soulette, C. M., et al. (2017) · bioRxiv (Cold Spring Harbor Laboratory) · doi:10.1101/183889 · Cited by 25
“Allele-specific expression Allele-specific expression was called using the GATK ASEReadCounter (Castel et al. 2015) toolkit (version 3.4.46) using the TopHat2 alignments.”
MethodInfluentialChen, L., Li, H., Teng, J., Wang, Z., Qu, X., Chen, Z., Cai, X., Zeng, H., Bai, Z., Li, J., et al. (2025) · Advanced Science · doi:10.1002/advs.202504961 · Cited by 16
“To �lter out outlier samples in ASE data, we applied the median absolute deviation (MAD) based on Hampel’s test to the allelic imbalance (AI) ratio values ( ) across samples 46, 74 .”
Transcriptional Profiling of Early and Late Phases of Bovine Tuberculosis
Abdelaal, H. F. M., Thacker, T. C., Wadie, B., Palmer, M. V., & Talaat, A. M. (2021) · Infection and Immunity · doi:10.1128/iai.00313-21 · Cited by 16
“65 million single reads per individual library; these data satisfy previously defined criteria for RNA-Seq experiments with respect to sequencing depth (12, 13).”
BackgroundPervasive Inter-Individual Variation in Allele-Specific Expression in Monozygotic Twins
Francisco, R. D. S., Ferreira, C. D. S., Silva, J. C. S. E., Machado, D. T., Martins, Y., Ramos, V., Carnivali, G. S., Garcia, A. B., & Medina‐Acosta, E. (2019) · Frontiers in Genetics · doi:10.3389/fgene.2019.01178 · Cited by 15
Loss of Imprinting in Human Placentas Is Widespread, Coordinated, and Predicts Birth Phenotypes
Vincenz, C., Lovett, J. L., Wu, W.-S., Shedden, K., & Strassmann, B. I. (2019) · Molecular Biology and Evolution · doi:10.1093/molbev/msz226 · Cited by 16
“In the final data set, we pooled data generated from multiple libraries (supplementary table S2, Supplementary Material online) taking advantage of the fact that ASE analysis compares read counts only within samples and thus is less affected by technical parameters than in studies of relative expression (Castel et al.…”
BackgroundMethodPiórkowska, K., Żukowski, K., Ropka-Molik, K., & Tyra, M. (2018) · Animal Genetics · doi:10.1111/age.12654 · Cited by 15
Oczkowicz, M., Szmatoła, T., Piórkowska, K., & Ropka-Molik, K. (2018) · Gene · doi:10.1016/j.gene.2017.10.076 · Cited by 15
Wyder, S., Raissig, M. T., & Grossniklaus, U. (2017) · Scientific Reports · doi:10.1038/s41598-018-36768-4 · Cited by 15
You, Y., Solano, A. N., Lancaster, J., David, M., Wang, C., Tan, J. W., Su, S., Pasquali, C., Zeglinski, K., Ghamsari, R., et al. (2025) · bioRxiv (Cold Spring Harbor Laboratory) · doi:10.1101/2025.09.11.675724 · Cited by 16
“This can arise from cis -acting regulatory variation, imprinting, or post-transcriptional effects (62,63) .”
STAR+WASP reduces reference bias in the allele-specific mapping of RNA-seq readsPreprint
Asiimwe, R., & Alexander, D. (2024) · bioRxiv · doi:10.1101/2024.01.21.576391 · Cited by 14
“This approach was successfully utilized for multiple ASE-based analyses, such as identifying cis-regulated gene expression variations, nonsense-mediated mRNA decay, rare regulatory variation, and imprinting (Castel et al. 2015; Cosentino, Brink, and Siegel 2021).”
MethodRoss, P. J., Mok, R. S. F., Smith, B. S., Rodrigues, D. C., Mufteev, M., Scherer, S. W., & Ellis, J. (2020) · Molecular Autism · doi:10.1186/s13229-020-00333-6 · Cited by 12
Gusev, A., Spisák, S., Fay, A. P., Carol, H. A., Vavra, K. C., Signoretti, S., Tisza, V., Pomerantz, M. M., Abbasi, F., Seo, J.-H., et al. (2019) · bioRxiv (Cold Spring Harbor Laboratory) · doi:10.1101/631150 · Cited by 15
Hovhannisyan, H., & Gabaldón, T. (2018) · Current topics in microbiology and immunology · doi:10.1007/82_2018_122 · Cited by 11
ASElux: an ultra‐fast and accurate allelic reads counter
Miao, Z., Alvarez, M., Pajukanta, P., & Ko, A. (2018) · Bioinform. · doi:10.1093/bioinformatics/btx762 · Cited by 14
“Although several methods have been developed to identify ASE events from RNA-sequencing (RNA-seq) data (Castel et al., 2015; León-novelo et al., 2014; Liu et al., 2014; Li et al, 2012), mapping bias remains a major obstacle in ASE analysis (Degner et al., 2009; Panousis et al., 2014; Stevenson et…”
MethodZhao, D., Lin, M., Pedrosa, E., Lachman, H. M., & Zheng, D. (2017) · BMC Genomics · doi:10.1186/s12864-017-4261-x · Cited by 12
“, mapping bias, which remains a big challenge in alignment based analysis [39].”
BackgroundSpisák, S., Tisza, V., Nuzzo, P. V., Seo, J.-H., Pataki, B., Ribli, D., Sztupinszki, Z. M., Bell, C. A., Rohanizadegan, M., Stillman, D. R., et al. (2023) · Nature Communications · doi:10.1038/s41467-023-40616-z · Cited by 14
Ye, Z., Jiang, X., Pfrender, M., & Lynch, M. (2021) · Genome Biology and Evolution · doi:10.1093/gbe/evab243 · Cited by 13
Direct Testing for Allele-Specific Expression Differences Between Conditions
León‐Novelo, L., Gerken, A. R., Graze, R. M., McIntyre, L. M., & Marroni, F. (2017) · G3 Genes Genomes Genetics · doi:10.1534/g3.117.300139 · Cited by 21
Identification and Comparison of Imprinted Genes Across Plant Species.
Picard, C. L., & Gehring, M. (2020) · Methods in molecular biology · doi:10.1007/978-1-0716-0179-2_13 · Cited by 13
Knutsen, T. M., Olsen, H. G., Ketto, I., Sundsaasen, K. K., Kohler, A., Tafintseva, V., Svendsen, M., Kent, M., & Lien, S. (2022) · Genetics Selection Evolution · doi:10.1186/s12711-022-00731-9 · Cited by 12
“The test gives a p-value for the hypothesis that the number of reads for each allele at heterozygous loci will be approximately equal when sequenced [48].”
BackgroundLimited allele-specific gene expression in highly polyploid sugarcanePreprint
Margarido, G., Correr, F. H., Furtado, A., Botha, F., & Henry, R. (2021) · Genome Research · doi:10.1101/gr.275904.121 · Cited by 12
“Ensuring that a large proportion of the reads were effectively and correctly assigned to their corresponding genomic regions is crucial in ASE studies (Castel et al. 2015).”
Estimation of cis-eQTL Effect Sizes Using a Log of Linear Model
Palowitch, J., Shabalin, A., Zhou, Y.-H., Nobel, A., & Wright, F. (2017) · Biometrics · doi:10.1111/biom.12810 · Cited by 12
Scalable and unsupervised discovery from raw sequencing reads using SPLASH2
Kokot, M., Dehghannasiri, R., Baharav, T. Z., Salzman, J., & Deorowicz, S. (2024) · Nature Biotechnology · doi:10.1038/s41587-024-02381-2 · Cited by 20
“In addition to being fragmented, these alignment-first analyses are expected to suffer from poor sensitivity to unannotated splicing, especially in cases involving mutations in exonic sequences, high mutation rates or mapping to repetitive regions—known sources of mapping failure 19 .”
Evaluation of noninvasive biospecimens for transcriptome studies
Martorella, M., Kasela, S., Garcia-Flores, R., Gokden, A., Castel, S. E., & Lappalainen, T. (2023) · BMC Genomics · doi:10.1186/s12864-023-09875-4 · Cited by 11
“Allele-specific expression was calculated using ASERead-Counter 4.0.1.1 [56] and using the imputed, phased, and filtered VCF described in the GTEx replication analyses.”
BackgroundMethodInfluentialSelf-citationX-linked genes exhibit miR6891-5p-regulated skewing in Sjögren’s syndrome
Shaw, T. M., Zhang, W., McCoy, S. S., Pagenkopf, A., Carp, D. M., Garg, S., Parker, M., Qiu, X.-E., Scofield, R., Galipeau, J., et al. (2022) · Journal of molecular medicine · doi:10.1007/s00109-022-02205-3 · Cited by 11
“However, X-linked genes exhibited major differences in MAFs between control and pSS MSCs, with significant skewing detected in pSS (P 0.0001, Fig.”
MethodInfluentialXu, S., Feng, W., Lu, Z., Yu, C. Y., Shao, W., Nakshatri, H., Reiter, J. L., Gao, H., Chu, X., Wang, Y., et al. (2020) · Frontiers in Bioengineering and Biotechnology · doi:10.3389/fbioe.2020.00886 · Cited by 10
Noh, S., Christopher, L., Strassmann, J. E., & Queller, D. C. (2020) · Ecology and Evolution · doi:10.1002/ece3.5924 · Cited by 11
Frésard, L., Smail, C., Smith, K. S., Ferraro, N., Teran, N. A., Kernohan, K., Bonner, D., Li, X., Marwaha, S., Zappala, Z., et al. (2018) · bioRxiv · doi:10.1101/408492 · Cited by 11
“Allele specific expression ASEReadCounter [49] version 3.”
Systems analysis of dilated cardiomyopathy in the next generation sequencing era
Harakalova, M., & Asselbergs, F. (2018) · Wiley Interdisciplinary Reviews: Systems Biology and Medicine · doi:10.1002/wsbm.1419 · Cited by 11
Chuang, T.-J., Tseng, Y.-H., Chen, C.-Y., & Wang, Y.-D. (2017) · Scientific Reports · doi:10.1038/s41598-017-07514-z · Cited by 11
“…the reference and alternative alleles across individuals, was reported to be effective for eliminating varied confounding factors that result in ASE in specific individuals 21, 22 , our results show that the RME effect may affect the effectiveness of the method for detecting imprinting events.”
A genome-wide interactome of DNA-associated proteins in the human liverPreprint
Ramaker, R. C., Savic, D., Hardigan, A. A., Newberry, K. M., Cooper, G. M., Myers, R., & Cooper, S. J. (2017) · Genome Research · doi:10.1101/gr.222083.117 · Cited by 12
“Allele-specific expression was calculated for each expressed heterozygous SNP using the GATK “ ASEReadCounter ” function according to previously described best practices (Castel et al. 2015).”
Alasoo, K., Rodrigues, J., Mukhopadhyay, S., Knights, A. J., Mann, A. L., Kundu, K., Hale, C., Dougan, G., & Gaffney, D. J. (2017) · bioRxiv (Cold Spring Harbor Laboratory) · doi:10.1101/102392 · Cited by 15
“We used ASEReadCounter (65) from the Genome Analysis ToolKit (GATK) to count the number of allele-specific fragments overlapping each variant in the RNA-seq and ATAC-seq datasets.”
MethodA landscape of X-inactivation during human T cell development
Gylemo, B., Bensberg, M., Hennings, V., Lundqvist, C., Camponeschi, A., Goldmann, D., Zhang, H., Selimović-Pašić, A., Lentini, A., Ekwall, O., et al. (2024) · Nature Communications · doi:10.1038/s41467-024-54110-7 · Cited by 10
Kim, K., Hong, E. P., Lee, Y., McLean, Z. L., Elezi, E., Lee, R., Kwak, S., McAllister, B., Massey, T. H., Lobanov, S. V., et al. (2024) · Proceedings of the National Academy of Sciences · doi:10.1073/pnas.2322924121 · Cited by 11
“Due to significant alignment bias in ASE analysis (27), we compared the observed ratio of alternative and reference alleles to the expected ratio to determine imbalanced expression of FAN1 mRNA.”
Tsouris, A., Brach, G., Schacherer, J., & Hou, J. (2023) · Cell Genomics · doi:10.1016/j.xgen.2023.100459 · Cited by 16
Cao, S., Zhu, H., Cui, J. J., Liu, S., Li, Y., Shi, J., Mo, J., Wang, Z., Wang, H., Hu, J., et al. (2023) · Genome Research · doi:10.1101/gr.277704.123 · Cited by 11
“First, high-confidence heterozygous variants were identified by variant calling followed by stringent filtering to minimize the bias introduced through transcription and mapping (Castel et al. 2015).”
Fejzo, M., Rocha, N., Cimino, I., Lockhart, S., Petry, C., Kay, R., Burling, K., Barker, P., George, A., Yasara, N., et al. (2023) · bioRxiv · doi:10.1101/2023.06.02.542661 · Cited by 10
Detection of quantitative trait loci from RNA-seq data with or without genotypes using BaseQTL
Vigorito, E., Lin, W., Starr, C., Kirk, P., White, S. R., & Wallace, C. (2021) · Nature Computational Science · doi:10.1038/s43588-021-00087-y · Cited by 13
Post‐genomic behavioral genetics: From revolution to routine
Ashbrook, D. G., Mulligan, M. K., & Williams, R. W. (2017) · Genes Brain & Behavior · doi:10.1111/gbb.12441 · Cited by 13
“RNAseq of F1 individuals can be used to analyze allele specific expression in order to identify gene variants associated with cis-eQTLs (Castel et al. 2015).”
Sigurdsson, M. I., Saddic, L., Heydarpour, M., Chang, T.-W., Shekar, P., Aranki, S. F., Couper, G. S., Shernan, S. K., Seidman, J. G., Body, S. C., et al. (2016) · Genome Medicine · doi:10.1186/s13073-016-0381-1 · Cited by 9
“In addition to the limitations and methodological concerns involved in expression quantification, several specific issues must be considered when assessing ASE with high-throughput RNA-seq data [11].”
BackgroundMethodPrecision Proteogenomics Reveals Pan-Cancer Impact of Germline Variants
Rodrigues, F. M., Terekhanova, N. V., Imbach, K., Clauser, K. R., Selvan, M. E., Mendizabal, I., Geffen, Y., Akiyama, Y., Maynard, M., Yaron, T., et al. (2025) · Cell · doi:10.1016/j.cell.2025.03.026 · Cited by 9
Allele-specific Expression Reveals Multiple Paths to Highland Adaptation in Maize
Hu, H.-X., Crow, T. M., Nojoomi, S., Schulz, A. J., Hufford, M., Flint-Garcia, S., Sawers, R. J. H., Rellán-Álvarez, R., Estévez-Palmas, J. M., Ross-Ibarra, J., et al. (2022) · bioRxiv · doi:10.1093/molbev/msac239 · Cited by 9
“Allelic read counts are the starting point of all ASE analyses (Castel et al. 2015)□.”
BackgroundAbood, A., Mesner, L. D., Rosenow, W. T., Al-Barghouthi, B. M., Horowitz, N. B., Morgan, E. F., Gerstenfeld, L. C., & Farber, C. R. (2020) · Journal of Bone and Mineral Research · doi:10.1002/jbmr.4622 · Cited by 8
“The resultant BAM files were then used as input for variant calling using the GATK pipeline.((34)) Briefly, duplicate reads were identified using MarkDuplicates.”
MethodFu, R.-Q., Qin, P.-F., Zou, X.-H., Hu, Z.-L., Hong, N., Wang, Y., & Jin, W.-F. (2021) · Frontiers in Cell and Developmental Biology · doi:10.3389/fcell.2021.702897 · Cited by 9
Shetty, A. H., Seo, J.-H., Bell, C., O'Connor, E., Pomerantz, M., Freedman, M., & Gusev, A. (2021) · bioRxiv · doi:10.1101/2021.06.02.446619 · Cited by 9
“Allelespecific read counts were generated by the GATK ASEReadCounter (Castel et al. 2015).”
MethodCorreia, L., Magno, R., Xavier, J., de Almeida, B. P., Duarte, I., Esteves, F., Ghezzo, M. N., Eldridge, M., Sun, C., Bosma, A., et al. (2021) · npj Breast Cancer · doi:10.1038/s41523-022-00435-9 · Cited by 9
Frochaux, M., Sleiman, M. S. B., Gardeux, V., Dainese, R., Hollis, B., Litovchenko, M., Braman, V. S., Andreani, T., Osman, D., & Deplancke, B. (2020) · Genome biology · doi:10.1186/s13059-019-1912-z · Cited by 13
Long non-coding RNA gene regulation and trait associations across human tissuesPreprint
de Goede, O. M., Ferraro, N. M., Nachun, D. C., Rao, A. S., Aguet, F., Barbeira, A., Castel, S. E., Kim-Hellmuth, S., Park, Y., Scott, A. J., et al. (2019) · bioRxiv (Cold Spring Harbor Laboratory) · doi:10.1101/793091 · Cited by 14
Self-citationKryvokhyzha, D., Salcedo, A., Eriksson, M. C., Duan, T., Tawari, N. R., Chen, J., Guerrina, M., Kreiner, J. M., Kent, T. V., Lagercrantz, U., et al. (2017) · bioRxiv · doi:10.1101/234096 · Cited by 9
“Although potential PCR duplicates are usually not removed from RNA-Seq data, for the allele-specific expression analysis removing duplicates is recommended (Castel et al. 2015).”
BackgroundRecent mating‐system evolution in Eichhornia is accompanied by cis‐regulatory divergence
Arunkumar, R., Maddison, T. I., Barrett, S. C. H., & Wright, S. (2016) · New Phytologist · doi:10.1111/nph.13918 · Cited by 11
Extensive folding variability between homologous chromosomes in mammalian cells
Irastorza-Azcarate, I., Kukalev, A., Kempfer, R., Thieme, C. J., Mastrobuoni, G., Markowski, J., Loof, G., Sparks, T. M., Brookes, E., Natarajan, K., et al. (2024) · bioRxiv · doi:10.1101/2024.05.08.591087 · Cited by 8
“We calculated differential allelic expression as previously described (Castel et al, 2015), considering both exonic and intronic regions (for gene expression levels see permanent data repository Irastorza-Azcarate et al, 2024).”
InfluentialSantos-Rebouças, C. B., Ferreira, C. D. S., Nogueira, J. D. S., Brustolini, O. J. B., de Almeida, L. G. P., Gerber, A. L., Guimarães, A. P. D. C., Piergiorge, R. M., Struchiner, C. J., Pôrto, L. C., et al. (2024) · Scientific Reports · doi:10.1038/s41598-024-59259-1 · Cited by 7
“We used ASEReadCounter to determine the read counts for reference and alternative alleles in each position 49 .”
MethodImmune disease variants modulate gene expression in regulatory CD4+ T cells
Bossini‐Castillo, L., Glinos, D. A., Kunowska, N., Golda, G., Lamikanra, A., Spitzer, M., Soskic, B., Cano-Gamez, E., Smyth, D. J., Cattermole, C., et al. (2022) · Cell Genomics · doi:10.1016/j.xgen.2022.100117 · Cited by 59
The expressed mutational landscape of microsatellite stable colorectal cancers
Sveen, A., Johannessen, B., Eilertsen, I. A., Røsok, B. I., Gulla, M., Eide, P. W., Bruun, J., Kryeziu, K., Meza‐Zepeda, L. A., Myklebost, O., et al. (2021) · Genome Medicine · doi:10.1186/s13073-021-00955-2 · Cited by 8
PAC: Highly accurate quantification of allelic gene expression for population and disease geneticsPreprint
Saukkonen, A., Kilpinen, H., & Hodgkinson, A. (2021) · bioRxiv (Cold Spring Harbor Laboratory) · doi:10.1101/2021.07.13.452202 · Cited by 1
Wu, W.-S., Lovett, J., Shedden, K., Strassmann, B. I., & Vincenz, C. (2021) · bioRxiv · doi:10.1093/g3journal/jkab176 · Cited by 8
ReQTL: identifying correlations between expressed SNVs and gene expression using RNA-sequencing data
Spurr, L. F., Alomran, N., Bousounis, P., Reece-Stremtan, D., Prashant, N. M., Liu, H., Słowiński, P., Li, M., Zhang, Q., Sein, J., et al. (2019) · Bioinformatics · doi:10.1093/bioinformatics/btz750 · Cited by 10
“…molecules, including those involved in transcript generation, processing, stability and structural maintenance (Casamassimi et al., 2017; Chess, 2016; Do et al., 2017; Eisenberg and Levanon, 2018; Gagnidze et al., 2018; Imprialou et al., 2017; Moreno-Moral et al., 2017; Vandiedonck,…”
BackgroundiMapSplice: Alleviating reference bias through personalized RNA-seq alignment
Liu, X., MacLeod, J. N., & Liu, J. (2018) · PLoS ONE · doi:10.1371/journal.pone.0201554 · Cited by 8
Modified penetrance of coding variants by cis-regulatory variation shapes human traitsPreprint
Castel, S., Cervera, A., Mohammadi, P., Aguet, F., Reverter, F., Wolman, A., Guigó, R., Iossifov, I., Vasileva, A., & Lappalainen, T. (2017) · bioRxiv · doi:10.1101/190397 · Cited by 8
“The number of reads mapping to the reference and alternative alleles was quantified using allelecounter requiring MAPQ = 255 and BASEQ ≥ 10 (Castel et al., 2015).”
BackgroundMethodInfluentialSelf-citationThe first international workshop on the epigenetics of osteoarthritis
Meulenbelt, I., Bhutani, N., den Hollander, W., Gay, S., Oppermann, U., Reynard, L., Skelton, A., Young, D., Beier, F., & Loughlin, J. (2017) · Connective Tissue Research · doi:10.3109/03008207.2016.1168409 · Cited by 8
“and likely RNA editing even more so, considerably influences whether reads will be aligned properly and must thus be addressed (91).”
BackgroundRNA‐seq: Applications and Best Practices
Pereira, M. A., Imada, E. L., & Guedes, R. L. M. (2017) · InTech eBooks · doi:10.5772/intechopen.69250 · Cited by 14
“However, it is important that the choice for discarding a duplicate read is not done by mapping score as this might bias toward the reference allele [198].”
Background
Metadata
- Authors
- Castel, S. E., Levy-Moonshine, A., Mohammadi, P., Banks, E., & Lappalainen, T.
- Affiliations
- New York Genome Center (US)
- Broad Institute (US)
- Corresponding author
- Castel, Stephane E.
- Lappalainen, Tuuli
- Venue
- Genome Biology
- Published
- 2015-09-17
- Volume
- 16
- Issue
- 1
- Pages
- 195-195
- ISSN
- 1465-6906 (ISSN-L)
- 1474-760X
- PMC
- PMC4574606
- OpenAlex
- W2142933606
- Cited by
- 375
- References
- 43
- Citations by year
- 2026: 29 · 2025: 36 · 2024: 25 · 2023: 45 · 2022: 25 · 2021: 47 · 2020: 33 · 2019: 35 · 2018: 37 · 2017: 38 · 2016: 21 · 2015: 4
- FWCI
- 14.48
- Type
- journal article
- Language
- en
- Open access
- gold
- doi.org
- Licence
- Locations
- Genome biology (publishedVersion, cc-by)
- bioRxiv (Cold Spring Harbor Laboratory) (acceptedVersion, other-oa)
- PubMed Central (publishedVersion, cc-by)
- PubMed (publishedVersion)
- Funders
- University of Miami (MH090936, MH090937, MH090951, MH090948, DA006227, MH090941)
- Harvard University (MH090948)
- University of Chicago (MH090951, MH090937)
- Broad Institute (HHSN268201000029C)
- New York Genome Center
- Université de Genève (MH090941)
- National Institutes of Health (10XS170, #HHSN261200800001E, HHSN268201000029C, 10XS171, HHSN261200800001C, 10ST1035, MH090937)
- National Heart, Lung, and Blood Institute (HHSN268201000029C, HHSN261200800001E)
- National Institute of Mental Health (R01MH101814, R01MH090937, HHSN261200800001E, R01MH090948, R01MH090941, R01MH090936, R01MH090951)
- National Institute on Drug Abuse (DA006227, R01DA006227)
- National Human Genome Research Institute (U01HG006569, HHSN261200800001E)
- NIH Office of the Director (HHSN261200800001E)
- National Cancer Institute (HHSN261200800001E))
- National Institute of Neurological Disorders and Stroke
- Common Fund
- Topics
- Life Sciences › Biochemistry, Genetics and Molecular Biology › Molecular Biology › Genomics and Phylogenetic Studies
- Life Sciences › Biochemistry, Genetics and Molecular Biology › Molecular Biology › RNA Research and Splicing
- Life Sciences › Biochemistry, Genetics and Molecular Biology › Molecular Biology › Single-cell and spatial transcriptomics
- Keywords
- allelic expression, RNA-seq, quality control, genotyping errors, cis-regulatory variation, nonsense-mediated mRNA decay, bioinformatics software
- MeSH terms
- Alleles, Cell Line, Data Interpretation, Statistical, Humans, Software, Gene Expression, Sequence Analysis, RNA, Gene Expression Profiling, Genotyping Techniques
About these checks
Registry, retraction, Cites and statistics results are computed, not judged, with one exception: a printed reference that no index lists is read once by a model before it counts as a citation error. Claims are extracted by a model and kept only when their quote appears verbatim in the text; each cited source is then checked, with a model’s help, for whether it says what the claim relies on. Those verdicts can be wrong — read the claim’s quote and the cited source before relying on one.
Statistics and arithmetic are recomputed, not judged.
Confidence bands are shown only for fields calibrated on our annotated test set. None is calibrated yet, so no band is shown.
What counts as a claim ›How we measure confidence ›How we check this ›
Are you an author, or do you see a problem with this page? Request a review
