

The DOI matches its Crossref record; 27 of the 27 references it cites were found in a registry or an index.
Pooling across cells to normalize single-cell RNA sequencing data with many zero counts
Open accessAbstract
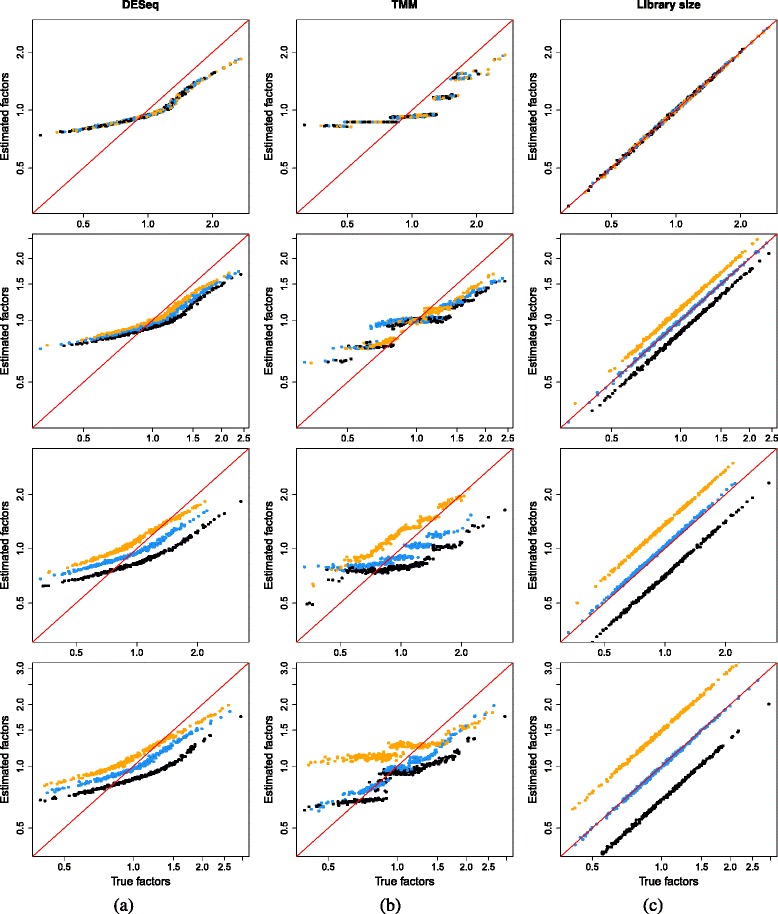
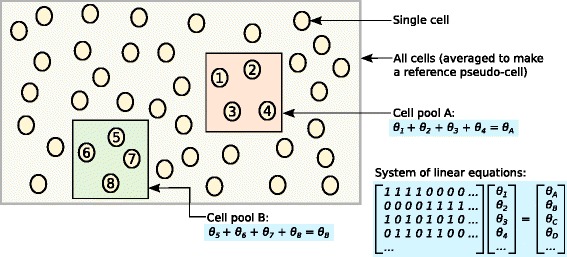
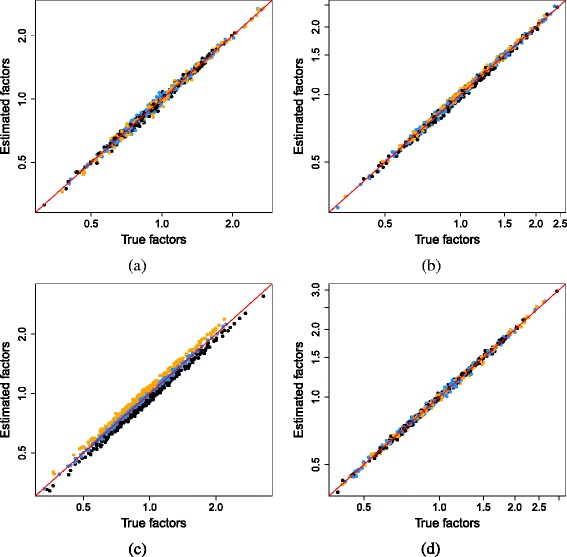
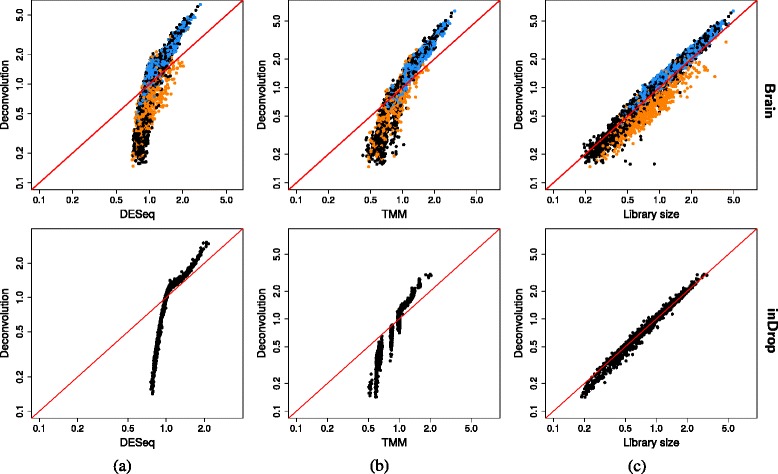
Normalization of single-cell RNA sequencing data is necessary to eliminate cell-specific biases prior to downstream analyses. However, this is not straightforward for noisy single-cell data where many counts are zero. We present a novel approach where expression values are summed across pools of cells, and the summed values are used for normalization. Pool-based size factors are then deconvolved to yield cell-based factors. Our deconvolution approach outperforms existing methods for accurate normalization of cell-specific biases in simulated data. Similar behavior is observed in real data, where deconvolution improves the relevance of results of downstream analyses.
Overview
The claims and statistics of this paper haven’t been checked yet.
Run the check — free, no account needed. It reads the open-access text and checks the sources it cites.
Integrity signals
Registry
Cites
Statistics
Figures
Verification
Claims the paper makes
The claims and statistics of this paper haven’t been checked yet.
Run the check — free, no account needed. It reads the open-access text and checks the sources it cites.
Claims other papers make about this one
Each is checked against this paper’s own text: does it say what the citing paper says it does?
The source backs part of the claim, not all of it — or backs it for a different population, condition or comparison.
In the citing paper
“A recent comparative analysis found that pseudobulk analysis methods are among the best-performing methods for differential state analysis and for making sample-level comparisons from single-cell data, and help to overcome some of the inherent sparsity in scRNA-seq data19,89.”
From Dissection of artifactual and confounding glial signatures by single-cell sequencing of mouse and human brain (2022) · cites this paper as [89]
Experimental — accuracy not yet measuredThe source backs part of the claim, not all of it — or backs it for a different population, condition or comparison.
In the citing paper
“However, one suggested approach to account for within-individual correlation is the aggregation of cell-type-specific expression values within an individual by using either a sum or a mean11–13.”
From A practical solution to pseudoreplication bias in single-cell studies (2021) · cites this paper as [11]
Experimental — accuracy not yet measuredIn the citing paper
“This suggests that they are unlikely to remain method specific at higher expression levels and that their impact on conclusions drawn from scRNAseq data is rather limited (Lun et al., 2016).”
From Comparative Analysis of Single-Cell RNA Sequencing Methods (2017) · cites this paper as Lun et al., 2016
Self-check
Percentages, sums and reported differences re-computed from the paper’s own numbers.
The self-check needs the paper’s full text.
Citations
Cites
Moderated estimation of fold change and dispersion for RNA-seq data with DESeq2
Love, M. I., Huber, W., & Anders, S. (2014) · Genome Biology · doi:10.1186/s13059-014-0550-8 · Cited by 95,106
Robinson, M. D., McCarthy, D. J., & Smyth, G. K. (2010) · Bioinformatics · doi:10.1093/bioinformatics/btp616 · Cited by 41,364
Differential expression analysis for sequence count data
Anders, S., & Huber, W. (2010) · Genome Biology · doi:10.1186/gb-2010-11-10-r106 · Cited by 15,581
A scaling normalization method for differential expression analysis of RNA-seq data
Robinson, M. D., & Oshlack, A. (2010) · Genome Biology · doi:10.1186/gb-2010-11-3-r25 · Cited by 7,876
Highly parallel genome-wide expression profiling of individual cells using nanoliter droplets.
Macosko, E. Z., Basu, A., Satija, R., Nemesh, J., Shekhar, K., Goldman, M., Tirosh, I., Bialas, A. R., Kamitaki, N., Martersteck, E. M., et al. (2015) · Cell · doi:10.1016/j.cell.2015.05.002 · Cited by 7,110
McCarthy, D. J., Chen, Y., & Smyth, G. K. (2012) · Nucleic Acids Research · doi:10.1093/nar/gks042 · Cited by 5,195
Droplet barcoding for single-cell transcriptomics applied to embryonic stem cells
Klein, A. M., Mazutis, L., Akartuna, I., Tallapragada, N., Veres, A., Li, V., Peshkin, L., Weitz, D. A., & Kirschner, M. W. (2015) · Cell · doi:10.1016/j.cell.2015.04.044 · Cited by 3,356
Cell types in the mouse cortex and hippocampus revealed by single-cell RNA-seq
Zeisel, A., Muñoz-Manchado, A. B., Codeluppi, S., Lönnerberg, P., La Manno, G., Juréus, A., Marques, S., Munguba, H., He, L., Betsholtz, C., et al. (2015) · Science · doi:10.1126/science.aaa1934 · Cited by 3,124
Normalization of RNA-seq data using factor analysis of control genes or samples
Risso, D., Ngai, J., Speed, T. P., & Dudoit, S. (2014) · Nature Biotechnology · doi:10.1038/nbt.2931 · Cited by 2,052
Single-Cell RNA-Seq Reveals Dynamic, Random Monoallelic Gene Expression in Mammalian Cells
Deng, Q., Ramsköld, D., Reinius, B., & Sandberg, R. (2014) · Science · doi:10.1126/science.1245316 · Cited by 1,345
Cited by
Sorted by citations
Items 201–300 of 999
Myc and Dnmt1 impede the pluripotent to totipotent state transition in embryonic stem cells
Fu, X., Wu, X., Djekidel, M. N., & Zhang, Y. (2019) · Nature Cell Biology · doi:10.1038/s41556-019-0343-0 · Cited by 108
Peired, A. J., Antonelli, G., Angelotti, M. L., Allinovi, M., Guzzi, F., Sisti, A., Semeraro, R., Conte, C., Mazzinghi, B., Nardi, S., et al. (2020) · Science Translational Medicine · doi:10.1126/scitranslmed.aaw6003 · Cited by 112
Single-Cell Transcriptional Analysis
Wu, A. R., Wang, J., Streets, A., & Huang, Y. (2017) · Annual Review of Analytical Chemistry · doi:10.1146/annurev-anchem-061516-045228 · Cited by 107
Golumbeanu, M., Cristinelli, S., Rato, S., Muñoz, M., Cavassini, M. L., Beerenwinkel, N., & Ciuffi, A. (2018) · Cell Reports · doi:10.1016/j.celrep.2018.03.102 · Cited by 109
How Single-Cell Genomics Is Changing Evolutionary and Developmental Biology
Marioni, J. C., & Arendt, D. (2017) · Annual Review of Cell and Developmental Biology · doi:10.1146/annurev-cellbio-100616-060818 · Cited by 109
Self-citationSCRABBLE: single-cell RNA-seq imputation constrained by bulk RNA-seq data
Peng, T., Zhu, Q., Yin, P., & Tan, K. (2019) · Genome biology · doi:10.1186/s13059-019-1681-8 · Cited by 104
Neavin, D. R., Nguyen, Q. H., Daniszewski, M., Liang, H. H., Chiu, H. S., Wee, Y. K., Senabouth, A., Lukowski, S. W., Crombie, D. E., Lidgerwood, G. E., et al. (2021) · Genome biology · doi:10.1186/s13059-021-02293-3 · Cited by 104
Mederacke, I., Filliol, A., Affo, S., Nair, A., Hernandez, C., Sun, Q., Hamberger, F., Brundu, F., Chen, Y., Ravichandra, A., et al. (2022) · Science Translational Medicine · doi:10.1126/scitranslmed.abe5795 · Cited by 103
JAK–STAT Signaling in Inflammatory Breast Cancer Enables Chemotherapy-Resistant Cell States
Stevens, L. E., Peluffo, G., Qiu, X., Temko, D., Fassl, A., Li, Z., Trinh, A. C., Seehawer, M., Jovanović, B., Alečković, M., et al. (2022) · Cancer Research · doi:10.1158/0008-5472.can-22-0423 · Cited by 110
C1 CAGE detects transcription start sites and enhancer activity at single-cell resolution
Kouno, T., Moody, J., Kwon, A. T.-J., Shibayama, Y., Kato, S., Huang, Y., Böttcher, M. E., Motakis, E., Mendez, M., Severin, J., et al. (2019) · Nature Communications · doi:10.1038/s41467-018-08126-5 · Cited by 101
An atlas of cell types in the mouse epididymis and vas deferens
Rinaldi, V. D., Donnard, E. R., Gellatly, K. J., Rasmussen, M., Küçükural, A., Yukselen, O., Garber, M. G., Sharma, U., & Rando, O. J. (2020) · eLife · doi:10.7554/elife.55474 · Cited by 105
Tissue morphology influences the temporal program of human brain organoid development
Chiaradia, I., Imaz-Rosshandler, I., Nilges, B. S., Boulanger, J., Pellegrini, L., Das, R., Kashikar, N. D., & Lancaster, M. A. (2023) · Cell stem cell · doi:10.1016/j.stem.2023.09.003 · Cited by 106
Eling, N., Richard, A. C., Richardson, S., Marioni, J. C., & Vallejos, C. A. (2018) · Cell Systems · doi:10.1016/j.cels.2018.06.011 · Cited by 99
Self-citationWang, M., Song, W., Chen, M., Wang, Q., Zhou, X., Xu, P., Krek, A., Yoon, Y., Ho, L., Orr, M. E., et al. (2022) · Molecular Neurodegeneration · doi:10.1186/s13024-022-00517-z · Cited by 104
Model-based understanding of single-cell CRISPR screening
Duan, B., Zhou, C., Zhu, C., Yu, Y., Li, G., Zhang, S., Zhang, C., Ye, X., Ma, H., Qu, S., et al. (2019) · Nature Communications · doi:10.1038/s41467-019-10216-x · Cited by 98
Soria, C. L. D., Lee, J., Chong, T., Coghlan, A., Tracey, A., Young, M. D., Andrews, T. S., Hall, C. L., Ng, B. L., Rawlinson, K. A., et al. (2020) · Nature Communications · doi:10.1038/s41467-020-20092-5 · Cited by 96
Data analysis guidelines for single-cell RNA-seq in biomedical studies and clinical applications
Su, M., Pan, T., Chen, Q.-Z., Zhou, W., Gong, Y., Xu, G., Yan, H.-Y., Li, S., Shi, Q.-Z., Zhang, Y., et al. (2022) · Military Medical Research · doi:10.1186/s40779-022-00434-8 · Cited by 114
A comprehensive spatio-cellular map of the human hypothalamus
Tadross, J. A., Steuernagel, L., Dowsett, G. K. C., Kentistou, K. A., Lundh, S. H., Porniece, M., Klemm, P., Rainbow, K., Hvid, H., Kania, K., et al. (2025) · Nature · doi:10.1038/s41586-024-08504-8 · Cited by 108
Deconvolution of cell type-specific drug responses in human tumor tissue with single-cell RNA-seq
Zhao, W., Dovas, A., Spinazzi, E. F., Levitin, H. M., Banu, M. A., Upadhyayula, P. S., Sudhakar, T. D., Marie, T., Otten, M. L., Sisti, M. B., et al. (2021) · Genome Medicine · doi:10.1186/s13073-021-00894-y · Cited by 90
Supervised discovery of interpretable gene programs from single-cell data
Kunes, R., Walle, T., Land, M., Nawy, T., & Pe’er, D. (2023) · Nature Biotechnology · doi:10.1038/s41587-023-01940-3 · Cited by 106
Network Medicine in Pathobiology
Lee, L. Y.-H., & Loscalzo, J. (2019) · The American Journal of Pathology · doi:10.1016/j.ajpath.2019.03.009 · Cited by 95
A living biobank of ovarian cancer ex vivo models reveals profound mitotic heterogeneity
Nelson, L., Tighe, A., Golder, A., Littler, S., Bakker, B., Moralli, D., Baker, S. M., Donaldson, I. J., Spierings, D. C. J., Wardenaar, R., et al. (2020) · Nature Communications · doi:10.1038/s41467-020-14551-2 · Cited by 97
Systematic comparison of high-throughput single-cell RNA-seq methods for immune cell profiling
Yamawaki, T., Lu, D., Ellwanger, D. C., Bhatt, D. M., Manzanillo, P. S., Arias, V., Zhou, H., Yoon, O. K., Homann, O. R., Wang, S., et al. (2021) · BMC Genomics · doi:10.1186/s12864-020-07358-4 · Cited by 95
Normalization Methods on Single-Cell RNA-seq Data: An Empirical Survey
Lytal, N., Ran, D., & An, L. (2020) · Frontiers in Genetics · doi:10.3389/fgene.2020.00041 · Cited by 101
Yang, C., Tian, C., Hoffman, T. E., Jacobsen, N. K., & Spencer, S. L. (2021) · Nature Communications · doi:10.1038/s41467-021-21549-x · Cited by 101
DOCK2 is involved in the host genetics and biology of severe COVID-19
Namkoong, H., Edahiro, R., Takano, T., Nishihara, H., Shirai, Y., Sonehara, K., Tanaka, H., Azekawa, S., Mikami, Y., Lee, H., et al. (2022) · Nature · doi:10.1038/s41586-022-05163-5 · Cited by 97
How to design a single-cell RNA-sequencing experiment: pitfalls, challenges and perspectives
Molin, A. D., & Camillo, B. D. (2018) · Briefings in Bioinformatics · doi:10.1093/bib/bby007 · Cited by 97
A single-cell atlas of Plasmodium falciparum transmission through the mosquito
Real, E., Howick, V. M., Dahalan, F. A., Witmer, K., Cudini, J., Andradi-Brown, C., Blight, J., Davidson, M. S., Dogga, S. K., Reid, A. J., et al. (2021) · Nature Communications · doi:10.1038/s41467-021-23434-z · Cited by 92
Liu, W., Liao, X., Yang, Y., Lin, H., Yeong, J. P.-S., Zhou, X., Shi, X., & Liu, J. (2022) · Nucleic Acids Research · doi:10.1093/nar/gkac219 · Cited by 95
A systematic performance evaluation of clustering methods for single-cell RNA-seq data
Duò, A., Robinson, M. D., & Soneson, C. (2018) · F1000Research · doi:10.12688/f1000research.15666.1 · Cited by 97
Thijssen, R., Tian, L., Anderson, M. A., Flensburg, C., Jarratt, A., Garnham, A. L., Jabbari, J. S., Peng, H., Lew, T. E., Teh, C. E., et al. (2022) · Blood · doi:10.1182/blood.2022016040 · Cited by 94
pDC-like cells are pre-DC2 and require KLF4 to control homeostatic CD4 T cells
Rodrigues, P. F., Kouklas, A., Cvijetic, G., Bouladoux, N. J., Mitrovic, M., Desai, J. V., Lima-Junior, D. S., Lionakis, M. S., Belkaid, Y., Ivánek, R., et al. (2023) · Science Immunology · doi:10.1126/sciimmunol.add4132 · Cited by 87
Serra, M., Alysandratos, K., Hawkins, F. J., McCauley, K. B., Jacob, A., Choi, J., Caballero, I. S., Vedaie, M., Kurmann, A. A., Ikonomou, L., et al. (2017) · Development · doi:10.1242/dev.150193 · Cited by 89
Nguyen, H. T., Bryois, J., Kim, A., Dobbyn, A. L., Huckins, L. M., Muñoz‐Manchado, A. B., Ruderfer, D. M., Genovese, G., Fromer, M., Xu, X., et al. (2017) · Genome Medicine · doi:10.1186/s13073-017-0497-y · Cited by 87
Interstitial Cell Remodeling Promotes Aberrant Adipogenesis in Dystrophic Muscles
Camps, J., Breuls, N., Sifrim, A., Giarratana, N., Corvelyn, M., Danti, L., Grosemans, H., Vanuytven, S., Thiry, I., Belicchi, M., et al. (2020) · Cell Reports · doi:10.1016/j.celrep.2020.107597 · Cited by 90
1-Methylnicotinamide is an immune regulatory metabolite in human ovarian cancer
Kilgour, M. K., MacPherson, S., Zacharias, L. G., Ellis, A. E., Sheldon, R. D., Liu, E. Y., Keyes, S., Pauly, B., Carleton, G. A., Allard, B., et al. (2021) · Science Advances · doi:10.1126/sciadv.abe1174 · Cited by 86
Cheng, J., Hu, Y., Kelly, D. E., Kim, J., Li, M., & Zhang, N. R. (2017) · Nucleic Acids Research · doi:10.1093/nar/gkx754 · Cited by 94
Computational Methods for Single-Cell RNA Sequencing
Hie, B., Peters, J. M., Nyquist, S. K., Shalek, A. K., Berger, B., & Bryson, B. D. (2020) · Annual Review of Biomedical Data Science · doi:10.1146/annurev-biodatasci-012220-100601 · Cited by 89
England, A. R., Chaney, C. P., Das, A., Patel, M., Malewska, A., Armendariz, D. A., Hon, G. C., Strand, D. W., Drake, K. A., & Carroll, T. J. (2020) · Development · doi:10.1242/dev.190108 · Cited by 85
Yu, Y., Zhang, B., Ji, P., Zuo, Z., Huang, Y., Wang, N., Liu, C., Liu, S., & Zhao, F. (2022) · Nature Communications · doi:10.1038/s41467-022-28746-2 · Cited by 92
Schwengers, O., Hoek, A., Fritzenwanker, M., Falgenhauer, L., Hain, T., Chakraborty, T., & Goesmann, A. (2020) · PLoS Computational Biology · doi:10.1371/journal.pcbi.1007134 · Cited by 87
Tempora: Cell trajectory inference using time-series single-cell RNA sequencing data
Tran, T. N., & Bader, G. D. (2020) · PLoS Computational Biology · doi:10.1371/journal.pcbi.1008205 · Cited by 82
A single-cell morpho-transcriptomic map of brassinosteroid action in the Arabidopsis root
Graeff, M., Rana, S., Wendrich, J. R., Dorier, J., Eekhout, T., Fandino, A. C. A., Guex, N., Bassel, G. W., Rybel, B. D., & Hardtke, C. S. (2021) · Molecular Plant · doi:10.1016/j.molp.2021.07.021 · Cited by 87
Delineating mouse β-cell identity during lifetime and in diabetes with a single cell atlas
Hrovatin, K., Bastidas-Ponce, A., Bakhti, M., Zappia, L., Büttner, M., Salinno, C., Sterr, M., Böttcher, A., Migliorini, A., Lickert, H., et al. (2023) · Nature Metabolism · doi:10.1038/s42255-023-00876-x · Cited by 89
Bach, K., Pensa, S., Zarocsinceva, M., Kania, K., Stockis, J., Pinaud, S., Lazarus, K. A., Shehata, M., Simões, B. M., Greenhalgh, A., et al. (2021) · Nature Communications · doi:10.1038/s41467-021-21783-3 · Cited by 86
Self-citationWhat are the applications of single-cell RNA sequencing in cancer research: a systematic review
Li, L., Xiong, F., Wang, Y., Zhang, S., Gong, Z., Li, X., He, Y., Shi, L., Wang, F., Liao, Q., et al. (2021) · Journal of Experimental & Clinical Cancer Research · doi:10.1186/s13046-021-01955-1 · Cited by 89
Lang, N. J., Gote-Schniering, J., Porras-Gonzalez, D., Yang, L., Sadeleer, L. D., Jentzsch, R. C., Shitov, V. A., Zhou, S., Ansari, M., Agami, A., et al. (2023) · Science Translational Medicine · doi:10.1126/scitranslmed.adh0908 · Cited by 101
Immune responses in checkpoint myocarditis across heart, blood and tumour
Blum, S. M., Zlotoff, D. A., Smith, N. P., Kernin, I., Ramesh, S., Zubiri, L., Caplin, J., Samanta, N., Martin, S., Wang, M., et al. (2024) · Nature · doi:10.1038/s41586-024-08105-5 · Cited by 104
Xie, J., Ma, A., Fennell, A. Y., Ma, Q., & Zhao, J. (2018) · Briefings in Bioinformatics · doi:10.1093/bib/bby014 · Cited by 83
Bayesian inference of gene expression states from single-cell RNA-seq data
Breda, J., Zavolan, M., & van Nimwegen, E. (2021) · Nature Biotechnology · doi:10.1038/s41587-021-00875-x · Cited by 92
SpotClean adjusts for spot swapping in spatial transcriptomics data
Ni, Z., Prasad, A., Chen, S., Halberg, R. B., Arkin, L. M., Drolet, B. A., Newton, M. A., & Kendziorski, C. M. (2022) · Nature Communications · doi:10.1038/s41467-022-30587-y · Cited by 83
Thomas, M. F., Slowikowski, K., Manakongtreecheep, K., Sen, P., Samanta, N., Tantivit, J., Nasrallah, M., Zubiri, L., Smith, N. P., Tirard, A. J., et al. (2024) · Nature Medicine · doi:10.1038/s41591-024-02895-x · Cited by 94
Kiviaho, A., Eerola, S. K., Kallio, H. M. L., Andersen, M. K., Hoikka, M., Tiihonen, A. M., Salonen, I., Spotbeen, X., Giesen, A., Parker, C. T. A., et al. (2024) · Nature Communications · doi:10.1038/s41467-024-54364-1 · Cited by 97
Evaluating stably expressed genes in single cells
Lin, Y., Ghazanfar, S., Strbenac, D., Wang, A., Patrick, E., Lin, D. M., Speed, T., Yang, J. Y. H., & Yang, P. (2019) · GigaScience · doi:10.1093/gigascience/giz106 · Cited by 84
Sampling time-dependent artifacts in single-cell genomics studies
Massoni-Badosa, R., Iacono, G., Moutinho, C., Kulis, M., Palau, N., Marchese, D., Rodríguez‐Ubreva, J., Ballestar, E., Rodríguez-Esteban, G., Marsal, S., et al. (2020) · Genome biology · doi:10.1186/s13059-020-02032-0 · Cited by 84
Single‐cell molecular profiling provides a high‐resolution map of basophil and mast cell development
Hamey, F., Lau, W. W. Y., Kuciński, I., Wang, X., Diamanti, E., Wilson, N. K., Göttgens, B., & Dahlin, J. S. (2020) · Allergy · doi:10.1111/all.14633 · Cited by 84
López, J. P., Brivio, E., Santambrogio, A., Donno, C. D., Kos, A., Peters, M., Rost, N., Czamara, D., Brückl, T. M., Roeh, S., et al. (2021) · Science Advances · doi:10.1126/sciadv.abe4497 · Cited by 85
Vicković, S., Schapiro, D., Carlberg, K., Lötstedt, B., Larsson, L., Hildebrandt, F., Korotkova, M., Hensvold, A. H., Catrina, A. I., Sorger, P. K., et al. (2022) · Communications Biology · doi:10.1038/s42003-022-03050-3 · Cited by 91
Adult skull bone marrow is an expanding and resilient haematopoietic reservoir
Koh, B. I., Mohanakrishnan, V., Jeong, H., Park, H., Kruse, K., Choi, Y. J., Nieminen-Kelhä, M., Kumar, R., Pereira, R. S., Adams, S., et al. (2024) · Nature · doi:10.1038/s41586-024-08163-9 · Cited by 90
Gan, S., Macalinao, D. G., Shahoei, S. H., Tian, L. H., Jin, X., Basnet, H., Bibby, C., Muller, J., Atri, P., Seffar, E., et al. (2024) · Cancer Cell · doi:10.1016/j.ccell.2024.08.015 · Cited by 96
Wegmann, R., Neri, M., Schuierer, S., Bilican, B., Hartkopf, H., Nigsch, F., Mapa, F., Waldt, A., Cuttat, R., Salick, M. R., et al. (2019) · Genome biology · doi:10.1186/s13059-019-1739-7 · Cited by 77
Microglia protect against age-associated brain pathologies
Munro, D. A. D., Bestard-Cuche, N., McQuaid, C., Chagnot, A., Shabestari, S. K., Chadarevian, J. P., Maheshwari, U., Szymkowiak, S., Morris, K., Mohammad, M., et al. (2024) · Neuron · doi:10.1016/j.neuron.2024.05.018 · Cited by 84
Sexually Dimorphic Crosstalk at the Maternal-Fetal Interface
Sun, T., Gonzalez, T. L., Deng, N., DiPentino, R., Clark, E. L., Lee, B., Tang, J., Wang, Y., Stripp, B. R., Yao, C., et al. (2020) · The Journal of Clinical Endocrinology & Metabolism · doi:10.1210/clinem/dgaa503 · Cited by 80
Hepatocellular senescence induces multi-organ senescence and dysfunction via TGFβ
Kiourtis, C., Terradas-Terradas, M., Gee, L., May, S., Γεωργακοπούλου, Α., Collins, A., O'Sullivan, E. D., Baird, D., Hassan, M., Shaw, R., et al. (2024) · Nature Cell Biology · doi:10.1038/s41556-024-01543-3 · Cited by 91
Yekelchyk, M., Günther, S., Preussner, J., & Braun, T. W. (2019) · Basic Research in Cardiology · doi:10.1007/s00395-019-0744-z · Cited by 83
bigSCale: an analytical framework for big-scale single-cell data
Iacono, G., Mereu, E., Guillaumet-Adkins, A., Corominas, R., Cuscó, I., Rodríguez-Esteban, G., Gut, M., Pérez-Jurado, L. A., Gut, I., & Heyn, H. (2018) · Genome Research · doi:10.1101/gr.230771.117 · Cited by 79
Ketamine exerts its sustained antidepressant effects via cell-type-specific regulation of Kcnq2
López, J. P., Luecken, M. D., Brivio, E., Karamihalev, S., Kos, A., Donno, C. D., Benjamin, A., Yang, H., Dick, A. L. W., Stoffel, R., et al. (2022) · Neuron · doi:10.1016/j.neuron.2022.05.001 · Cited by 85
Multi-site Neurogenin3 Phosphorylation Controls Pancreatic Endocrine Differentiation
Azzarelli, R., Hurley, C., Sznurkowska, M. K., Rulands, S., Hardwick, L. J. A., Gamper, I., Ali, F. R., McCracken, L., Hindley, C. J., McDuff, F. K. E., et al. (2017) · Developmental Cell · doi:10.1016/j.devcel.2017.04.004 · Cited by 78
Optimizing expression quantitative trait locus mapping workflows for single-cell studies
Cuomo, A. S. E., Alvari, G., Azodi, C. B. D., McCarthy, D. J., & Bonder, M. J. (2021) · Genome biology · doi:10.1186/s13059-021-02407-x · Cited by 73
A statistical simulator scDesign for rational scRNA-seq experimental design
Li, W. V., & Li, J. J. (2019) · Bioinformatics · doi:10.1093/bioinformatics/btz321 · Cited by 74
Reciprocal transcription factor networks govern tissue-resident ILC3 subset function and identity
Fiancette, R., Finlay, C. M., Willis, C., Bevington, S. L., Soley, J. K., Ng, S. T. H., Baker, S. M., Andrews, S., Hepworth, M. R., & Withers, D. R. (2021) · Nature Immunology · doi:10.1038/s41590-021-01024-x · Cited by 76
The promise of single-cell RNA sequencing for kidney disease investigation
Wu, H., & Humphreys, B. D. (2017) · Kidney International · doi:10.1016/j.kint.2017.06.033 · Cited by 73
Analysis and Visualization of Spatial Transcriptomic Data
Liu, B., Li, Y., & Zhang, L. (2022) · Frontiers in Genetics · doi:10.3389/fgene.2021.785290 · Cited by 73
Deep learning tackles single-cell analysis—a survey of deep learning for scRNA-seq analysis
Flores, M. A., Liu, Z., Zhang, T., Hasib, M. M., Chiu, Y., Ye, Z., Paniagua, K., Jo, S., Zhang, J., Gao, S., et al. (2021) · Briefings in Bioinformatics · doi:10.1093/bib/bbab531 · Cited by 73
Phagocytosis increases an oxidative metabolic and immune suppressive signature in tumor macrophages
Gonzalez, M. A., Lu, D., Yousefi, M., Kroll, A. V., Lo, C. H., Briseño, C. G., Watson, J. E. V., Novitskiy, S. V., Arias, V., Zhou, H., et al. (2023) · The Journal of Experimental Medicine · doi:10.1084/jem.20221472 · Cited by 75
Alveolar Differentiation Drives Resistance to KRAS Inhibition in Lung Adenocarcinoma
Li, Z., Zhuang, X., Pan, C.-H., Yan, Y., Thummalapalli, R., Hallin, J., Torborg, S., Singhal, A., Chang, J. C., Manchado, E., et al. (2024) · Cancer Discovery · doi:10.1158/2159-8290.cd-23-0289 · Cited by 74
Gene length and detection bias in single cell RNA sequencing protocols
Phipson, B., Zappia, L., & Oshlack, A. (2017) · F1000Research · doi:10.12688/f1000research.11290.1 · Cited by 74
Untereiner, A. A., Abdo, S., Bhattacharjee, A., Gohil, H., Pourasgari, F., Ibeh, N., Lai, M., Batchuluun, B., Wong, A., Khuu, N., et al. (2018) · The FASEB Journal · doi:10.1096/fj.201801397r · Cited by 72
Tyler, M. P. H., & Tirosh, I. (2021) · Nature Communications · doi:10.1038/s41467-021-22800-1 · Cited by 77
SC-MEB: spatial clustering with hidden Markov random field using empirical Bayes
Yang, Y., Shi, X., Liu, W., Zhou, Q., Lau, M. C., Lim, J. C. T., Sun, L., Ng, C. C. Y., Yeong, J. P.-S., & Liu, J. (2021) · Briefings in Bioinformatics · doi:10.1093/bib/bbab466 · Cited by 75
Benchmarking UMI-based single-cell RNA-seq preprocessing workflows
You, Y., Tian, L., Su, S., Dong, X., Jabbari, J. S., Hickey, P. F., & Ritchie, M. E. (2021) · Genome biology · doi:10.1186/s13059-021-02552-3 · Cited by 77
Fasting reshapes tissue-specific niches to improve NK cell-mediated anti-tumor immunity
Delconte, R. B., Owyong, M., Santosa, E. K., Srpan, K., Sheppard, S., McGuire, T. J., Abbasi, A. J., Díaz-Salazar, C., Chun, J. J. M., Rogatsky, I., et al. (2024) · Immunity · doi:10.1016/j.immuni.2024.05.021 · Cited by 73
Cardelino: computational integration of somatic clonal substructure and single-cell transcriptomes
McCarthy, D. J., Rostom, R., Huang, Y., Kunz, D. J., Danecek, P., Bonder, M. J., Hagai, T., Lyu, R., Wang, W., Gaffney, D. J., et al. (2020) · Nature Methods · doi:10.1038/s41592-020-0766-3 · Cited by 78
Briggs, E. M., Rojas, F., McCulloch, R., Matthews, K. R., & Otto, T. D. (2021) · Nature Communications · doi:10.1038/s41467-021-25607-2 · Cited by 67
Edahiro, R., Shirai, Y., Takeshima, Y., Sakakibara, S., Yamaguchi, Y., Murakami, T., Morita, T., Kato, Y., Liu, Y., Motooka, D., et al. (2023) · Nature Genetics · doi:10.1038/s41588-023-01375-1 · Cited by 69
Durán, R. C., González-Orozco, J. C., Velasco, I., & Wu, J. Q. (2022) · Frontiers in Cell and Developmental Biology · doi:10.3389/fcell.2022.884748 · Cited by 64
A biomechanical switch regulates the transition towards homeostasis in oesophageal epithelium
McGinn, J., Hallou, A., Han, S., Krizic, K., Ulyanchenko, S., Iglesias‐Bartolomé, R., England, F. J., Verstreken, C. M., Chalut, K. J., Jensen, K. B., et al. (2021) · Nature Cell Biology · doi:10.1038/s41556-021-00679-w · Cited by 63
Subcellular proteomics of dopamine neurons in the mouse brain
Hobson, B. D., Choi, S. J., Mosharov, E. V., Soni, R. K., Sulzer, D., & Sims, P. A. (2022) · eLife · doi:10.7554/elife.70921 · Cited by 68
Single-cell gene regulatory network prediction by explainable AI
Keyl, P., Bischoff, P., Dernbach, G., Bockmayr, M. L., Fritz, R., Horst, D. A., Blüthgen, N., Montavon, G., Müller, K., & Klauschen, F. (2022) · Nucleic Acids Research · doi:10.1093/nar/gkac1212 · Cited by 72
Ageing limits stemness and tumorigenesis by reprogramming iron homeostasis
Zhuang, X., Wang, Q., Joost, S., Ferrena, A., Humphreys, D. T., Li, Z., Blum, M., Krause, K., Ding, S., Landais, Y., et al. (2024) · Nature · doi:10.1038/s41586-024-08285-0 · Cited by 71
SPARSim single cell: a count data simulator for scRNA-seq data
Baruzzo, G., Patuzzi, I., & Camillo, B. D. (2019) · Bioinformatics · doi:10.1093/bioinformatics/btz752 · Cited by 63
Weng, C., Xi, J., Li, H., Cui, J., Gu, A., Lai, S., Leskov, K., Ke, L., Jin, F., & Li, Y. (2020) · Nature Metabolism · doi:10.1038/s42255-020-00314-2 · Cited by 65
Capybara: A computational tool to measure cell identity and fate transitions
Kong, W., Fu, Y. C., Holloway, E. M., Garipler, G., Yang, X., Mazzoni, E. O., & Morris, S. A. (2022) · Cell stem cell · doi:10.1016/j.stem.2022.03.001 · Cited by 65
Fate mapping of hematopoietic stem cells reveals two pathways of native thrombopoiesis
Morcos, M. N. F., Li, C., Munz, C. M., Greco, A., Dressel, N., Reinhardt, S., Sameith, K., Dahl, A., Becker, N. B., Roers, A., et al. (2022) · Nature Communications · doi:10.1038/s41467-022-31914-z · Cited by 70
Xie, J., Ma, A., Zhang, Y., Liu, B., Cao, S., Wang, C., Xu, J., Zhang, C., & Ma, Q. (2019) · Bioinformatics · doi:10.1093/bioinformatics/btz692 · Cited by 76
Accurate feature selection improves single-cell RNA-seq cell clustering
Su, K., Yu, T., & Wu, H. (2021) · Briefings in Bioinformatics · doi:10.1093/bib/bbab034 · Cited by 68
Fanti, A.-K., Busch, K., Greco, A., Wang, X., Cirovic, B., Shang, F., Nizharadze, T., Frank, L., Barile, M., Feyerabend, T. B., et al. (2023) · Cell stem cell · doi:10.1016/j.stem.2022.12.014 · Cited by 64
Single‐cell RNA‐sequencing of the brain
Durán, R. C., Wei, H., & Wu, J. Q. (2017) · Clinical and Translational Medicine · doi:10.1186/s40169-017-0150-9 · Cited by 64
Lu, Y., Jia, L., Zheng, Z., Tran, E., Robbins, P. F., & Rosenberg, S. A. (2019) · Cancer Immunology Research · doi:10.1158/2326-6066.cir-19-0299 · Cited by 62
Transcriptional Profiling of Individual Airway Projecting Vagal Sensory Neurons
Mazzone, S. B., Tian, L., Moe, A. A. K., Trewella, M. W., Ritchie, M. E., & McGovern, A. E. (2019) · Molecular Neurobiology · doi:10.1007/s12035-019-01782-8 · Cited by 64
Metadata
- Authors
- L. Lun, A. T., Bach, K., & Marioni, J. C.
- Affiliations
- European Bioinformatics Institute (GB)
- Corresponding author
- Marioni, John C.
- Venue
- Genome Biology
- Published
- 2016-04-27
- Volume
- 17
- Issue
- 1
- Pages
- 75-75
- ISSN
- 1465-6906 (ISSN-L)
- 1474-760X
- PMC
- PMC4848819
- OpenAlex
- W2343956310
- Cited by
- 1,108
- References
- 27
- Citations by year
- 2026: 58 · 2025: 95 · 2024: 129 · 2023: 135 · 2022: 134 · 2021: 149 · 2020: 146 · 2019: 102 · 2018: 93 · 2017: 49 · 2016: 17
- FWCI
- 45.23
- Type
- journal article
- Language
- en
- Open access
- gold
- doi.org
- Licence
- cc-by
- Locations
- Genome biology (publishedVersion, cc-by)
- Europe PMC (PubMed Central) (publishedVersion, cc-by)
- PubMed Central (publishedVersion, cc-by)
- PubMed (publishedVersion)
- Apollo (University of Cambridge) (submittedVersion, cc-by)
- Funders
- Cancer Research UK (GB) (SW73)
- Topics
- Life Sciences › Biochemistry, Genetics and Molecular Biology › Molecular Biology › Single-cell and spatial transcriptomics
- Life Sciences › Biochemistry, Genetics and Molecular Biology › Molecular Biology › Gene expression and cancer classification
- Life Sciences › Biochemistry, Genetics and Molecular Biology › Molecular Biology › Genomics and Phylogenetic Studies
- Keywords
- single-cell RNA sequencing, data normalization, zero counts, size factor, deconvolution
- MeSH terms
- Algorithms, Animals, Calibration, Humans, Sequence Analysis, RNA, Gene Expression Profiling, Single-Cell Analysis, Signal-To-Noise Ratio
About these checks
Registry, retraction, Cites and statistics results are computed, not judged, with one exception: a printed reference that no index lists is read once by a model before it counts as a citation error. Claims are extracted by a model and kept only when their quote appears verbatim in the text; each cited source is then checked, with a model’s help, for whether it says what the claim relies on. Those verdicts can be wrong — read the claim’s quote and the cited source before relying on one.
Statistics and arithmetic are recomputed, not judged.
Confidence bands are shown only for fields calibrated on our annotated test set. None is calibrated yet, so no band is shown.
What counts as a claim ›How we measure confidence ›How we check this ›
Are you an author, or do you see a problem with this page? Request a review
