

The DOI matches its Crossref record; 75 of the 75 references it cites were found in a registry or an index.
A statistical approach for identifying differential distributions in single-cell RNA-seq experiments
Open accessPublished version of a preprint
Abstract
Abstract The ability to quantify cellular heterogeneity is a major advantage of single-cell technologies. Although understanding such heterogeneity is of primary interest in a number of studies, for convenience, statistical methods often treat cellular heterogeneity as a nuisance factor. We present a novel method to characterize differences in expression in the presence of distinct expression states within and among biological conditions. Using simulated and case study data, we demonstrate that the modeling framework is able to detect differential expression patterns of interest under a wide range of settings. Compared to existing approaches, scDD has higher power to detect subtle differences in gene expression distributions that are more complex than a mean shift, and is able to characterize those differences. The freely available R package scDD implements the approach.
Overview
The claims and statistics of this paper haven’t been checked yet.
Run the check — free, no account needed. It reads the open-access text and checks the sources it cites.
Integrity signals
Registry
Cites
Statistics
Figures
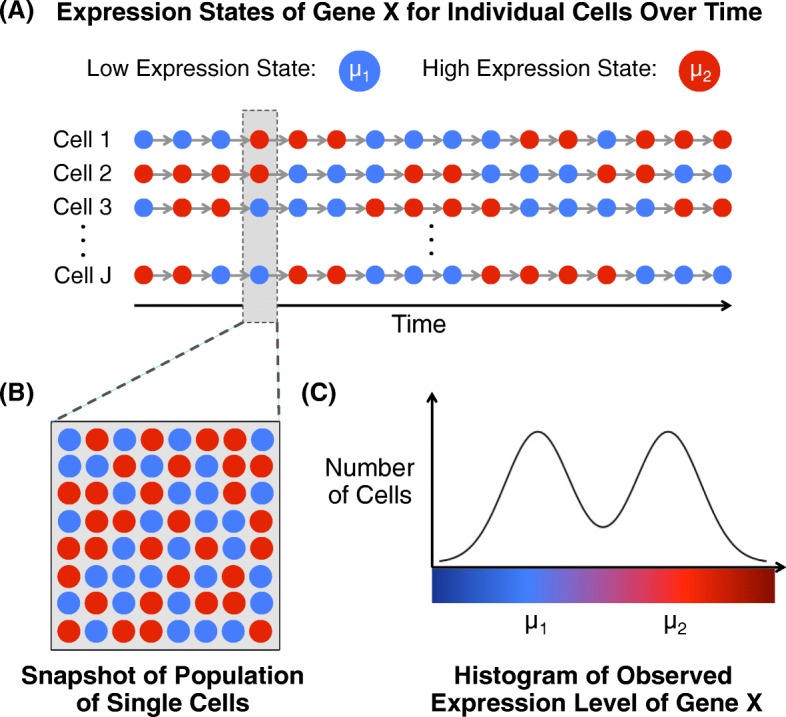
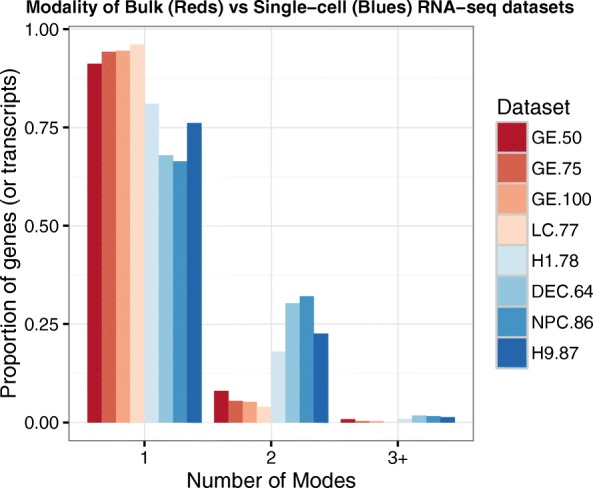
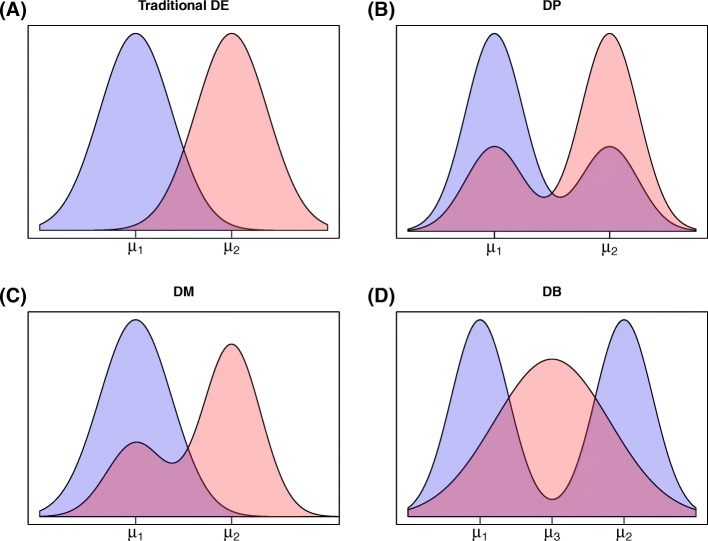
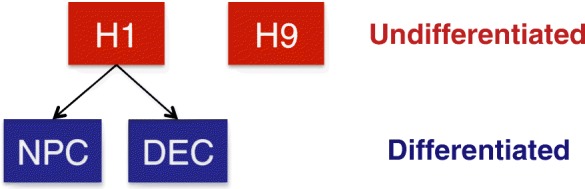
Verification
Claims the paper makes
The claims and statistics of this paper haven’t been checked yet.
Run the check — free, no account needed. It reads the open-access text and checks the sources it cites.
Claims other papers make about this one
Each is checked against this paper’s own text: does it say what the citing paper says it does?
The cited source says what the claim attributes to it.
In the citing paper
“Furthermore, papers evaluating the performance of single-cell-specific tools all compute the simulations as if cells were independent15–21.”
From A practical solution to pseudoreplication bias in single-cell studies (2021) · cites this paper as [18]
Self-check
Percentages, sums and reported differences re-computed from the paper’s own numbers.
The self-check needs the paper’s full text.
Citations
Cites
R: A Language and Environment for Statistical Computing
R Core Team (2000) · doi:10.32614/r.manuals · Cited by 355,893
Controlling the False Discovery Rate: A Practical and Powerful Approach to Multiple Testing
Benjamini, Y., & Hochberg, Y. (1995) · Journal of the Royal Statistical Society Series B: Statistical Methodology · doi:10.1111/j.2517-6161.1995.tb02031.x · Cited by 109,482
RSEM: accurate transcript quantification from RNA-Seq data with or without a reference genome
Li, B., & Dewey, C. N. (2011) · BMC Bioinformatics · doi:10.1186/1471-2105-12-323 · Cited by 22,179
Hierarchical Grouping to Optimize an Objective Function
Ward, J. H. (1963) · Journal of the American Statistical Association · doi:10.1080/01621459.1963.10500845 · Cited by 21,341
Differential expression analysis for sequence count data
Anders, S., & Huber, W. (2010) · Genome Biology · doi:10.1186/gb-2010-11-10-r106 · Cited by 15,581
Gene Expression Omnibus: NCBI gene expression and hybridization array data repository
Edgar, R. (2002) · Nucleic Acids Research · doi:10.1093/nar/30.1.207 · Cited by 13,288
Trapnell, C., Cacchiarelli, D., Grimsby, J., Pokharel, P., Li, S., Morse, M., Lennon, N. J., Livak, K. J., Mikkelsen, T. S., & Rinn, J. L. (2014) · Nature Biotechnology · doi:10.1038/nbt.2859 · Cited by 7,314
voom: precision weights unlock linear model analysis tools for RNA-seq read counts
Law, C. W., Chen, Y., Shi, W., & Smyth, G. K. (2014) · Genome Biology · doi:10.1186/gb-2014-15-2-r29 · Cited by 6,155
Single-cell RNA-seq highlights intratumoral heterogeneity in primary glioblastoma
Patel, A. P., Tirosh, I., Trombetta, J. J., Shalek, A. K., Gillespie, S. M., Wakimoto, H., Cahill, D. P., Nahed, B. V., Curry, W. T., Martuza, R. L., et al. (2014) · Science · doi:10.1126/science.1254257 · Cited by 5,063
Hierarchical Grouping to Optimize an Objective Function
Ward, J. H. (1963) · Journal of the American Statistical Association · doi:10.2307/2282967 · Cited by 3,294
Cited by
Sorted by citations
Scenic: single-cell regulatory network inference and clustering.
Aibar, S., González-Blas, C. B., Moerman, T., Huynh-Thu, V. A., Imrichova, H., Hulselmans, G., Rambow, F., Marine, J.-C., Geurts, P., Aerts, J., et al. (2017) · Nature Methods · doi:10.1038/nmeth.4463 · Cited by 6,520
McCarthy, D. J., Campbell, K. R., Lun, A. T. L., & Wills, Q. F. (2017) · Bioinformatics · doi:10.1093/bioinformatics/btw777 · Cited by 1,852
Eleven grand challenges in single-cell data science
Lähnemann, D., Köster, J., Szczurek, E., McCarthy, D. J., Hicks, S. C., Robinson, M. D., Vallejos, C. A., Campbell, K. R., Beerenwinkel, N., Mahfouz, A., et al. (2020) · Genome Biology · doi:10.1186/s13059-020-1926-6 · Cited by 1,327
Orchestrating single-cell analysis with Bioconductor
Amezquita, R. A., Lun, A. T. L., Becht, E., Carey, V. J., Carpp, L. N., Geistlinger, L., Marini, F., Rue-Albrecht, K., Risso, D., Soneson, C., et al. (2020) · Nature Methods · doi:10.1038/s41592-019-0654-x · Cited by 945
Splatter: simulation of single-cell RNA sequencing data
Zappia, L., Phipson, B., & Oshlack, A. (2017) · Genome Biology · doi:10.1186/s13059-017-1305-0 · Cited by 905
Metadata
- Authors
- Korthauer, K. D., Chu, L.-F., Newton, M. A., Li, Y., Thomson, J., Stewart, R., & Kendziorski, C.
- Affiliations
- Harvard University (US)
- University of Wisconsin–Madison (US)
- University of Wisconsin System (US)
- Venue
- Genome Biology
- Published
- 2016-10-25
- Volume
- 17
- Issue
- 1
- Pages
- 222-222
- ISSN
- 1465-6906 (ISSN-L)
- 1474-760X
- PMC
- PMC5080738
- OpenAlex
- W2950541340
- Cited by
- 273
- References
- 73
- Citations by year
- 2026: 11 · 2025: 15 · 2024: 26 · 2023: 31 · 2022: 36 · 2021: 56 · 2020: 29 · 2019: 21 · 2018: 24 · 2017: 18 · 2016: 5
- FWCI
- 11.78
- Type
- journal article
- Language
- en
- Open access
- gold
- doi.org
- Locations
- Genome biology (publishedVersion, cc-by)
- bioRxiv (Cold Spring Harbor Laboratory) (acceptedVersion, cc-by-nc)
- Europe PMC (PubMed Central) (publishedVersion, cc-by)
- PubMed Central (publishedVersion, cc-by)
- PubMed (publishedVersion)
- Digital Access to Scholarship at Harvard (DASH) (Harvard University) (submittedVersion, cc-by)
- Funders
- National Institute of General Medical Sciences (GM102756)
- National Institute of Allergy and Infectious Diseases (U54AI117924)
- National Institutes of Health (4UH3TR000506-03)
- National Heart, Lung, and Blood Institute (5U01HL099773-06)
- Topics
- Life Sciences › Biochemistry, Genetics and Molecular Biology › Molecular Biology › Single-cell and spatial transcriptomics
- Life Sciences › Biochemistry, Genetics and Molecular Biology › Molecular Biology › Gene expression and cancer classification
- Life Sciences › Biochemistry, Genetics and Molecular Biology › Molecular Biology › Genomics and Phylogenetic Studies
- Keywords
- differential gene expression, single-cell RNA sequencing, gene expression distribution, cellular heterogeneity
- MeSH terms
- Algorithms, Humans, RNA, Software, Sequence Analysis, RNA, Computational Biology, Gene Expression Profiling, Single-Cell Analysis, High-Throughput Nucleotide Sequencing
About these checks
Registry, retraction, Cites and statistics results are computed, not judged, with one exception: a printed reference that no index lists is read once by a model before it counts as a citation error. Claims are extracted by a model and kept only when their quote appears verbatim in the text; each cited source is then checked, with a model’s help, for whether it says what the claim relies on. Those verdicts can be wrong — read the claim’s quote and the cited source before relying on one.
Statistics and arithmetic are recomputed, not judged.
Confidence bands are shown only for fields calibrated on our annotated test set. None is calibrated yet, so no band is shown.
What counts as a claim ›How we measure confidence ›How we check this ›
Are you an author, or do you see a problem with this page? Request a review
