

The DOI matches its Crossref record; 75 of the 75 references it cites were found in a registry or an index.
A statistical approach for identifying differential distributions in single-cell RNA-seq experiments
Open accessPublished version of a preprint
Abstract
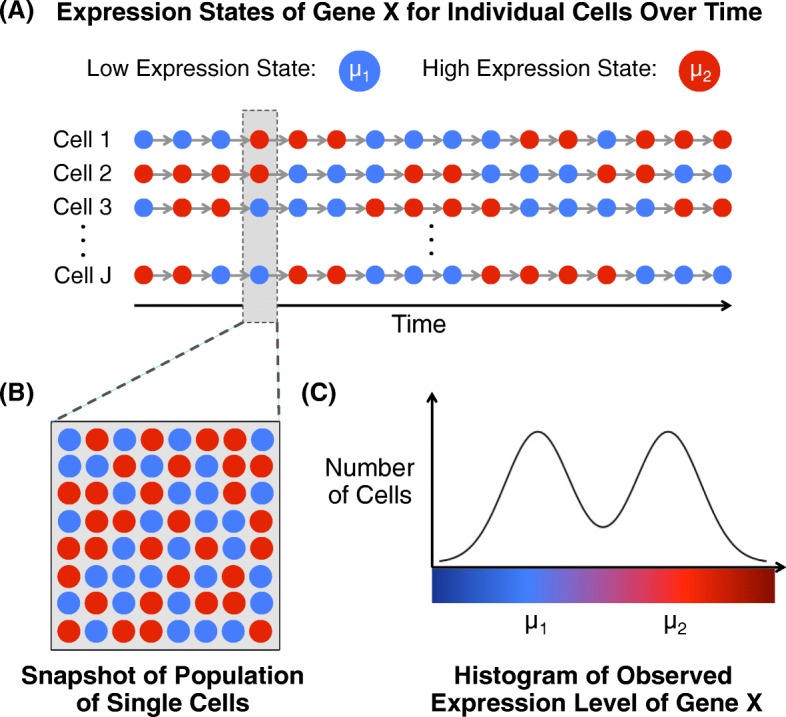
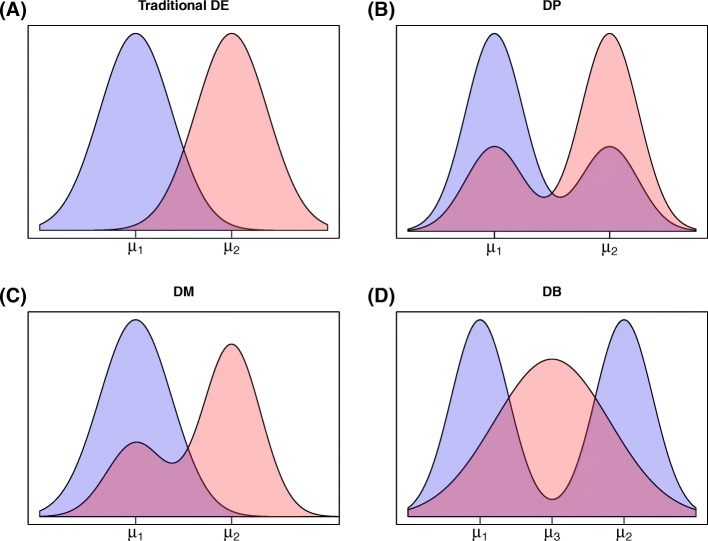
Abstract The ability to quantify cellular heterogeneity is a major advantage of single-cell technologies. Although understanding such heterogeneity is of primary interest in a number of studies, for convenience, statistical methods often treat cellular heterogeneity as a nuisance factor. We present a novel method to characterize differences in expression in the presence of distinct expression states within and among biological conditions. Using simulated and case study data, we demonstrate that the modeling framework is able to detect differential expression patterns of interest under a wide range of settings. Compared to existing approaches, scDD has higher power to detect subtle differences in gene expression distributions that are more complex than a mean shift, and is able to characterize those differences. The freely available R package scDD implements the approach.
Overview
The claims and statistics of this paper haven’t been checked yet.
Run the check — free, no account needed. It reads the open-access text and checks the sources it cites.
Integrity signals
Registry
Cites
Statistics
Figures
Verification
Claims the paper makes
The claims and statistics of this paper haven’t been checked yet.
Run the check — free, no account needed. It reads the open-access text and checks the sources it cites.
Claims other papers make about this one
Each is checked against this paper’s own text: does it say what the citing paper says it does?
The cited source says what the claim attributes to it.
In the citing paper
“Furthermore, papers evaluating the performance of single-cell-specific tools all compute the simulations as if cells were independent15–21.”
From A practical solution to pseudoreplication bias in single-cell studies (2021) · cites this paper as [18]
Self-check
Percentages, sums and reported differences re-computed from the paper’s own numbers.
The self-check needs the paper’s full text.
Citations
Cites
R: A Language and Environment for Statistical Computing
R Core Team (2000) · doi:10.32614/r.manuals · Cited by 355,893
Controlling the False Discovery Rate: A Practical and Powerful Approach to Multiple Testing
Benjamini, Y., & Hochberg, Y. (1995) · Journal of the Royal Statistical Society Series B: Statistical Methodology · doi:10.1111/j.2517-6161.1995.tb02031.x · Cited by 109,482
RSEM: accurate transcript quantification from RNA-Seq data with or without a reference genome
Li, B., & Dewey, C. N. (2011) · BMC Bioinformatics · doi:10.1186/1471-2105-12-323 · Cited by 22,179
Hierarchical Grouping to Optimize an Objective Function
Ward, J. H. (1963) · Journal of the American Statistical Association · doi:10.1080/01621459.1963.10500845 · Cited by 21,341
Differential expression analysis for sequence count data
Anders, S., & Huber, W. (2010) · Genome Biology · doi:10.1186/gb-2010-11-10-r106 · Cited by 15,581
Gene Expression Omnibus: NCBI gene expression and hybridization array data repository
Edgar, R. (2002) · Nucleic Acids Research · doi:10.1093/nar/30.1.207 · Cited by 13,288
Trapnell, C., Cacchiarelli, D., Grimsby, J., Pokharel, P., Li, S., Morse, M., Lennon, N. J., Livak, K. J., Mikkelsen, T. S., & Rinn, J. L. (2014) · Nature Biotechnology · doi:10.1038/nbt.2859 · Cited by 7,314
voom: precision weights unlock linear model analysis tools for RNA-seq read counts
Law, C. W., Chen, Y., Shi, W., & Smyth, G. K. (2014) · Genome Biology · doi:10.1186/gb-2014-15-2-r29 · Cited by 6,155
Single-cell RNA-seq highlights intratumoral heterogeneity in primary glioblastoma
Patel, A. P., Tirosh, I., Trombetta, J. J., Shalek, A. K., Gillespie, S. M., Wakimoto, H., Cahill, D. P., Nahed, B. V., Curry, W. T., Martuza, R. L., et al. (2014) · Science · doi:10.1126/science.1254257 · Cited by 5,063
Hierarchical Grouping to Optimize an Objective Function
Ward, J. H. (1963) · Journal of the American Statistical Association · doi:10.2307/2282967 · Cited by 3,294
Cited by
Sorted by citations
Scenic: single-cell regulatory network inference and clustering.
Aibar, S., González-Blas, C. B., Moerman, T., Huynh-Thu, V. A., Imrichova, H., Hulselmans, G., Rambow, F., Marine, J.-C., Geurts, P., Aerts, J., et al. (2017) · Nature Methods · doi:10.1038/nmeth.4463 · Cited by 6,520
McCarthy, D. J., Campbell, K. R., Lun, A. T. L., & Wills, Q. F. (2017) · Bioinformatics · doi:10.1093/bioinformatics/btw777 · Cited by 1,852
Eleven grand challenges in single-cell data science
Lähnemann, D., Köster, J., Szczurek, E., McCarthy, D. J., Hicks, S. C., Robinson, M. D., Vallejos, C. A., Campbell, K. R., Beerenwinkel, N., Mahfouz, A., et al. (2020) · Genome Biology · doi:10.1186/s13059-020-1926-6 · Cited by 1,327
Orchestrating single-cell analysis with Bioconductor
Amezquita, R. A., Lun, A. T. L., Becht, E., Carey, V. J., Carpp, L. N., Geistlinger, L., Marini, F., Rue-Albrecht, K., Risso, D., Soneson, C., et al. (2020) · Nature Methods · doi:10.1038/s41592-019-0654-x · Cited by 945
Splatter: simulation of single-cell RNA sequencing data
Zappia, L., Phipson, B., & Oshlack, A. (2017) · Genome Biology · doi:10.1186/s13059-017-1305-0 · Cited by 905
Bias, robustness and scalability in single-cell differential expression analysis
Soneson, C., & Robinson, M. D. (2018) · Nature Methods · doi:10.1038/nmeth.4612 · Cited by 770
SAVER: gene expression recovery for single-cell RNA sequencing
Huang, M. C., Wang, J., Torre, E. A., Dueck, H., Shaffer, S. M., Bonasio, R., Murray, J. I., Raj, A., Li, M., & Zhang, N. R. (2018) · Nature Methods · doi:10.1038/s41592-018-0033-z · Cited by 739
Missing data and technical variability in single-cell RNA-sequencing experiments
Hicks, S. C., Townes, F. W., Teng, M., & Irizarry, R. A. (2018) · Biostatistics · doi:10.1093/biostatistics/kxx053 · Cited by 635
Statistics or biology: the zero-inflation controversy about scRNA-seq data
Jiang, R., Sun, T., Song, D., & Li, J. J. (2022) · Genome Biology · doi:10.1186/s13059-022-02601-5 · Cited by 614
Gene Regulatory Network Inference from Single-Cell Data Using Multivariate Information Measures
Chan, T. E., Stumpf, M. P. H., & Babtie, A. C. (2017) · Cell Systems · doi:10.1016/j.cels.2017.08.014 · Cited by 578
Crowell, H. L., Soneson, C., Germain, P.-L., Calini, D., Collin, L., Raposo, C., Malhotra, D., & Robinson, M. D. (2020) · Nature Communications · doi:10.1038/s41467-020-19894-4 · Cited by 515
Design and computational analysis of single-cell RNA-sequencing experiments
Bacher, R. L., & Kendziorski, C. M. (2016) · Genome biology · doi:10.1186/s13059-016-0927-y · Cited by 460
Self-citationA practical guide to methods controlling false discoveries in computational biology
Korthauer, K., Kimes, P. K., Duvallet, C., Reyes, A., Subramanian, A., Teng, M., Shukla, C., Alm, E. J., & Hicks, S. C. (2019) · Genome Biology · doi:10.1186/s13059-019-1716-1 · Cited by 436
Self-citationA practical solution to pseudoreplication bias in single-cell studies
Zimmerman, K. D., Espeland, M. A., & Langefeld, C. D. (2021) · Nature Communications · doi:10.1038/s41467-021-21038-1 · Cited by 356
The triumphs and limitations of computational methods for scRNA-seq
Kharchenko, P. V. (2021) · Nature Methods · doi:10.1038/s41592-021-01171-x · Cited by 321
Exploring the single-cell RNA-seq analysis landscape with the scRNA-tools database
Zappia, L., Phipson, B., & Oshlack, A. (2018) · PLoS Computational Biology · doi:10.1371/journal.pcbi.1006245 · Cited by 319
Wang, T., Li, B., Nelson, C. E., & Nabavi, S. (2019) · BMC Bioinformatics · doi:10.1186/s12859-019-2599-6 · Cited by 286
“scDD [39] employs a Bayesian modeling framework to identify genes with differential distributions and to classify them into four situations: where f ( Y g | M DD ) is the predictive distribution of the observed expression value from gene g under a given hypothesis, M DD denotes the differential…”
BackgroundMethodTargeted Perturb-seq enables genome-scale genetic screens in single cells
Schraivogel, D., Gschwind, A. R., Milbank, J. H., Leonce, D. R., Jakob, P., Mathur, L., Korbel, J. O., Merten, C. A., Velten, L., & Steinmetz, L. M. (2020) · Nature Methods · doi:10.1038/s41592-020-0837-5 · Cited by 245
Chen, S., & Mar, J. C. (2018) · BMC Bioinformatics · doi:10.1186/s12859-018-2217-z · Cited by 235
Tutorial: guidelines for the experimental design of single-cell RNA sequencing studies
Lafzi, A., Moutinho, C., Picelli, S., & Heyn, H. (2018) · Nature Protocols · doi:10.1038/s41596-018-0073-y · Cited by 218
Evaluation of tools for highly variable gene discovery from single-cell RNA-seq data
Yip, S. H., Sham, P. C., & Wang, J. (2018) · Briefings in Bioinformatics · doi:10.1093/bib/bby011 · Cited by 201
Overcoming confounding plate effects in differential expression analyses of single-cell RNA-seq data
Lun, A. T. L., & Marioni, J. C. (2017) · Biostatistics · doi:10.1093/biostatistics/kxw055 · Cited by 159
powsimR: power analysis for bulk and single cell RNA-seq experiments
Vieth, B., Ziegenhain, C., Parekh, S., Enard, W., & Hellmann, I. (2017) · Bioinformatics · doi:10.1093/bioinformatics/btx435 · Cited by 155
Nawy, T. (2013) · Nature Methods · doi:10.1038/nmeth.2771 · Cited by 151
RNA Sequencing Data: Hitchhiker's Guide to Expression Analysis
den Berge, K. V., Hembach, K., Soneson, C., Tiberi, S., Clement, L., Love, M. I., Patro, R., & Robinson, M. D. (2019) · Annual Review of Biomedical Data Science · doi:10.1146/annurev-biodatasci-072018-021255 · Cited by 153
Single-Cell Transcriptomics: Current Methods and Challenges in Data Acquisition and Analysis
Adil, A., Kumar, V., Jan, A. T., & Asger, M. (2021) · Frontiers in Neuroscience · doi:10.3389/fnins.2021.591122 · Cited by 138
Gene expression distribution deconvolution in single-cell RNA sequencing
Wang, J., Huang, M. C., Torre, E. A., Dueck, H., Shaffer, S. M., Murray, J. I., Raj, A., Li, M., & Zhang, N. R. (2018) · Proceedings of the National Academy of Sciences · doi:10.1073/pnas.1721085115 · Cited by 123
Simulating multiple faceted variability in single cell RNA sequencing
Zhang, X., Xu, C. A., & Yosef, N. (2019) · Nature Communications · doi:10.1038/s41467-019-10500-w · Cited by 124
Nguyen, S., Deléage, C., Darko, S. W., Ransier, A., Truong, D. P., Agarwal, D., Japp, A. S., Wu, V. H., Kuri-Cervantes, L., Abdel‐Mohsen, M., et al. (2019) · Science Translational Medicine · doi:10.1126/scitranslmed.aax4077 · Cited by 116
scPipe: A flexible R/Bioconductor preprocessing pipeline for single-cell RNA-sequencing data
Tian, L., Su, S., Dong, X., Amann‐Zalcenstein, D., Biben, C., Seidi, A., Hilton, D. J., Naik, S. H., & Ritchie, M. E. (2018) · PLoS Computational Biology · doi:10.1371/journal.pcbi.1006361 · Cited by 121
Determining sequencing depth in a single-cell RNA-seq experiment
Zhang, M. J., Ntranos, V., & Tse, D. (2020) · Nature Communications · doi:10.1038/s41467-020-14482-y · Cited by 112
Sun, T., Song, D., Li, W. V., & Li, J. J. (2021) · Genome biology · doi:10.1186/s13059-021-02367-2 · Cited by 115
Junttila, S., Smolander, J., & Elo, L. L. (2022) · Briefings in Bioinformatics · doi:10.1093/bib/bbac286 · Cited by 109
scPower accelerates and optimizes the design of multi-sample single cell transcriptomic studies
Schmid, K. T., Höllbacher, B., Cruceanu, C., Böttcher, A., Lickert, H., Binder, E. B., Theis, F. J., & Heinig, M. (2021) · Nature Communications · doi:10.1038/s41467-021-26779-7 · Cited by 108
Computational approaches for interpreting sc RNA‐seq data
Rostom, R., Svensson, V., Teichmann, S. A., & Kar, G. (2017) · FEBS Letters · doi:10.1002/1873-3468.12684 · Cited by 107
Single-Cell RNA-Sequencing: Assessment of Differential Expression Analysis Methods
Dal Molin, A., Baruzzo, G., & Di Camillo, B. (2017) · Frontiers in Genetics · doi:10.3389/fgene.2017.00062 · Cited by 107
scRNASeqDB: A Database for RNA-Seq Based Gene Expression Profiles in Human Single Cells
Cao, Y., Zhu, J., Han, G., Jia, P., & Zhao, Z. (2017) · Genes · doi:10.3390/genes8120368 · Cited by 108
SERGIO: A Single-Cell Expression Simulator Guided by Gene Regulatory Networks
Dibaeinia, P., & Sinha, S. (2020) · Cell Systems · doi:10.1016/j.cels.2020.08.003 · Cited by 120
Wang, M., Song, W., Chen, M., Wang, Q., Zhou, X., Xu, P., Krek, A., Yoon, Y., Ho, L., Orr, M. E., et al. (2022) · Molecular Neurodegeneration · doi:10.1186/s13024-022-00517-z · Cited by 104
Eling, N., Richard, A. C., Richardson, S., Marioni, J. C., & Vallejos, C. A. (2018) · Cell Systems · doi:10.1016/j.cels.2018.06.011 · Cited by 99
Muñoz, J. F., Delorey, T., Ford, C. B., Li, B. Y., Thompson, D. A., Rao, R. P., & Cuomo, C. A. (2019) · Nature Communications · doi:10.1038/s41467-019-09599-8 · Cited by 89
High Throughput Single Cell RNA Sequencing, Bioinformatics Analysis and Applications
Huang, X., Liu, S., Wu, L. L., Jiang, M., & Hou, Y. (2018) · Advances in experimental medicine and biology · doi:10.1007/978-981-13-0502-3_4 · Cited by 87
Vandenbon, A., & Díez, D. (2020) · Nature Communications · doi:10.1038/s41467-020-17900-3 · Cited by 83
Feature selection revisited in the single-cell era
Yang, P., Huang, H. M., & Liu, C. (2021) · Genome biology · doi:10.1186/s13059-021-02544-3 · Cited by 87
Single-cell omics: experimental workflow, data analyses and applications
Sun, F., Li, H., Sun, D., Fu, S., Gu, L., Shao, X., Wang, Q., Dong, X., Duan, B., Xing, F., et al. (2024) · Science China Life Sciences · doi:10.1007/s11427-023-2561-0 · Cited by 90
bigSCale: an analytical framework for big-scale single-cell data
Iacono, G., Mereu, E., Guillaumet-Adkins, A., Corominas, R., Cuscó, I., Rodríguez-Esteban, G., Gut, M., Pérez-Jurado, L. A., Gut, I., & Heyn, H. (2018) · Genome Research · doi:10.1101/gr.230771.117 · Cited by 79
Current Trends of Microfluidic Single-Cell Technologies
Shinde, P., Mohan, L., Kumar, A. S., Dey, K., Maddi, A., Patananan, A. N., Tseng, F., Chang, H., Nagai, M., & Santra, T. S. (2018) · International Journal of Molecular Sciences · doi:10.3390/ijms19103143 · Cited by 79
Wegmann, R., Neri, M., Schuierer, S., Bilican, B., Hartkopf, H., Nigsch, F., Mapa, F., Waldt, A., Cuttat, R., Salick, M. R., et al. (2019) · Genome biology · doi:10.1186/s13059-019-1739-7 · Cited by 77
Song, D., & Li, J. J. (2021) · Genome biology · doi:10.1186/s13059-021-02341-y · Cited by 82
A benchmark study of simulation methods for single-cell RNA sequencing data
Cao, Y., Yang, P., & Yang, J. Y. H. (2021) · Nature Communications · doi:10.1038/s41467-021-27130-w · Cited by 76
A statistical simulator scDesign for rational scRNA-seq experimental design
Li, W. V., & Li, J. J. (2019) · Bioinformatics · doi:10.1093/bioinformatics/btz321 · Cited by 74
SPARSim single cell: a count data simulator for scRNA-seq data
Baruzzo, G., Patuzzi, I., & Camillo, B. D. (2019) · Bioinformatics · doi:10.1093/bioinformatics/btz752 · Cited by 63
Deciphering Brain Complexity using Single-Cell Sequencing
Mu, Q., Chen, Y., & Wang, J. (2019) · Genomics Proteomics & Bioinformatics · doi:10.1016/j.gpb.2018.07.007 · Cited by 61
Quantitative single-cell transcriptomics
Ziegenhain, C., Vieth, B., Parekh, S., Hellmann, I., & Enard, W. (2018) · Briefings in Functional Genomics · doi:10.1093/bfgp/ely009 · Cited by 60
Boyeau, P., Regier, J., Gayoso, A., Jordan, M. I., Lopez, R., & Yosef, N. (2023) · Proceedings of the National Academy of Sciences · doi:10.1073/pnas.2209124120 · Cited by 56
Wang, T., & Nabavi, S. (2018) · Methods · doi:10.1016/j.ymeth.2018.04.017 · Cited by 61
DENDRO: genetic heterogeneity profiling and subclone detection by single-cell RNA sequencing
Zhou, Z., Xu, B., Minn, A. J., & Zhang, N. R. (2020) · Genome biology · doi:10.1186/s13059-019-1922-x · Cited by 58
Missing Data and Technical Variability in Single-Cell RNA-Sequencing Experiments
Hicks, S. C., Townes, F. W., Teng, M., & Irizarry, R. A. (2015) · doi:10.1101/025528 · Cited by 625
TAS-Seq is a robust and sensitive amplification method for bead-based scRNA-seq
Shichino, S., Ueha, S., Hashimoto, S., Ogawa, T., Aoki, H., Wu, B., Chen, C.-Y., Kitabatake, M., Ouji-Sageshima, N., Sawabata, N., et al. (2022) · Communications Biology · doi:10.1038/s42003-022-03536-0 · Cited by 53
The shaky foundations of simulating single-cell RNA sequencing data
Crowell, H. L., Leonardo, S. X. M., Soneson, C., & Robinson, M. D. (2023) · Genome biology · doi:10.1186/s13059-023-02904-1 · Cited by 60
An interpretable framework for clustering single-cell RNA-Seq datasets
Zhang, J. M., Fan, J., Fan, H. C., Rosenfeld, D., & Tse, D. N. C. (2018) · BMC Bioinformatics · doi:10.1186/s12859-018-2092-7 · Cited by 51
Lu, T., & Mar, J. C. (2020) · Biology of Sex Differences · doi:10.1186/s13293-020-00335-2 · Cited by 52
DECENT: differential expression with capture efficiency adjustmeNT for single-cell RNA-seq data
Ye, C., Speed, T. P., & Salim, A. (2019) · Bioinformatics · doi:10.1093/bioinformatics/btz453 · Cited by 48
Mehtonen, J., Teppo, S., Lahnalampi, M., Kokko, A., Kaukonen, R., Oksa, L., Bouvy‐Liivrand, M., Malyukova, A., Mäkinen, A., Laukkanen, S., et al. (2020) · Genome Medicine · doi:10.1186/s13073-020-00799-2 · Cited by 49
IDEAS: individual level differential expression analysis for single-cell RNA-seq data
Zhang, M., Liu, S., Miao, Z., Han, F., Gottardo, R., & Sun, W. (2022) · Genome biology · doi:10.1186/s13059-022-02605-1 · Cited by 50
Method of moments framework for differential expression analysis of single-cell RNA sequencing data
Kim, M. C., Gate, R. E., Lee, D. S., Tolopko, A., Lu, A. C., Gordon, E. D., Shifrut, E., García-Nieto, P. E., Marson, A., Ntranos, V., et al. (2024) · Cell · doi:10.1016/j.cell.2024.09.044 · Cited by 47
Das, S., Rai, A. K., & Rai, S. N. (2022) · Entropy · doi:10.3390/e24070995 · Cited by 47
Data-based RNA-seq simulations by binomial thinning
Gerard, D. (2020) · BMC Bioinformatics · doi:10.1186/s12859-020-3450-9 · Cited by 43
RESCUE: imputing dropout events in single-cell RNA-sequencing data
Tracy, S., Yuan, G., & Dries, R. (2019) · BMC Bioinformatics · doi:10.1186/s12859-019-2977-0 · Cited by 41
The Human Cell Atlas: Technical approaches and challenges
Hon, C.-C., Shin, J. W., Carninci, P., & Stubbington, M. J. T. (2017) · Briefings in Functional Genomics · doi:10.1093/bfgp/elx029 · Cited by 40
Robust integration of multiple single-cell RNA sequencing datasets using a single reference space
Liu, Y., Wang, T., Zhou, B., & Zheng, D. (2021) · Nature Biotechnology · doi:10.1038/s41587-021-00859-x · Cited by 41
Single-Cell Genomic Analysis in Plants
Yuan, Y., Lee, H., Hu, H., Scheben, A., & Edwards, D. (2018) · Genes · doi:10.3390/genes9010050 · Cited by 38
SAVER: Gene expression recovery for UMI-based single cell RNA sequencingPreprint
Huang, M. C., Wang, J., Torre, E. A., Dueck, H., Shaffer, S., Bonasio, R., Murray, J. I., Raj, A., Li, M., & Zhang, N. R. (2017) · bioRxiv (Cold Spring Harbor Laboratory) · doi:10.1101/138677 · Cited by 38
Two-phase differential expression analysis for single cell RNA-seq
Wu, Z. J., Zhang, Y., Stitzel, M. L., & Wu, H. (2018) · Bioinformatics · doi:10.1093/bioinformatics/bty329 · Cited by 36
Das, S., Rai, A., Merchant, M. L., Cave, M. C., & Rai, S. N. (2021) · Genes · doi:10.3390/genes12121947 · Cited by 35
Computational approaches for high‐throughput single‐cell data analysis
Todorov, H., & Saeys, Y. (2018) · FEBS Journal · doi:10.1111/febs.14613 · Cited by 35
Simulation, power evaluation and sample size recommendation for single-cell RNA-seq
Su, K., Wu, Z. J., & Wu, H. (2020) · Bioinformatics · doi:10.1093/bioinformatics/btaa607 · Cited by 35
Soraggi, S., Riera, M., Meyts, E. R., Schierup, M. H., & Almstrup, K. (2020) · Human Genetics · doi:10.1007/s00439-020-02116-8 · Cited by 36
Fast identification of differential distributions in single-cell RNA-sequencing data with waddR
Schefzik, R., Flesch, J., & Gonçalves, Â. (2021) · Bioinformatics · doi:10.1093/bioinformatics/btab226 · Cited by 36
Single-Cell RNA Sequencing-Based Computational Analysis to Describe Disease Heterogeneity
Zeng, T., & Dai, H. (2019) · Frontiers in Genetics · doi:10.3389/fgene.2019.00629 · Cited by 33
Missarova, A., Dann, E., Dann, E., Satija, R., & Marioni, J. C. (2024) · Genome biology · doi:10.1186/s13059-024-03334-3 · Cited by 32
Wei, X., Dong, J., & Wang, F. (2022) · Bioinformatics · doi:10.1093/bioinformatics/btac357 · Cited by 33
Uncovering cell identity through differential stability with Cepo
Kim, H. J., Wang, K. Y. X., Chen, C., Lin, Y., Tam, P., Lin, D. M., Yang, J. Y. H., & Yang, P. (2021) · Nature Computational Science · doi:10.1038/s43588-021-00172-2 · Cited by 33
Differential expression of single‐cell RNA‐seq data using Tweedie models
Mallick, H., Chatterjee, S., Chowdhury, S., Chatterjee, S., Rahnavard, A., & Hicks, S. C. (2022) · Statistics in Medicine · doi:10.1002/sim.9430 · Cited by 31
Learning regulatory models for cell development from single cell transcriptomic data
Babtie, A. C., Chan, T. E., & Stumpf, M. P. H. (2017) · Current Opinion in Systems Biology · doi:10.1016/j.coisb.2017.07.013 · Cited by 32
Evaluation of deep learning-based feature selection for single-cell RNA sequencing data analysis
Huang, H. M., Liu, C., Wagle, M. M., & Yang, P. (2023) · Genome biology · doi:10.1186/s13059-023-03100-x · Cited by 31
Molecular features of luminal breast cancer defined through spatial and single‐cell transcriptomics
Yoshitake, R., Mori, H., Ha, D., Wu, X., Wang, J., Wang, X., Saeki, K., Chang, G., Shim, H. J., Chan, Y. S., et al. (2024) · Clinical and Translational Medicine · doi:10.1002/ctm2.1548 · Cited by 30
Zhao, C., Hu, S. S., Huo, X., & Zhang, Y. (2017) · PLoS ONE · doi:10.1371/journal.pone.0180583 · Cited by 29
Thurman, A. L., Ratcliff, J. A., Chimenti, M. S., & Pezzulo, A. A. (2021) · Bioinformatics · doi:10.1093/bioinformatics/btab337 · Cited by 27
Single-cell transcriptomics in tissue engineering and regenerative medicine
Ruta, A., Krishnan, K., & Elisseeff, J. H. (2023) · Nature Reviews Bioengineering · doi:10.1038/s44222-023-00132-7 · Cited by 25
distinct: A novel approach to differential distribution analyses
Tiberi, S., Crowell, H. L., Samartsidis, P., Weber, L. M., & Robinson, M. D. (2023) · The Annals of Applied Statistics · doi:10.1214/22-aoas1689 · Cited by 25
Auerbach, B. J., Hu, J., Reilly, M. P., & Li, M. (2021) · Genome Research · doi:10.1101/gr.275430.121 · Cited by 28
Kim, J., Stanescu, D. E., & Won, K. (2018) · Nucleic Acids Research · doi:10.1093/nar/gky698 · Cited by 25
Gene regulatory network inference from single-cell data using multivariate information measuresPreprint
Chan, T. E., Stumpf, M. P. H., & Babtie, A. C. (2016) · bioRxiv (Cold Spring Harbor Laboratory) · doi:10.1101/082099 · Cited by 24
Applications of Single-Cell Sequencing for Multiomics
Xu, Y., & Zhou, X. (2018) · Methods in molecular biology · doi:10.1007/978-1-4939-7717-8_19 · Cited by 22
The Poisson distribution model fits UMI-based single-cell RNA-sequencing data
Pan, Y., Landis, J. T., Moorad, R., Wu, D., Marron, J. S., & Dittmer, D. P. (2023) · BMC Bioinformatics · doi:10.1186/s12859-023-05349-2 · Cited by 21
Zou, J., Deng, F., Wang, M., Zhang, Z., Liu, Z., Zhang, X., Hua, R., Chen, K., Zou, X., & Hao, J. (2022) · Briefings in Bioinformatics · doi:10.1093/bib/bbac180 · Cited by 20
Nault, R., Saha, S., Bhattacharya, S., Dodson, J. P., Sinha, S., Maiti, T., & Zacharewski, T. R. (2022) · Nucleic Acids Research · doi:10.1093/nar/gkac019 · Cited by 20
Venice: A New Algorithm for Finding Marker Genes in Single-Cell Transcriptomic DataPreprint
Vuong, H., Truong, T., Phan, T. Đ., & Pham, S. (2020) · bioRxiv (Cold Spring Harbor Laboratory) · doi:10.1101/2020.11.16.384479 · Cited by 20
Srivastava, A., George, J., & Karuturi, R. K. M. (2018) · Elsevier eBooks · doi:10.1016/b978-0-12-809633-8.20161-1 · Cited by 20
Metadata
- Authors
- Korthauer, K. D., Chu, L.-F., Newton, M. A., Li, Y., Thomson, J., Stewart, R., & Kendziorski, C.
- Affiliations
- Harvard University (US)
- University of Wisconsin–Madison (US)
- University of Wisconsin System (US)
- Venue
- Genome Biology
- Published
- 2016-10-25
- Volume
- 17
- Issue
- 1
- Pages
- 222-222
- ISSN
- 1465-6906 (ISSN-L)
- 1474-760X
- PMC
- PMC5080738
- OpenAlex
- W2950541340
- Cited by
- 273
- References
- 73
- Citations by year
- 2026: 11 · 2025: 15 · 2024: 26 · 2023: 31 · 2022: 36 · 2021: 56 · 2020: 29 · 2019: 21 · 2018: 24 · 2017: 18 · 2016: 5
- FWCI
- 11.78
- Type
- journal article
- Language
- en
- Open access
- gold
- doi.org
- Locations
- Genome biology (publishedVersion, cc-by)
- bioRxiv (Cold Spring Harbor Laboratory) (acceptedVersion, cc-by-nc)
- Europe PMC (PubMed Central) (publishedVersion, cc-by)
- PubMed Central (publishedVersion, cc-by)
- PubMed (publishedVersion)
- Digital Access to Scholarship at Harvard (DASH) (Harvard University) (submittedVersion, cc-by)
- Funders
- National Institute of General Medical Sciences (GM102756)
- National Institute of Allergy and Infectious Diseases (U54AI117924)
- National Institutes of Health (4UH3TR000506-03)
- National Heart, Lung, and Blood Institute (5U01HL099773-06)
- Topics
- Life Sciences › Biochemistry, Genetics and Molecular Biology › Molecular Biology › Single-cell and spatial transcriptomics
- Life Sciences › Biochemistry, Genetics and Molecular Biology › Molecular Biology › Gene expression and cancer classification
- Life Sciences › Biochemistry, Genetics and Molecular Biology › Molecular Biology › Genomics and Phylogenetic Studies
- Keywords
- differential gene expression, single-cell RNA sequencing, gene expression distribution, cellular heterogeneity
- MeSH terms
- Algorithms, Humans, RNA, Software, Sequence Analysis, RNA, Computational Biology, Gene Expression Profiling, Single-Cell Analysis, High-Throughput Nucleotide Sequencing
About these checks
Registry, retraction, Cites and statistics results are computed, not judged, with one exception: a printed reference that no index lists is read once by a model before it counts as a citation error. Claims are extracted by a model and kept only when their quote appears verbatim in the text; each cited source is then checked, with a model’s help, for whether it says what the claim relies on. Those verdicts can be wrong — read the claim’s quote and the cited source before relying on one.
Statistics and arithmetic are recomputed, not judged.
Confidence bands are shown only for fields calibrated on our annotated test set. None is calibrated yet, so no band is shown.
What counts as a claim ›How we measure confidence ›How we check this ›
Are you an author, or do you see a problem with this page? Request a review
