

The DOI matches its Crossref record; 26 of the 26 references it cites were found in a registry or an index.
Predicting age from the transcriptome of human dermal fibroblasts
Open accessAbstract
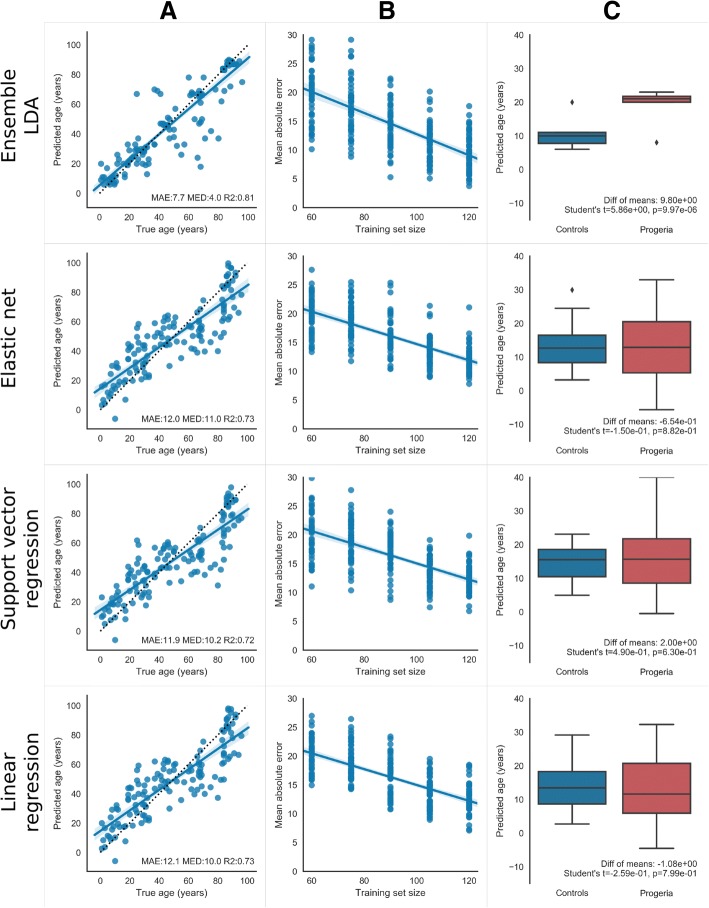
Biomarkers of aging can be used to assess the health of individuals and to study aging and age-related diseases. We generate a large dataset of genome-wide RNA-seq profiles of human dermal fibroblasts from 133 people aged 1 to 94 years old to test whether signatures of aging are encoded within the transcriptome. We develop an ensemble machine learning method that predicts age to a median error of 4 years, outperforming previous methods used to predict age. The ensemble was further validated by testing it on ten progeria patients, and our method is the only one that predicts accelerated aging in these patients.
Overview
The claims and statistics of this paper haven’t been checked yet.
Run the check — free, no account needed. It reads the open-access text and checks the sources it cites.
Integrity signals
Registry
Cites
Statistics
Figures
Verification
Claims the paper makes
The claims and statistics of this paper haven’t been checked yet.
Run the check — free, no account needed. It reads the open-access text and checks the sources it cites.
Claims other papers make about this one
Each is checked against this paper’s own text: does it say what the citing paper says it does?
The cited source says what the claim attributes to it.
In the citing paper
“this error being higher than that of the epigenetic clock consistent with previous transcription age predictors (Peters et al., 2015; Fleischer et al., 2018).”
From Multi-omic rejuvenation of human cells by maturation phase transient reprogramming (2022) · cites this paper as Fleischer et al., 2018
The cited source says what the claim attributes to it.
In the citing paper
“The combat function was also used in Figure 3 to batch correct the fibroblast aging reference data set (Fleischer et al., 2018) to our data set.”
From Multi-omic rejuvenation of human cells by maturation phase transient reprogramming (2022) · cites this paper as Fleischer et al., 2018
In the citing paper
“Additionally, they demonstrated, using human fibroblast data from Fleischer et al.82, that an elastic net-based clock derived from binarized transcriptomic data improved chronological age prediction to an r2 of 0.92 and mean error of 6.63 years and could detect accelerated ageing in progeria samples.”
From Measuring biological age using omics data (2022) · cites this paper as [82]
In the citing paper
“However, the model was not evaluated on an independent test dataset, so it remains to be seen whether the method was a true improvement.”
From Measuring biological age using omics data (2022) · cites this paper as [82]
In the citing paper
“The method outperformed standard penalized linear regression-based clocks at chronological age prediction and uniquely detected accelerated ageing in progeria samples, suggesting that methods designed to be robust to transcriptional noise improve performance.”
From Measuring biological age using omics data (2022) · cites this paper as [82]
Self-check
Percentages, sums and reported differences re-computed from the paper’s own numbers.
The self-check needs the paper’s full text.
Citations
Cites
Scikit-learn: Machine Learning in Python
Pedregosa, F., Varoquaux, G., Gramfort, A., Michel, V., Thirion, B., Grisel, O., Blondel, M., Müller, A., Nothman, J., Louppe, G., et al. (2012) · arXiv · doi:10.48550/arxiv.1201.0490 · Cited by 71,016
STAR: ultrafast universal RNA-seq aligner
Dobin, A., Davis, C. A., Schlesinger, F., Drenkow, J., Zaleski, C., Jha, S., Batut, P., Chaisson, M., & Gingeras, T. R. (2013) · Bioinformatics · doi:10.1093/bioinformatics/bts635 · Cited by 51,709
Heinz, S., Benner, C., Spann, N., Bertolino, E., Lin, Y. C., Laslo, P., Cheng, J. X., Murre, C., Singh, H., & Glass, C. K. (2010) · Molecular Cell · doi:10.1016/j.molcel.2010.05.004 · Cited by 13,382
Ensemble methods in machine learning
Dietterich, T. G. (2000) · Lecture Notes in Computer Science · doi:10.1007/3-540-45014-9_1 · Cited by 8,408
DNA methylation age of human tissues and cell types
Horvath, S. (2013) · Genome Biology · doi:10.1186/gb-2013-14-10-r115 · Cited by 7,075
Genome-wide methylation profiles reveal quantitative views of human aging rates
Hannum, G., Guinney, J., Zhao, L., Zhang, L., Hughes, G., Sadda, S., Klotzle, B., Bibikova, M., Fan, J.-B., Gao, Y., et al. (2013) · Molecular Cell · doi:10.1016/j.molcel.2012.10.016 · Cited by 4,270
Hansen, L. K., & Salamon, P. (1990) · IEEE Transactions on Pattern Analysis and Machine Intelligence · doi:10.1109/34.58871 · Cited by 4,260
Jupyter Notebooks – a publishing format for reproducible computational workflows
Kluyver, T. A., Ragan-Kelley, B., Fernando, P., Granger, B., Bussonnier, M., Frederic, J., Kelley, K., Hamrick, J. B., Grout, J., Corlay, S., et al. (2016) · IOS Press eBooks · doi:10.3233/978-1-61499-649-1-87 · Cited by 3,517
A well-conditioned estimator for large-dimensional covariance matrices
Ledoit, O., & Wolf, M. (2004) · Journal of Multivariate Analysis · doi:10.1016/s0047-259x(03)00096-4 · Cited by 3,046 · cited 2×
“Linear discriminant analysis was performed using the eigenvalue decomposition solver and Ledoit-Wolf shrinkage of the covariance matrix [22].”
MethodLamin A-dependent nuclear defects in human aging
Scaffidi, P., & Misteli, T. (2006) · Science · doi:10.1126/science.1127168 · Cited by 1,125
Research works printed but not linked: 2
- Hastie T, Tibshirani R, Friedman J. The elements of statistical learning: data mining, inference, and prediction. 2nd edition. New York: Springer; 2008.
- Shokirev MN. Predicting age from the transcriptome of human dermal fibroblasts. Data sets. [Internet]. Gene Expression Omnibus; 2018. Available from: https://www.ncbi.nlm.nih.gov/geo/query/acc.cgi?acc=GSE113957 . Accessed 12 Dec 2018.
Cited by
Sorted by citations
Items 101–200 of 231
Li, Z., Yin, S., Wang, S., Wang, Y., Qiang, W., & Jiang, J. (2024) · Journal of Advanced Research · doi:10.1016/j.jare.2024.11.018 · Cited by 15
Yang, E. J., Park, J. H., Cho, H.-J., Hwang, J.-A., Woo, S., Park, C. H., Kim, S. Y., Park, J. T., Park, S. C., Hwang, D., et al. (2022) · Communications Biology · doi:10.1038/s42003-022-03658-5 · Cited by 12
Transcriptomic reprogramming for neuronal age reversal
Pleşa, A. M., Shadpour, M., Boyden, E. S., & Church, G. M. (2023) · Human Genetics · doi:10.1007/s00439-023-02529-1 · Cited by 13
Evaluating facial dermis aging in healthy Caucasian females with LC-OCT and deep learning
Assi, A., Fischman, S., Lopez, C., Pedrazzani, M., Grignon, G., Missodey, R., Korichi, R., Cauchard, J.-H., Ralambondrainy, S., & Bonnier, F. (2024) · Scientific Reports · doi:10.1038/s41598-024-74370-z · Cited by 13
Lee, H.-Y., Jeon, Y., Kim, Y. K., Jang, J. Y., Cho, Y. S., Bhak, J., & Cho, K. (2021) · Scientific Reports · doi:10.1038/s41598-021-91811-1 · Cited by 13
Nagaraj, S. B., Kieneker, L. M., & Pena, M. J. (2021) · Computer Methods and Programs in Biomedicine · doi:10.1016/j.cmpb.2021.106434 · Cited by 13
Deep aging clocks: AI-powered strategies for biological age estimation
Srour, L., Bejaoui, Y., She, J. P. M., Alam, T., & Hajj, N. E. (2025) · Ageing Research Reviews · doi:10.1016/j.arr.2025.102889 · Cited by 14
Metabolomic-based aging clocks
de Opakua, A. I., Conde, R., de Diego, Á., Bizkarguenaga, M., Embade, N., Lu, S. C.-L., Mato, J. M., & Millet, Ó. (2025) · npj Metabolic Health and Disease · doi:10.1038/s44324-025-00078-x · Cited by 16
A lipidomic based metabolic age score captures cardiometabolic risk independent of chronological age
Wang, T., Beyene, H. B., Yi, C., Cinel, M. A., Mellett, N. A., Olshansky, G., Meikle, T. G., Wu, J. Q., Dakic, A., Watts, G. F., et al. (2024) · EBioMedicine · doi:10.1016/j.ebiom.2024.105199 · Cited by 15
Lephart, E. D. (2019) · Journal of Functional Foods · doi:10.1016/j.jff.2019.03.025 · Cited by 13
Secci, R., Hartmann, A., Walter, M., Grabe, H. J., der Auwera, S. V., Kowald, A., Palmer, D. H., Rimbach, G. H., Fuellen, G., & Barrantes, I. (2021) · Critical Reviews in Food Science and Nutrition · doi:10.1080/10408398.2021.1975638 · Cited by 11
Selecting mRNA markers in blood for age estimation of the donor of a biological stain
Dørum, G., Hänggi, N. V., Burri, D., Marti, Y., Banemann, R., Kulstein, G., Courts, C., Gosch, A., Hadrys, T., Haas, C., et al. (2023) · Forensic Science International Genetics · doi:10.1016/j.fsigen.2023.102976 · Cited by 13
A miRNA-based epigenetic molecular clock for biological skin-age prediction
Roig-Genovés, J. V., García‐Giménez, J. L., & Mena, S. (2024) · Archives of Dermatological Research · doi:10.1007/s00403-024-03129-3 · Cited by 11
General and individualized changes in T cell immunity during aging
Song, N., Elbahnasawy, M. A., & Weng, N. (2025) · The Journal of Immunology · doi:10.1093/jimmun/vkae033 · Cited by 11
TIME-Seq Enables Scalable and Inexpensive Epigenetic Age PredictionsPreprint
Griffin, P. T., Kane, A. E., Trapp, A., Li, J., Arnold, M. W., Poganik, J. R., McNamara, M. S., Meer, M. V., Hoffman, N., Amorim, J. P., et al. (2021) · bioRxiv (Cold Spring Harbor Laboratory) · doi:10.1101/2021.10.25.465725 · Cited by 11
DeepQA : A Unified Transcriptome‐Based Aging Clock Using Deep Neural Networks
Qi, H., Zhao, H., Li, E., Lu, X., Yu, N., Liu, J., & Han, J. (2025) · Aging Cell · doi:10.1111/acel.14471 · Cited by 10
Evaluation of quantitative biomarkers of aging in human PBMCs
Owen, B. M., Phie, J. K. P., Huynh, J., Needham, S., & Fraser, C. (2023) · Frontiers in Aging · doi:10.3389/fragi.2023.1260502 · Cited by 11
Georgakopoulou, E. A., Valsamidi, C., Veroutis, D., & Havaki, S. (2020) · Mechanisms of Ageing and Development · doi:10.1016/j.mad.2020.111409 · Cited by 12
Jain, S., Rick, J. W., Joshi, R. S., Beniwal, A., Spatz, J., Chang, A. C.-C., Nguyen, A. T., Sudhir, S., Chandra, A., Haddad, A., et al. (2021) · bioRxiv (Cold Spring Harbor Laboratory) · doi:10.1101/2021.05.08.443250 · Cited by 10
Network modeling and topology of aging
Li, F., Yang, D., Wu, S., Xue, C., Sang, M., Liu, X., Che, J., Wu, J., Gragnoli, C., Griffin, C. H., et al. (2024) · Physics Reports · doi:10.1016/j.physrep.2024.10.006 · Cited by 9
Zhang, C., Saurat, N. G., Cornacchia, D., Chung, S. Y., Sikder, T., Nemchik, A., Minotti, A. P., Studer, L., & Betel, D. (2025) · Aging Cell · doi:10.1111/acel.70075 · Cited by 14
From clock to clock: Therapeutic target discovery for aging and age-related diseases
Chen, J., Leung, G. H. D., Leung, H., Ustiugova, A. S., Shneyderman, A., Korzinkin, M., Gennert, D. G., Pun, F. W., Aliper, A. M., Ren, F., et al. (2025) · Ageing Research Reviews · doi:10.1016/j.arr.2025.102871 · Cited by 10
Forensic genetics in the omics era
Kayser, M. (2025) · Nature Reviews Genetics · doi:10.1038/s41576-025-00896-1 · Cited by 14
Skin aging: mechanisms, evaluation, and rejuvenation
Li, R., Zhang, J., Mao, K., Meng, D., & Han, J.-D. J. (2026) · The EMBO Journal · doi:10.1038/s44318-026-00810-3 · Cited by 13
Machaliński, B., Rogińska, D., Wilk, A., Szumilas, K., Prowans, P., Paczkowska, E., Szumilas, P., Stecewicz, I., Zawodny, P., Ziętek, M., et al. (2021) · International Journal of Medical Sciences · doi:10.7150/ijms.46265 · Cited by 9
ELO-6 expression predicts longevity in isogenic populations of Caenorhabditis elegans
Kong, W., Gu, G., Dai, T., Chen, B., Wang, Y., Zeng, Z., & Pu, M. (2024) · Nature Communications · doi:10.1038/s41467-024-53887-x · Cited by 8
Xu, Y., Li, M., Hu, C., Luo, Y., Gao, X., Li, X., Li, X., & Zhang, Y. (2025) · Genome Medicine · doi:10.1186/s13073-025-01501-0 · Cited by 11
Lamin A/C-regulated cysteine catabolic flux modulates stem cell fate through epigenome reprogramming
Wang, Y., Shi, H., Wittig, J., Ren, Y., Cordero, J., Dewenter, M., Mella, J., Buchwalter, A. L., Backs, J., Wieland, T., et al. (2026) · Nature Metabolism · doi:10.1038/s42255-025-01443-2 · Cited by 8
Human immune aging clock identifies RUNX1 as a decelerator of T cell senescence
Ping, J., Qiao, Q., Gao, D.-D., Li, Y., Fan, Y., Tian, Y., Xiong, M., Zheng, Q., Jiang, B., Li, J., et al. (2026) · Immunity · doi:10.1016/j.immuni.2026.02.007 · Cited by 13
Transcriptome-based measurement of CD8+ T cell age and its applications
Weng, N. (2023) · Trends in Immunology · doi:10.1016/j.it.2023.05.005 · Cited by 8
Exercise Partially Rejuvenates Muscle Stem Cells
Larrick, J. W., & Mendelsohn, A. R. (2020) · Rejuvenation Research · doi:10.1089/rej.2020.2359 · Cited by 8
Transcriptomic reprogramming screen identifies SRSF1 as rejuvenation factorPreprint
Pleşa, A. M., Jung, S., Wang, H. H., Omar, F., Shadpour, M., Buentello, D. C., Pérez-Matos, M. C., Horwitz, N., Cai, G., Ngian, Z., et al. (2023) · bioRxiv (Cold Spring Harbor Laboratory) · doi:10.1101/2023.11.13.566787 · Cited by 8
Integration of multi-modal datasets to estimate human aging
Ribeiro, R., Moraes, A., Moreno, M., & Ferreira, P. G. (2024) · Machine Learning · doi:10.1007/s10994-024-06588-x · Cited by 9
Scale bar of aging trajectories for screening personal rejuvenation treatments
Shen, X., Wu, B., Jiang, W. M., Li, Y., Zhang, Y., Zhao, K., Nie, N., Gong, L., Liu, Y., Zou, X., et al. (2022) · Computational and Structural Biotechnology Journal · doi:10.1016/j.csbj.2022.10.021 · Cited by 7
The San Diego Nathan Shock Center: tackling the heterogeneity of aging
Shadel, G. S., Adams, P. D., Berggren, W. T., Diedrich, J. K., Diffenderfer, K. E., Gage, F. H., Hah, N., Hansen, M., Hetzer, M. W., Molina, A. J. A., et al. (2021) · GeroScience · doi:10.1007/s11357-021-00426-x · Cited by 7
Self-citationPrediction of diabetic protein markers based on an ensemble method
Qu, K., Zou, Q., & Shi, H. W. (2021) · Frontiers in Bioscience-Landmark · doi:10.52586/4935 · Cited by 8
Human Age Estimation from Gene Expression Data using Artificial Neural Networks
Mohamadi, S., Nasrabadi, N. M., Doretto, G., & Adjeroh, D. (2021) · IEEE International Conference on Bioinformatics and Biomedicine (BIBM) · doi:10.1109/bibm52615.2021.9669893 · Cited by 8
Senotherapeutic peptide reduces skin biological age and improves skin health markersPreprint
Zonari, A. A. C., Brace, L. E., Al-Katib, K., Porto, W. F., Foyt, D. A., Guiang, M., Cruz, E. A. O., Marshall, B., Salgueiro, W. G., Inan, M. D., et al. (2020) · bioRxiv (Cold Spring Harbor Laboratory) · doi:10.1101/2020.10.30.362822 · Cited by 7
Development and validation of an age prediction model using mRNA markers
Liao, M., Chen, A., Xuan, Y., Zhao, J., Liu, S., Xing, Y., Zhang, S., & Li, C. (2025) · Forensic Science International Genetics · doi:10.1016/j.fsigen.2025.103373 · Cited by 6
Tilburg, J., Slieker, R. C., Suchiman, H. E. D., Heath, A., van Heemst, D., Slagboom, P. E., de Gruijl, F. R., Gunn, D. A., & Heijmans, B. T. (2020) · Epigenomics · doi:10.2217/epi-2019-0251 · Cited by 6
Age-Dependent Dysregulation of APP in Neuronal and Skin Cells from Fragile X Individuals
Cencelli, G., Pacini, L., Luca, A. D., Messia, I., Gentile, A., Kang, Y., Nobile, V., Tabolacci, E., Jin, P., Farace, M. G., et al. (2023) · Cells · doi:10.3390/cells12050758 · Cited by 6
Xia, Y., Islam, S. M. S., Li, X., Baten, A., Tan, X., & Wang, W. (2025) · Engineering · doi:10.1016/j.eng.2025.08.016 · Cited by 5
The secretome atlas of two mouse models of progeria
Quintana‐Torres, D., Valle‐Cao, A., Bousquets‐Muñoz, P., Freitas‐Rodríguez, S., Rodríguez, F. J., Lucía, A., López-Otín, C., López‐Soto, A., & Folgueras, A. R. (2023) · Aging Cell · doi:10.1111/acel.13952 · Cited by 4
Cho, H.-M., Choe, S.-H., Lee, J.-R., Park, H., Ko, M.-G., Lee, Y.-J., Lee, H.-Y., Park, S. H., Park, S.-J., Kim, Y., et al. (2024) · npj Aging · doi:10.1038/s41514-024-00158-0 · Cited by 5
Metabolomics to Study Human Aging: A Review
Martins, C., Magalhães, S., Almeida, I., Neto, V., Rebelo, S., & Nunes, A. (2023) · Current Molecular Medicine · doi:10.2174/1566524023666230407123727 · Cited by 6
Atg4b Overexpression Extends Lifespan and Healthspan in Drosophila melanogaster
Li, Y., Zhang, W., Ye, Y., Sun, Y., Yang, L., Chen, G., Chen, K., Smith, S. T., & Zhou, J. (2023) · International Journal of Molecular Sciences · doi:10.3390/ijms24129893 · Cited by 5
Evidence‐based selection of reference genes for RT‐qPCR assays in periodontal research
Diehl, D., Friedmann, A., & Bachmann, H. S. (2022) · Clinical and Experimental Dental Research · doi:10.1002/cre2.525 · Cited by 4
Brain aging is faithfully modelled in organotypic brain slices and accelerated by prions
Liu, Y., Senatore, A., Sorce, S., Nuvolone, M., Guo, J., Gumus, Z. H., & Aguzzi, A. (2022) · Communications Biology · doi:10.1038/s42003-022-03496-5 · Cited by 5
Fast local linear regression with anchor regularizationPreprint
Petrovich, M., & Yamada, M. (2020) · arXiv (Cornell University) · doi:10.48550/arxiv.2003.05747 · Cited by 5
Predicting lung aging using scRNA-Seq data
Song, Q., Singh, A., McDonough, J. E., Adams, T. S., Vos, R., Man, R. D., Myers, G., Ceulemans, L. J., Vanaudenaerde, B. M., Wuyts, W. A., et al. (2024) · PLoS Computational Biology · doi:10.1371/journal.pcbi.1012632 · Cited by 4
Accelerated retinal ageing and multimorbidity in middle-aged and older adults
Chen, R., Zeng, X., Hu, W., Jeyarajan, D., Yu, Z., Wang, W., Ge, Z., Shang, X., He, M., & Zhu, Z. (2025) · GeroScience · doi:10.1007/s11357-025-01581-1 · Cited by 4
Dysregulation of extracellular fibronectin and α5-integrin in dermal aging
Lee, Y., Shen, X., Dreesen, O., Zhua, J., & Li, R. (2025) · Molecular Biology of the Cell · doi:10.1091/mbc.e25-02-0074 · Cited by 4
Multitissue, multi–time point transcriptomic atlas of aging in mice and rats
Shavlakadze, T., Xiong, K., Donné, R., McEwen, C., Gadi, A., Wakai, M., Salmon, H. A., Treinish, J., Pavlopoulos, E., Proctor, L., et al. (2026) · Science Advances · doi:10.1126/sciadv.ady8401 · Cited by 6
Senescent cells cluster CTCF on nuclear speckles to instruct an alternative splicing program
Palikyras, S., Varamogianni‐Mamatsi, V., Zhu, Y., Mizi, A., Ramasamy, S., Grini, J. V., Liebermann, I., Stavropoulou, A., Penagos‐Puig, A., Ogurlu-Tank, T. S., et al. (2026) · Nature Aging · doi:10.1038/s43587-026-01171-6 · Cited by 10
An snRNA-seq aging clock for the fruit fly head sheds light on sex-biased aging
Tennant, N., Pavuluri, A., Singh, G., Cortez, K., O’Connor-Giles, K., Larschan, E., & Singh, R. (2026) · Scientific Reports · doi:10.1038/s41598-026-48613-0 · Cited by 4
Early dysregulation of GSK3β impairs mitochondrial activity in Fragile X Syndrome
Cencelli, G., Pedini, G., Ricci, C., Rosina, E., Cecchetti, G., Gentile, A., Aiello, G., Pacini, L., Garrone, B., Ombrato, R., et al. (2024) · Neurobiology of Disease · doi:10.1016/j.nbd.2024.106726 · Cited by 4
Personalized medicine: will it work for decreasing age-related morbidities?
Martens, C. R., Wahl, D., & LaRocca, T. J. (2022) · Elsevier eBooks · doi:10.1016/b978-0-12-823761-8.00013-6 · Cited by 4
Cultural Scripting of Age Identity and Its Consequences
Campos, L. P. (2021) · Transactional Analysis Journal · doi:10.1080/03621537.2021.1979830 · Cited by 4
Mouse Aging Cell Atlas Analysis Reveals Global and Cell Type Specific Aging Signatures Revision 1Preprint
Zhang, M. J., Pisco, A. O., Darmanis, S., & Zou, J. (2019) · bioRxiv (Cold Spring Harbor Laboratory) · doi:10.1101/2019.12.23.887604 · Cited by 4
Pabis, K., Barardo, D., Sirbu, O., Selvarajoo, K., Gruber, J., & Kennedy, B. K. (2022) · bioRxiv (Cold Spring Harbor Laboratory) · doi:10.1101/2022.12.29.522277 · Cited by 4
Histone mark age of human tissues and cellsPreprint
Camillo, L. P. D. L., Asif, M. H., Horvath, S., Larschan, E., & Singh, R. (2023) · bioRxiv (Cold Spring Harbor Laboratory) · doi:10.1101/2023.08.21.554165 · Cited by 4
A computational framework for detecting inter-tissue gene-expression coordination changes with aging
Briller, S., David, G. B., Amir, Y., Atzmon, G., & Somekh, J. (2025) · Scientific Reports · doi:10.1038/s41598-025-94043-9 · Cited by 4
The Evolving Landscape of Clinical Aging Clocks: From Epigenetic to Multi‐Omics Integration
Liu, L., Lai, Y., Tian, C., Huang, Y., Hao, J., Zhao, Y., Chen, D., Wu, T., Zhou, D., Zheng, X., et al. (2026) · Aging Cell · doi:10.1111/acel.70579 · Cited by 3
Duran, I., & Tsurumi, A. (2025) · Biogerontology · doi:10.1007/s10522-025-10216-z · Cited by 3
Webb, J. L., Moe, S. M., Bolstad, A. K., & McNeill, E. M. (2021) · PLoS ONE · doi:10.1371/journal.pone.0255085 · Cited by 3
dNAGLU Extends Life Span and Promotes Fitness and Stress Resistance in Drosophila
Xue, R., Yang, K., Xiao, F., Yang, L., Chen, G., Li, Y., Ye, Y., Chen, K., Smith, S. T., Li, G., et al. (2022) · International Journal of Molecular Sciences · doi:10.3390/ijms232214433 · Cited by 4
Characteristics of circulating small noncoding RNAs in plasma and serum during human aging
Xiao, P., Shi, Z., Liu, C., & Hagen, D. E. (2023) · Aging Medicine · doi:10.1002/agm2.12241 · Cited by 3
An integrated transcriptomic analysis of brain aging and strategies for healthy aging
Liu, H., Nie, X., Wang, F., Chen, D., Zeng, Z., Shu, P., & Huang, J. (2024) · Frontiers in Aging Neuroscience · doi:10.3389/fnagi.2024.1450337 · Cited by 5
Improving our understanding of the biology of aging: findings from the Age-It Research Program
Chiti, F., Conti, F., Corda, D., Giorgino, F., Graziani, A., Passarino, G., Sandri, M., & di Fagagna, F. D. (2025) · The Journals of Gerontology Series B · doi:10.1093/geronb/gbaf197 · Cited by 4
Mohamadi, S., & Adjeroh, D. (2021) · IEEE International Conference on Bioinformatics and Biomedicine (BIBM) · doi:10.1109/bibm52615.2021.9669390 · Cited by 3
Pease, L. I., Wordsworth, J., & Shanley, D. P. (2022) · bioRxiv (Cold Spring Harbor Laboratory) · doi:10.1101/2022.08.16.504111 · Cited by 3
Johnson, K. A., & Krishnan, A. (2023) · bioRxiv (Cold Spring Harbor Laboratory) · doi:10.1101/2023.01.12.523796 · Cited by 5
Zhang, C., Saurat, N. G., Cornacchia, D., Chung, S. Y., Sikder, T., Minotti, A. P., Studer, L., & Betel, D. (2023) · bioRxiv (Cold Spring Harbor Laboratory) · doi:10.1101/2023.07.03.547539 · Cited by 3
Salignon, J., Tsiokou, M., Marqués, P., Rodríguez-Diaz, E., Ang, H. X., Pietrocola, F., & Riedel, C. G. (2026) · Advanced Science · doi:10.1002/advs.76740 · Cited by 4
Identification of Functional Cellular Markers Related to Human Health, Frailty and Chronological Age
Brodeau, C., Joly, C., Chekroun, A., Nakhle, J., Blase, V., Espagnolle, N., Dray, C., Yart, A., Planat‐Benard, V., Tertrais, M., et al. (2025) · Aging Cell · doi:10.1111/acel.70153 · Cited by 5
Discovering Candidate Anti-Aging Perturbations Using a Foundation Model for Gene Expression
Tadevosyan, E., Efimov, E., Kriukov, D. V., & Khrameeva, E. E. (2025) · International Journal of Molecular Sciences · doi:10.3390/ijms262411977 · Cited by 2
Xu, Y., Luo, Z., He, K., Zhang, F., Zhang, Y., Wang, J., Wen, H., Li, Y., & Han, D. (2026) · Genome biology · doi:10.1186/s13059-026-04188-7 · Cited by 2
Lian, J., Cai, P., Huang, F., Huang, J., & Vardhanabhuti, V. (2025) · Communications Medicine · doi:10.1038/s43856-025-00850-6 · Cited by 1
ε-Viniferin Rejuvenates Senescence via RGS16 Regulation: In Vitro Evidence
Park, J. H., Lee, K. S., Lee, K. S., Lee, Y. J., Yoon, J. H., So, B., Kim, D., Kim, M., Kwon, H. W., Byun, Y., et al. (2025) · Pharmaceuticals · doi:10.3390/ph18091254 · Cited by 2
Martins, C., Almeida, I., Rebelo, S., Magalhães, S., & Nunes, A. (2023) · Spectroscopy Journal · doi:10.3390/spectroscj1010004 · Cited by 2
Ikegami, K., Secchia, S., Almakki, O., Lieb, J. D., & Moskowitz, I. P. G. (2019) · bioRxiv (Cold Spring Harbor Laboratory) · doi:10.1101/682260 · Cited by 2
Quill, Q., Agarwal, V., Li, O., Patil, A., Kassis, T., & Gopinath, A. (2025) · medRxiv · doi:10.1101/2025.06.28.25330474 · Cited by 3
Cell Level- Modeling of Aging and Rejuvenation
Koptyug, A. V., Суховей, Ю. Г., Костоломова, Е. Г., Unger, I., & Va, K. (2023) · OBM Geriatrics · doi:10.21926/obm.geriatr.2304263 · Cited by 1
Bravo, J. I., Tewelde, E., King, C. D., Bons, J., Shah, S., Rose, J., Campisi, J., Schilling, B., & Benayoun, B. A. (2025) · GeroScience · doi:10.1007/s11357-025-02033-6 · Cited by 1
Xie, J., Wang, L. X. N., Zhao, S., Wang, J., Cheng, Y., Xu, L., Kou, T., Chen, Y., Ying, Y., Xin, X., et al. (2026) · BMC Genomics · doi:10.1186/s12864-025-12469-x · Cited by 1
Artificial intelligence approaches in biological age prediction: current status and challenges
Wang, G., Ding, P., Li, Z., Tang, Q., Tu, L., Jiang, T., Zhang, L., Su, B., Xu, J., & An, H. (2026) · British Journal of Biomedical Science · doi:10.3389/bjbs.2026.16141 · Cited by 1
HLOBA, O., Антонова-Рафі, Ю. В., Żukow, W., HARNYK, T., & Sinyov, V. (2023) · Physical rehabilitation and recreational health technologies · doi:10.15391/prrht.2023-8(2).04 · Cited by 2
Heteroskedasticity as a Signature of Association for Age-Related Genes
Mohamadi, S., & Adjeroh, D. (2023) · IEEE International Conference on Bioinformatics and Biomedicine (BIBM) · doi:10.1109/bibm58861.2023.10385752 · Cited by 1
Lin, X., Chang, X., Zhang, Y., Gao, Z., & Chi, X. (2024) · npj Systems Biology and Applications · doi:10.1038/s41540-024-00464-z · Cited by 1
Models for Evaluation of Biological Age Based on Multi-omicsPreprint
Huang, C., Zhu, Y., Huo, F., Feng, S., Gong, X., Jiang, H., Liu, Z., & Liu, H. (2021) · bioRxiv (Cold Spring Harbor Laboratory) · doi:10.1101/2021.12.13.472382 · Cited by 1
Pabis, K., Barardo, D., Sirbu, O., Selvarajoo, K., Gruber, J., & Kennedy, B. K. (2024) · eLife · doi:10.7554/elife.87811.2 · Cited by 1
IMMClock reveals immune aging and T cell function at single-cell resolutionPreprint
Gurevich, Y., Wu, D., Madan, S., Sinha, S., Sahni, S., Gopalan, V., Wang, B., Dhruba, S. R., Schäffer, A. A., Weng, N., et al. (2024) · bioRxiv (Cold Spring Harbor Laboratory) · doi:10.1101/2024.11.13.623449 · Cited by 1
Yan, Q., Cao, Q., Liao, J., Luk, C. S., Suen, A. H. C., Lee, A. W.-T., Chan, T. H. T., Ng, J. K. W., Tang, N. L. S., Chung, H. S., et al. (2020) · bioRxiv (Cold Spring Harbor Laboratory) · doi:10.1101/2020.08.22.260612
A Grand Challenge in Aging Interventions: From Mice to Humans
Scheibye‐Knudsen, M. (2020) · Frontiers in Aging · doi:10.3389/fragi.2020.566651
Discovering Molecular Regulators of Ageing Using Mixture Models With RNA-sequencing DataPreprint
Loganathan, S., Kulkarni, A. S., Fard, A. T., & Mar, J. C. (2022) · Research Square · doi:10.21203/rs.3.rs-1390473/v1
Pease, L. I., Wordsworth, J., & Shanley, D. P. (2022) · bioRxiv (Cold Spring Harbor Laboratory) · doi:10.1101/2022.08.16.504102
Pabis, K., Barardo, D., Selvarajoo, K., Gruber, J., & Kennedy, B. K. (2023) · eLife · doi:10.7554/elife.87811.1
Haga, M., Iida, K., & Okada, M. (2023) · bioRxiv (Cold Spring Harbor Laboratory) · doi:10.1101/2023.07.18.546970
Detection of human body fluid through mRNA analysis using NGS
Gauthier, Q. T. (2024) · Elsevier eBooks · doi:10.1016/b978-0-323-99144-5.00024-x
Metadata
- Authors
- Fleischer, J. G., Schulte, R., Tsai, H. H., Tyagi, S., Ibarra, A., Shokhirev, M. N., Huang, L., Hetzer, M. W., & Navlakha, S.
- Affiliations
- Salk Institute for Biological Studies (US)
- Corresponding author
- Hetzer, Martin W.
- Navlakha, Saket
- ORCID
- Venue
- Genome Biology
- Published
- 2018-12
- Volume
- 19
- Issue
- 1
- Pages
- 221-221
- ISSN
- 1465-6906 (ISSN-L)
- 1474-760X
- PMC
- PMC6300908
- OpenAlex
- W2905232298
- Cited by
- 232
- References
- 26
- Citations by year
- 2026: 25 · 2025: 34 · 2024: 36 · 2023: 43 · 2022: 27 · 2021: 33 · 2020: 23 · 2019: 10 · 2018: 1
- FWCI
- 6.58
- Type
- journal article
- Language
- en
- Open access
- gold
- doi.org
- Licence
- Locations
- Genome biology (publishedVersion, cc-by)
- Europe PMC (PubMed Central) (publishedVersion, other-oa)
- PubMed Central (publishedVersion, cc-by)
- PubMed (publishedVersion)
- Cold Spring Harbor Laboratory Institutional Repository (Cold Spring Harbor Laboratory) (acceptedVersion)
- DOAJ (DOAJ: Directory of Open Access Journals) (submittedVersion, cc-by-sa)
- Funders
- National Institutes of Health (R01-NS096786, 1R01DC017695)
- Topics
- Life Sciences › Biochemistry, Genetics and Molecular Biology › Aging › Genetics, Aging, and Longevity in Model Organisms
- Life Sciences › Biochemistry, Genetics and Molecular Biology › Molecular Biology › Single-cell and spatial transcriptomics
- Life Sciences › Biochemistry, Genetics and Molecular Biology › Molecular Biology › Gene expression and cancer classification
- Keywords
- age prediction, aging biomarkers, transcriptome, human dermal fibroblasts, RNA-seq, ensemble learning, Hutchinson-Gilford progeria syndrome, accelerated aging, age-related diseases
- MeSH terms
- Machine Learning, Adolescent, Adult, Aged, Aged, 80 and over, Aging, Child, Child, Preschool, Fibroblasts, Humans, Middle Aged, Progeria, Gene Expression Profiling, Genomics, Young Adult, Transcriptome
About these checks
Registry, retraction, Cites and statistics results are computed, not judged, with one exception: a printed reference that no index lists is read once by a model before it counts as a citation error. Claims are extracted by a model and kept only when their quote appears verbatim in the text; each cited source is then checked, with a model’s help, for whether it says what the claim relies on. Those verdicts can be wrong — read the claim’s quote and the cited source before relying on one.
Statistics and arithmetic are recomputed, not judged.
Confidence bands are shown only for fields calibrated on our annotated test set. None is calibrated yet, so no band is shown.
What counts as a claim ›How we measure confidence ›How we check this ›
Are you an author, or do you see a problem with this page? Request a review
