CoChat

BART-Seq: cost-effective massively parallelized targeted sequencing for genomics, transcriptomics, and single-cell analysis

Open access

The DOI matches its Crossref record; 49 of the 49 references it cites were found in a registry or an index.

Abstract

We describe a highly sensitive, quantitative, and inexpensive technique for targeted sequencing of transcript cohorts or genomic regions from thousands of bulk samples or single cells in parallel. Multiplexing is based on a simple method that produces extensive matrices of diverse DNA barcodes attached to invariant primer sets, which are all pre-selected and optimized in silico. By applying the matrices in a novel workflow named Barcode Assembly foR Targeted Sequencing (BART-Seq), we analyze developmental states of thousands of single human pluripotent stem cells, either in different maintenance media or upon Wnt/β-catenin pathway activation, which identifies the mechanisms of differentiation induction. Moreover, we apply BART-Seq to the genetic screening of breast cancer patients and identify BRCA mutations with very high precision. The processing of thousands of samples and dynamic range measurements that outperform global transcriptomics techniques makes BART-Seq first targeted sequencing technique suitable for numerous research applications.

Overview

The claims and statistics of this paper haven’t been checked yet.

Free: it reads the open-access text and checks the first 5 claims that cite a source we can check. Create a free account to check every claim.

A few free checks a day · papers already verified open instantly · results are public

Integrity signals

Registry

Crossref · 10.1186/s13059-019-1748-6

Cites

49 of 49 references verified0 citation errors · 0 not checkable

Statistics

Figures

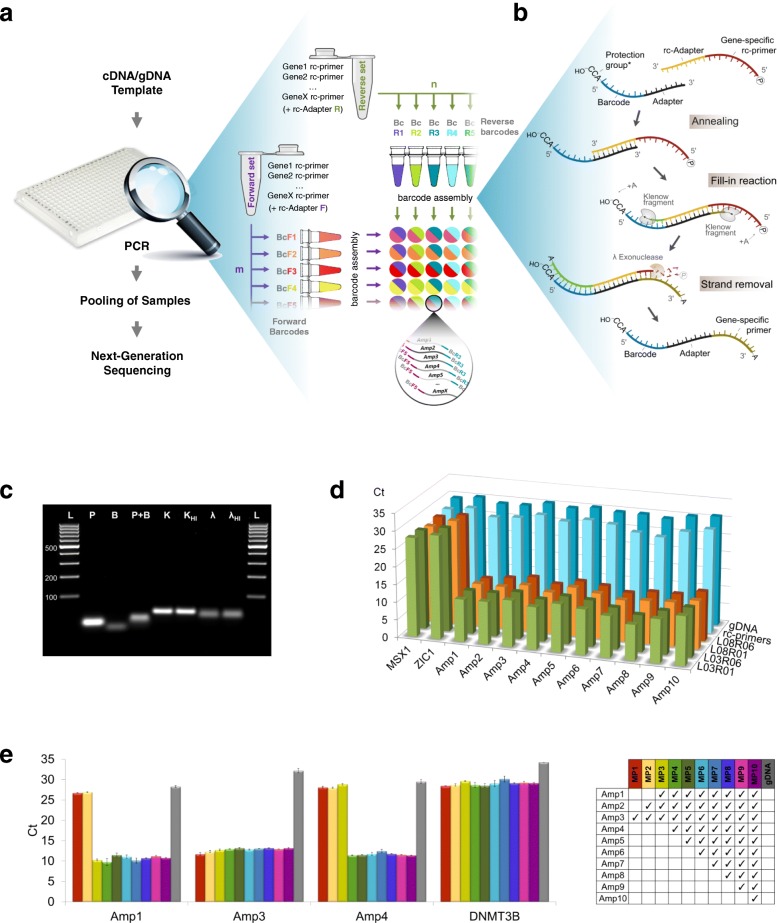
Fig. 1 The primer-barcode assembly method for targeted amplification by PCR. a The principle of combinatorial indexing of a set of amplicons (Gene1-GeneX) using panels of forward (m × BcF) and reverse (n × BcR) DNA barcodes, which are used to tag invariant forward and reverse multiplexed primer sets, respectively. The predetermined targets are amplified by multiplex PCR (inset), pooled, and analyzed by NGS (any platform). b Primer-barcode assembly in detail: a barcode and a set of reverse complementary (rc) primers (only one is shown) are hybridized via 10-mer adapter, followed by fill-in DNA synthesis of the two strands by the Klenow fragment (an A base is frequently added to the 3′ ends). rc strands with 5′P ends are preferred substrates of λ-exo, which thereby produces barcoded single-stranded gene-specific primers. *Optional trinucleotide “protection group” that inhibits λ-exo digestion (Additional file 7: Figure S1d). c Gel electrophoresis demonstrating the intermediate products of the assembly process: rc primers (P) and barcodes (B) following hybridization (P + B), Klenow fill-in (K, increasing the molecular weight), and heat inactivation (KHI). λ-exo treatment, which creates single-stranded barcoded primers (λ, reduces the molecular weight), and heat inactivation (λHI). Samples are a single barcode linked to an adapter and a single rc primer linked to an rc adapter, ran on 2.5% agarose gel with GeneRuler™ 100 bp DNA Ladder (L). d Co-amplification of 10 loci in BRCA1 and BRCA2 from gDNA using primers assembled with combinations of two forward (L03 and L08) and two reverse (R01 and R06) barcodes, and assessment of the products by qPCR using nested primers. Non-pre-amplified gDNA, non-barcoded rc primers, and non-targeted loci (MSX1 and ZIC1) are negative controls. e Assessment of the efficiency of primer synthesis as a function of the number of multiplexed primers. Primer set size was tested for the range of 1 to 10 (increments of 1), starting with Amp3 as singleplex, with the order shown in the right pane. The concentration of the individual primers was equal in all reactions, and the barcode concentration was matched to the total primer concentration. Non-pre-amplified gDNA and the non-targeted DNMT3B locus were used as negative controls. Error bars represent the standard deviation of three replicates
Fig. 1 The primer-barcode assembly method for targeted amplification by PCR. a The principle of combinatorial indexing of a set of amplicons (Gene1-GeneX) using panels of forward (m × BcF) and reverse (n × BcR) DNA barcodes, which are used to tag invariant forward and reverse multiplexed primer sets, respectively. The predetermined targets are amplified by multiplex PCR (inset), pooled, and analyzed by NGS (any platform). b Primer-barcode assembly in detail: a barcode and a set of reverse complementary (rc) primers (only one is shown) are hybridized via 10-mer adapter, followed by fill-in DNA synthesis of the two strands by the Klenow fragment (an A base is frequently added to the 3′ ends). rc strands with 5′P ends are preferred substrates of λ-exo, which thereby produces barcoded single-stranded gene-specific primers. *Optional trinucleotide “protection group” that inhibits λ-exo digestion (Additional file 7: Figure S1d). c Gel electrophoresis demonstrating the intermediate products of the assembly process: rc primers (P) and barcodes (B) following hybridization (P + B), Klenow fill-in (K, increasing the molecular weight), and heat inactivation (KHI). λ-exo treatment, which creates single-stranded barcoded primers (λ, reduces the molecular weight), and heat inactivation (λHI). Samples are a single barcode linked to an adapter and a single rc primer linked to an rc adapter, ran on 2.5% agarose gel with GeneRuler™ 100 bp DNA Ladder (L). d Co-amplification of 10 loci in BRCA1 and BRCA2 from gDNA using primers assembled with combinations of two forward (L03 and L08) and two reverse (R01 and R06) barcodes, and assessment of the products by qPCR using nested primers. Non-pre-amplified gDNA, non-barcoded rc primers, and non-targeted loci (MSX1 and ZIC1) are negative controls. e Assessment of the efficiency of primer synthesis as a function of the number of multiplexed primers. Primer set size was tested for the range of 1 to 10 (increments of 1), starting with Amp3 as singleplex, with the order shown in the right pane. The concentration of the individual primers was equal in all reactions, and the barcode concentration was matched to the total primer concentration. Non-pre-amplified gDNA and the non-targeted DNMT3B locus were used as negative controls. Error bars represent the standard deviation of three replicatesCC BY · PubMed Central
Fig. 2 Genotyping of cancer patients using gBART-Seq. a Schematic representation of the application of BART-Seq for genotyping cancer patients to replace mutation-specific assays. b A heatmap showing the BART-Seq reads assigned to Amp4 (wild-type and mutated alleles) using gDNA of varying concentrations from 96 patients, each represented by a unique barcode combination (L01-L08 × R01-R12). L09-L19 and R13-R19 are dummy barcodes that were not used in the primer-barcode assembly. Additional amplicons are shown in Additional file 7: Figure S1c and the complete count matrices in Additional file 3: Table S3a. c, d Genotypes of 96 breast cancer patients corresponding to 10 BRCA1 and BRCA2 mutations. Correspondence of BART-Seq results produced using 8-mer barcodes (c) and barcodes with the addition of 5′CCA trinucleotide as protection group (d), to the known genotypes is marked by green sectors (true positives). Further details about the protection group 5′CCA is given in Additional file 7: Figure S1. A summary of patient genotyping rates for c and d is shown at the bottom
Fig. 2 Genotyping of cancer patients using gBART-Seq. a Schematic representation of the application of BART-Seq for genotyping cancer patients to replace mutation-specific assays. b A heatmap showing the BART-Seq reads assigned to Amp4 (wild-type and mutated alleles) using gDNA of varying concentrations from 96 patients, each represented by a unique barcode combination (L01-L08 × R01-R12). L09-L19 and R13-R19 are dummy barcodes that were not used in the primer-barcode assembly. Additional amplicons are shown in Additional file 7: Figure S1c and the complete count matrices in Additional file 3: Table S3a. c, d Genotypes of 96 breast cancer patients corresponding to 10 BRCA1 and BRCA2 mutations. Correspondence of BART-Seq results produced using 8-mer barcodes (c) and barcodes with the addition of 5′CCA trinucleotide as protection group (d), to the known genotypes is marked by green sectors (true positives). Further details about the protection group 5′CCA is given in Additional file 7: Figure S1. A summary of patient genotyping rates for c and d is shown at the bottomCC BY · PubMed Central
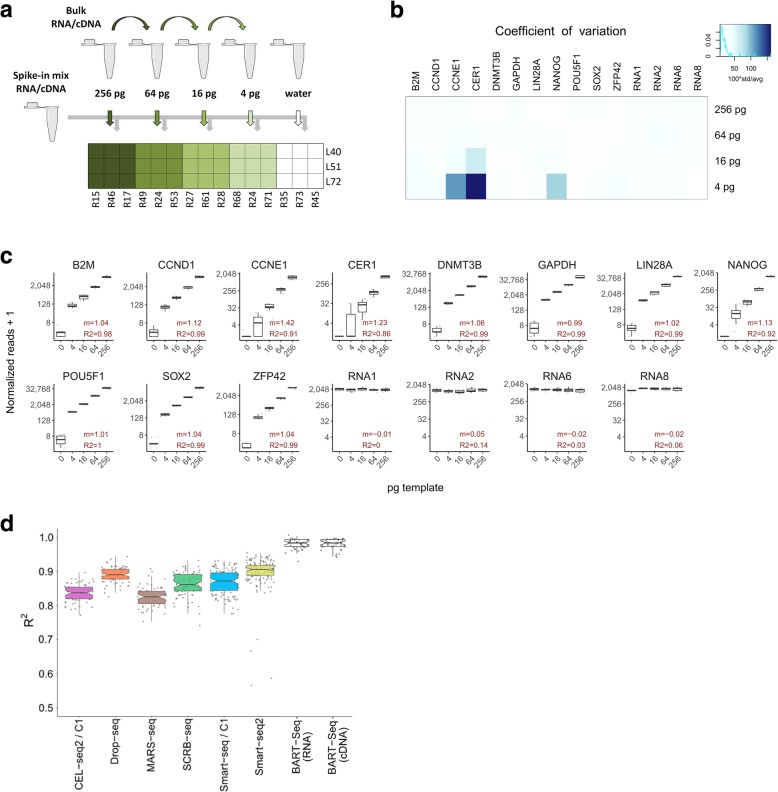
Fig. 3 Transcript quantification using rBART-Seq. a Fourfold serial dilutions of bulk RNA isolated from hPSCs [22] were combined with constant amount of spike-in RNA mixture, aliquoted into nine replicate wells (4–256 pg/well), and reverse transcribed, each of which was then indexed with a different barcode combination during PCR. Water mixed with spike-ins was included as a negative control. The experiment was repeated by reverse transcribing the bulk RNA and spike-in mixture separately and combining respective bulk cDNA dilutions with spike-in mix cDNA (Additional file 7: Figure S2). b The coefficient of variation of the normalized reads obtained from RNA dilution samples in a calculated for the groups of nine samples receiving identical template concentration, but different barcode combinations. The average was less than 25%. c Boxplots showing normalized read counts assigned to 11 transcripts and three RNA spike-ins, plotted against template concentration. Slopes (m) were close to 1 for the majority of the samples, and coefficients of determination (R2) were higher than 0.96 on average, in the linear regression models calculated for the 4–256 pg sample groups. d A plot based on Ziegenhain et al. [1], displaying the adjusted R2 values of linear regression models calculated using ERCC spike-in expression values obtained using different global transcriptomics methods as indicated. Corresponding BART-Seq values were obtained by calculating linear regression models using the average read counts of 11 genes across the experiment to model the reads observed in individual samples. R2 values had a median of 0.98 in the BART-Seq experiments
Fig. 3 Transcript quantification using rBART-Seq. a Fourfold serial dilutions of bulk RNA isolated from hPSCs [22] were combined with constant amount of spike-in RNA mixture, aliquoted into nine replicate wells (4–256 pg/well), and reverse transcribed, each of which was then indexed with a different barcode combination during PCR. Water mixed with spike-ins was included as a negative control. The experiment was repeated by reverse transcribing the bulk RNA and spike-in mixture separately and combining respective bulk cDNA dilutions with spike-in mix cDNA (Additional file 7: Figure S2). b The coefficient of variation of the normalized reads obtained from RNA dilution samples in a calculated for the groups of nine samples receiving identical template concentration, but different barcode combinations. The average was less than 25%. c Boxplots showing normalized read counts assigned to 11 transcripts and three RNA spike-ins, plotted against template concentration. Slopes (m) were close to 1 for the majority of the samples, and coefficients of determination (R2) were higher than 0.96 on average, in the linear regression models calculated for the 4–256 pg sample groups. d A plot based on Ziegenhain et al. [1], displaying the adjusted R2 values of linear regression models calculated using ERCC spike-in expression values obtained using different global transcriptomics methods as indicated. Corresponding BART-Seq values were obtained by calculating linear regression models using the average read counts of 11 genes across the experiment to model the reads observed in individual samples. R2 values had a median of 0.98 in the BART-Seq experimentsCC BY · PubMed Central
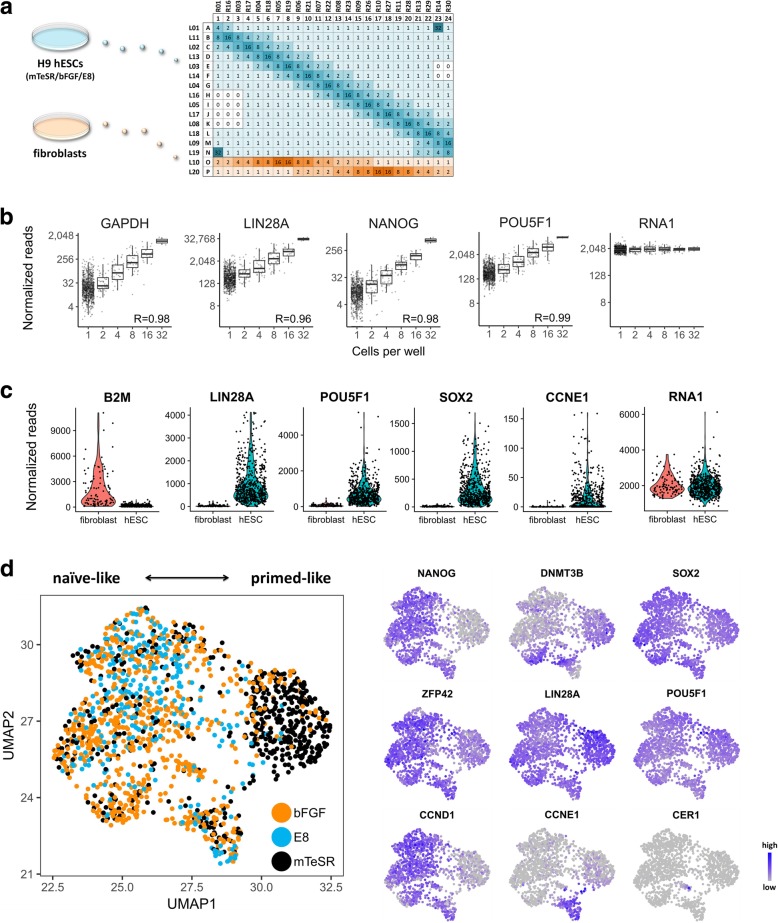
Fig. 4 Transcriptional heterogeneity of single hESCs. a Part of the barcode matrix used for the analysis of single (1) and multiple (2, 4, 8, 16, 32) hESCs maintained by different media (mTeSR™1, KSR-bFGF, and E8) and BJ fibroblasts. Negative controls were wells not receiving sorted cells (0). Prior to sorting, all wells (including negative controls) were pre-filled with 2 μl of RT mixture containing fixed concentrations of four RNA spike-ins. Over 4500 wells representing two biological replicates were analyzed as two libraries and sequenced using Illumina NextSeq for a total of 23.5 million processed paired reads. b Normalized read counts of selected genes plotted against the number of cells sorted per well (n = 858 samples from KSR-bFGF medium are shown). Correlation coefficients (R) between the cell counts and the median of corresponding reads are shown. c Violin plots illustrating the expression of a subset of genes by hESCs and fibroblasts. Samples include single cells and calculated one-cell values of multi-cell wells. Higher B2M expression by fibroblasts was noted [23], while pluripotency and cell cycle genes had notably higher expression in the hESCs. RNA1 represent the spike-ins. d UMAP projection of single hESCs (n = 1550) treated with three media (black dot, mTeSR; orange dot, bFGF; light blue dot, E8), with respect to 11 genes. Expression of some of the genes underlying the distribution is plotted on the right. All results are based on two biological replicates, and plots for the rest of the genes (and conditions) for b and d are shown in Additional file 7: Figure S4
Fig. 4 Transcriptional heterogeneity of single hESCs. a Part of the barcode matrix used for the analysis of single (1) and multiple (2, 4, 8, 16, 32) hESCs maintained by different media (mTeSR™1, KSR-bFGF, and E8) and BJ fibroblasts. Negative controls were wells not receiving sorted cells (0). Prior to sorting, all wells (including negative controls) were pre-filled with 2 μl of RT mixture containing fixed concentrations of four RNA spike-ins. Over 4500 wells representing two biological replicates were analyzed as two libraries and sequenced using Illumina NextSeq for a total of 23.5 million processed paired reads. b Normalized read counts of selected genes plotted against the number of cells sorted per well (n = 858 samples from KSR-bFGF medium are shown). Correlation coefficients (R) between the cell counts and the median of corresponding reads are shown. c Violin plots illustrating the expression of a subset of genes by hESCs and fibroblasts. Samples include single cells and calculated one-cell values of multi-cell wells. Higher B2M expression by fibroblasts was noted [23], while pluripotency and cell cycle genes had notably higher expression in the hESCs. RNA1 represent the spike-ins. d UMAP projection of single hESCs (n = 1550) treated with three media (black dot, mTeSR; orange dot, bFGF; light blue dot, E8), with respect to 11 genes. Expression of some of the genes underlying the distribution is plotted on the right. All results are based on two biological replicates, and plots for the rest of the genes (and conditions) for b and d are shown in Additional file 7: Figure S4CC BY · PubMed Central
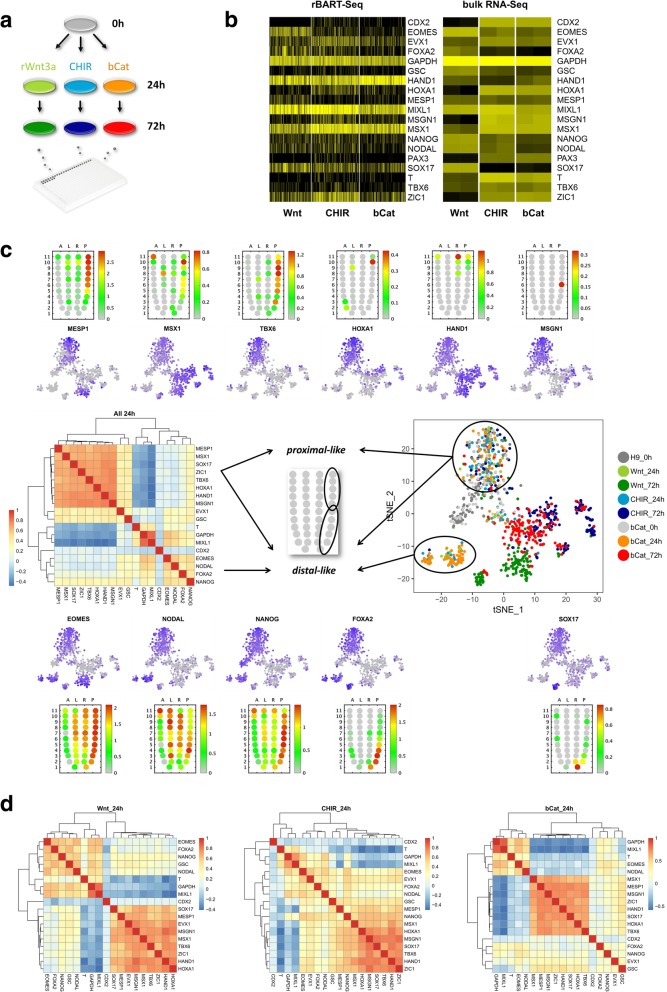
Fig. 5 Cell populations emerging upon stimulation of the Wnt/β-catenin pathway at different stages of the cascade. a A 72-h time course differentiation experiment of hESCs that were treated by recombinant Wnt3a, CHIR99021 (CHIR), or with doxycycline (dox) to induce the expression of transgenic β-cateninΔN90. Single cells were sampled at 0, 24, and 72 h for rBART-Seq analysis. A total of 4324 cells from three biological replicates were analyzed in a single NextSeq Mid Output run. b Heatmaps of the 19 genes analyzed by rBART-Seq (72 h, left) and TPM values (transcripts per million) of the same genes analyzed by bulk RNA-Seq, based on two independent replicates per condition (right). c A heatmap of the pairwise gene correlations calculated based on single cells at 24 h from the three treatments (left) and two-dimensional representation (tSNE) of the single cells sampled at 0, 24, and 72 h from all treatments, based on the expression of 19 genes (right). Expression of selected genes underlying the tSNE plot is shown in the upper and lower panels. The corn plots were derived from the iTranscriptome database [36] representing the locations of expression of the genes in epiblast stage mouse embryos (E6.5-E7.5). d Heatmaps of the pairwise gene correlations at 24 h for each of the treatments separately. Data presented in this figure represent one of the replicates. Rest of the genes and data from another replicate are shown in Additional file 7: Figure S5. Count matrices of all three biological replicates are available as Additional file 6: Table S6
Fig. 5 Cell populations emerging upon stimulation of the Wnt/β-catenin pathway at different stages of the cascade. a A 72-h time course differentiation experiment of hESCs that were treated by recombinant Wnt3a, CHIR99021 (CHIR), or with doxycycline (dox) to induce the expression of transgenic β-cateninΔN90. Single cells were sampled at 0, 24, and 72 h for rBART-Seq analysis. A total of 4324 cells from three biological replicates were analyzed in a single NextSeq Mid Output run. b Heatmaps of the 19 genes analyzed by rBART-Seq (72 h, left) and TPM values (transcripts per million) of the same genes analyzed by bulk RNA-Seq, based on two independent replicates per condition (right). c A heatmap of the pairwise gene correlations calculated based on single cells at 24 h from the three treatments (left) and two-dimensional representation (tSNE) of the single cells sampled at 0, 24, and 72 h from all treatments, based on the expression of 19 genes (right). Expression of selected genes underlying the tSNE plot is shown in the upper and lower panels. The corn plots were derived from the iTranscriptome database [36] representing the locations of expression of the genes in epiblast stage mouse embryos (E6.5-E7.5). d Heatmaps of the pairwise gene correlations at 24 h for each of the treatments separately. Data presented in this figure represent one of the replicates. Rest of the genes and data from another replicate are shown in Additional file 7: Figure S5. Count matrices of all three biological replicates are available as Additional file 6: Table S6CC BY · PubMed Central

Verification

Claims the paper makes

The claims and statistics of this paper haven’t been checked yet.

Free: it reads the open-access text and checks the first 5 claims that cite a source we can check. Create a free account to check every claim.

A few free checks a day · papers already verified open instantly · results are public

Claims other papers make about this one

Each is checked against this paper’s own text: does it say what the citing paper says it does?

Self-check

Percentages, sums and reported differences re-computed from the paper’s own numbers.

The self-check needs the paper’s full text.

Citations

Cites

Show all 49 references

Research works printed but not linked: 3

  1. Tao L, Raz O, Marx Z, Biezuner T, Amir S, Milo L, et al. A biological-computational human cell lineage discovery platform based on duplex molecular inversion probes. bioRxiv. 2018;18:191296.
  2. Uzbas F, Opperer F, Shaposhnikov D, Drukker M. BART-seq: cost-effective massively parallel targeted sequencing for genomics and transcriptomics. GSE107723. Gene Expression Omnibus. 2019; https://www.ncbi.nlm.nih.gov/geo/query/acc.cgi?acc=GSE107723 .
  3. Shaposhnikov D. Total RNA sequencing of a time course treatment of human embryonic stem cells with CHIR99021, recombinant Wnt3a, and a time course activation of constitutively active beta-catenin expression. GSE130381. Gene Expression Omnibus. 2019; https://www.ncbi.nlm.nih.gov/geo/query/acc.cgi?acc=GSE130381 .

Cited by

See all 23

Metadata

Authors
Uzbas, F., Opperer, F., Sönmezer, C., Shaposhnikov, D., Sass, S., Krendl, C., Angerer, P., Theis, F. J., Mueller, N. S., & Drukker, M.
Affiliations
Helmholtz Munich (DE)
Corresponding author
  • Mueller, Nikola S.
  • Drukker, Micha
Venue
Genome Biology
Published
2019-08-06
Volume
20
Issue
1
Pages
155-155
ISSN
  • 1465-6906 (ISSN-L)
  • 1474-760X
OpenAlex
W2964915735
Cited by
23
References
49
Citations by year
2026: 1 · 2025: 4 · 2024: 2 · 2023: 3 · 2022: 4 · 2021: 4 · 2020: 5
FWCI
1.07
Type
journal article
Language
en
Open access
Licence
Locations
  • Genome biology (publishedVersion, cc-by)
  • Europe PMC (PubMed Central) (publishedVersion, cc-by)
  • PubMed Central (publishedVersion, cc-by)
  • PubMed (publishedVersion)
  • Leiden Repository (Leiden University) (submittedVersion, cc-by)
  • PuSH - Publication Server of Helmholtz Zentrum München (submittedVersion, cc-by)
  • DOAJ (DOAJ: Directory of Open Access Journals) (submittedVersion)
  • mediaTUM – the media and publications repository of the Technical University Munich (Technical University Munich) (submittedVersion, other-oa)
  • Leiden Repository (Leiden University) (submittedVersion)
  • Site cant be reached (submittedVersion, cc-by)
  • Data Archiving and Networked Services (DANS) (submittedVersion, cc-by)
Funders
  • Deutscher Akademischer Austauschdienst (Ph.D. Grant)
  • Helmholtz Center Munich
Topics
  • Life Sciences › Biochemistry, Genetics and Molecular Biology › Molecular Biology › Single-cell and spatial transcriptomics
  • Life Sciences › Biochemistry, Genetics and Molecular Biology › Molecular Biology › Genomics and Phylogenetic Studies
  • Life Sciences › Biochemistry, Genetics and Molecular Biology › Molecular Biology › Gene expression and cancer classification
Keywords
targeted sequencing, DNA barcodes, multiplexing, single-cell analysis, transcriptomics, pluripotent stem cells, Wnt/β-catenin signaling, stem cell differentiation, breast cancer, BRCA mutations, genetic screening, cost-effective sequencing
MeSH terms
Breast Neoplasms, Cost-Benefit Analysis, Female, Humans, Sequence Analysis, RNA, Gene Expression Profiling, Genomics, Pluripotent Stem Cells, Embryonic Stem Cells, Workflow, Single-Cell Analysis, High-Throughput Nucleotide Sequencing, Wnt Signaling Pathway

About these checks

Registry, retraction, Cites and statistics results are computed, not judged, with one exception: a printed reference that no index lists is read once by a model before it counts as a citation error. Claims are extracted by a model and kept only when their quote appears verbatim in the text; each cited source is then checked, with a model’s help, for whether it says what the claim relies on. Those verdicts can be wrong — read the claim’s quote and the cited source before relying on one.

Statistics and arithmetic are recomputed, not judged.

Confidence bands are shown only for fields calibrated on our annotated test set. None is calibrated yet, so no band is shown.

What counts as a claim ›How we measure confidence ›How we check this ›

Are you an author, or do you see a problem with this page? Request a review

How to cite

Cite CoChat for the checks on this page, and the paper for its own findings.

This page
CoChat. (2026). Citation check: BART-Seq: cost-effective massively parallelized targeted sequencing for genomics, transcriptomics, and single-cell analysis. https://app.cochat.ai/papers/10.1186/s13059-019-1748-6
The paper
Uzbas, F., Opperer, F., Sönmezer, C., Shaposhnikov, D., Sass, S., Krendl, C., Angerer, P., Theis, F. J., Mueller, N. S., & Drukker, M. (2019). BART-Seq: cost-effective massively parallelized targeted sequencing for genomics, transcriptomics, and single-cell analysis. Genome Biology. https://doi.org/10.1186/s13059-019-1748-6

Data sources

Bibliographic data: Semantic Scholar, OpenAlex, Crossref.

Contains information from the Semantic Scholar Academic Graph Datasets, made available under the ODC Attribution License (ODC-BY 1.0).

Semantic Scholar’s data is described in: Kinney, R., et al. (2023). The Semantic Scholar Open Data Platform. arXiv:2301.10140.