Student or educator? Sign up with your school email and get 6 months of Pro free.
CoChat

The DOI matches its Crossref record; 44 of the 45 references it cites were found in a registry or an index.

A benchmark of batch-effect correction methods for single-cell RNA sequencing data

Open access
Tran, Hoa Thi Nhu, Ang, Kok Siong, Chevrier, Marion, Zhang, Xiaomeng, Lee, Nicole Yee Shin, Goh, Michelle, Chen, Jinmiao · 2020 · Genome Biology

Abstract

Background: Large-scale single-cell transcriptomic datasets generated using different technologies contain batch-specific systematic variations that present a challenge to batch-effect removal and data integration. With continued growth expected in scRNA-seq data, achieving effective batch integration with available computational resources is crucial. Here, we perform an in-depth benchmark study on available batch correction methods to determine the most suitable method for batch-effect removal. Results: We compare 14 methods in terms of computational runtime, the ability to handle large datasets, and batch-effect correction efficacy while preserving cell type purity. Five scenarios are designed for the study: identical cell types with different technologies, non-identical cell types, multiple batches, big data, and simulated data. Performance is evaluated using four benchmarking metrics including kBET, LISI, ASW, and ARI. We also investigate the use of batch-corrected data to study differential gene expression. Conclusion: Based on our results, Harmony, LIGER, and Seurat 3 are the recommended methods for batch integration. Due to its significantly shorter runtime, Harmony is recommended as the first method to try, with the other methods as viable alternatives.

Overview

The claims and statistics of this paper haven’t been checked yet.

Run the check — free, no account needed. It reads the open-access text and checks the sources it cites.

A few free checks a day · papers already verified open instantly · results are public

Integrity signals

Registry

Crossref · 10.1186/s13059-019-1850-9

Cites

44 of 44 references verified0 citation errors · 0 not checkable

Statistics

Figures

Fig. 1 Benchmarking 14 methods on ten datasets using five evaluation metrics. a Benchmarking workflow. We evaluated the performance of 14 batch correcting algorithms in terms of their ability to integrate batches while maintaining accuracy in terms of cell type separation. We employed t-SNE and UMAP visualizations in conjunction with the kBET, LISI, ASW, ARI, and DEG benchmarking metrics to evaluate the batch correction results. b Description of the ten datasets on which the batch correction algorithms were tested
Fig. 1 Benchmarking 14 methods on ten datasets using five evaluation metrics. a Benchmarking workflow. We evaluated the performance of 14 batch correcting algorithms in terms of their ability to integrate batches while maintaining accuracy in terms of cell type separation. We employed t-SNE and UMAP visualizations in conjunction with the kBET, LISI, ASW, ARI, and DEG benchmarking metrics to evaluate the batch correction results. b Description of the ten datasets on which the batch correction algorithms were testedCC BY · PubMed Central
Fig. 2 Qualitative evaluation of 14 batch-effect correction methods using UMAP visualization for dataset 2 of mouse cell atlas. The 14 methods are organized into two panels, with the top panel showing UMAP plots of raw data, Seurat 2, Seurat 3, Harmony, fastMNN, MNN Correct, ComBat, and limma outputs, while the bottom panel shows the UMAP plots of scGen, Scanorama, MMD-ResNet, ZINB-WaVE, scMerge, LIGER, and BBKNN outputs. Each panel contains two rows of UMAP plots. In the first row, cells are colored by batch, and in the second by cell type
Fig. 2 Qualitative evaluation of 14 batch-effect correction methods using UMAP visualization for dataset 2 of mouse cell atlas. The 14 methods are organized into two panels, with the top panel showing UMAP plots of raw data, Seurat 2, Seurat 3, Harmony, fastMNN, MNN Correct, ComBat, and limma outputs, while the bottom panel shows the UMAP plots of scGen, Scanorama, MMD-ResNet, ZINB-WaVE, scMerge, LIGER, and BBKNN outputs. Each panel contains two rows of UMAP plots. In the first row, cells are colored by batch, and in the second by cell typeCC BY · PubMed Central
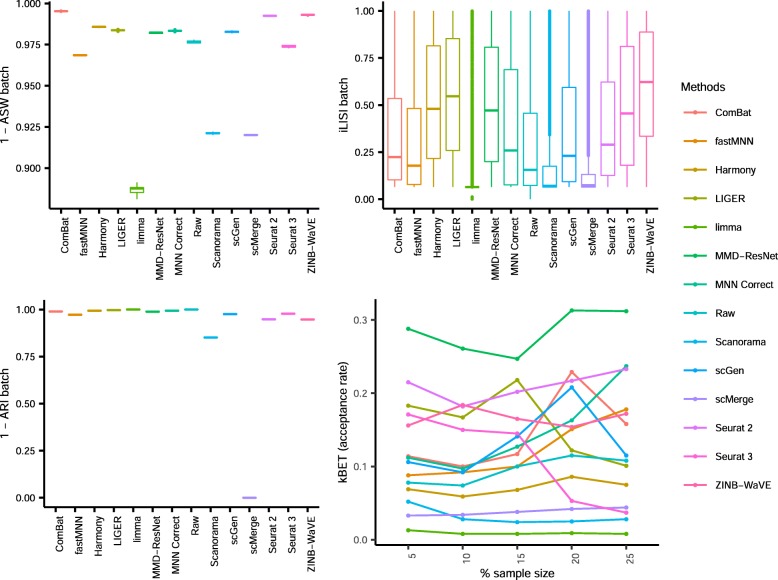
Fig. 3 Quantitative evaluation of 14 batch-effect correction methods using the four assessment metrics a ASW, b ARI, c LISI, and d kBET on dataset 2 of mouse cell atlas. Methods appearing at the upper right quadrant of the ASW, ARI, and LISI plots are the good performing methods. Methods with higher kBET acceptance rates are the better performing methods
Fig. 3 Quantitative evaluation of 14 batch-effect correction methods using the four assessment metrics a ASW, b ARI, c LISI, and d kBET on dataset 2 of mouse cell atlas. Methods appearing at the upper right quadrant of the ASW, ARI, and LISI plots are the good performing methods. Methods with higher kBET acceptance rates are the better performing methodsCC BY · PubMed Central
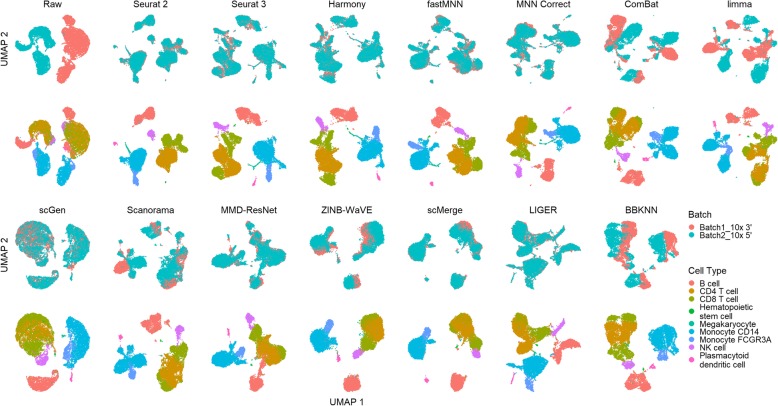
Fig. 4 Qualitative evaluation of 14 batch-effect correction methods using UMAP visualization for dataset 5 of human peripheral blood mononuclear cells. The 14 methods are organized into two panels, with the top panel showing UMAP plots of raw data, Seurat 2, Seurat 3, Harmony, fastMNN, MNN Correct, ComBat, and limma outputs, while the bottom panel shows the UMAP plots of scGen, Scanorama, MMD-ResNet, ZINB-WaVE, scMerge, LIGER, and BBKNN outputs. Each panel contains two rows of UMAP plots. In the first row, cells are colored by batch, and in the second by cell type
Fig. 4 Qualitative evaluation of 14 batch-effect correction methods using UMAP visualization for dataset 5 of human peripheral blood mononuclear cells. The 14 methods are organized into two panels, with the top panel showing UMAP plots of raw data, Seurat 2, Seurat 3, Harmony, fastMNN, MNN Correct, ComBat, and limma outputs, while the bottom panel shows the UMAP plots of scGen, Scanorama, MMD-ResNet, ZINB-WaVE, scMerge, LIGER, and BBKNN outputs. Each panel contains two rows of UMAP plots. In the first row, cells are colored by batch, and in the second by cell typeCC BY · PubMed Central
Fig. 5 Quantitative evaluation of 14 batch-effect correction methods using the four assessment metrics a ASW, b ARI, c LISI, and d kBET on dataset 5 of human peripheral blood mononuclear cells. Methods appearing at the upper right quadrant of the ASW, ARI, and LISI plots are the good performing methods. Methods with higher kBET acceptance rates are the better performing methods
Fig. 5 Quantitative evaluation of 14 batch-effect correction methods using the four assessment metrics a ASW, b ARI, c LISI, and d kBET on dataset 5 of human peripheral blood mononuclear cells. Methods appearing at the upper right quadrant of the ASW, ARI, and LISI plots are the good performing methods. Methods with higher kBET acceptance rates are the better performing methodsCC BY · PubMed Central
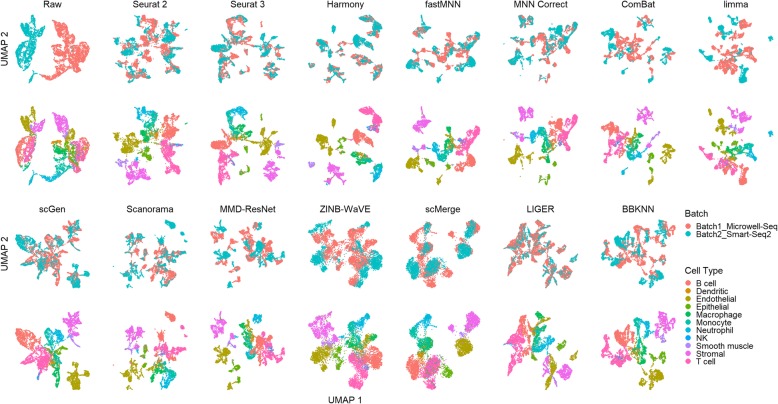
Fig. 6 Qualitative evaluation of 14 batch-effect correction methods using UMAP visualization for dataset 1 of human dendritic cells. The 14 methods are organized into two panels, with the top panel showing UMAP plots of raw data, Seurat 2, Seurat 3, Harmony, fastMNN, MNN Correct, ComBat, and limma outputs, while the bottom panel shows the UMAP plots of scGen, Scanorama, MMD-ResNet, ZINB-WaVE, scMerge, LIGER, and BBKNN outputs. Each panel contains two rows of UMAP plots. In the first row, cells are colored by batch, and in the second by cell type
Fig. 6 Qualitative evaluation of 14 batch-effect correction methods using UMAP visualization for dataset 1 of human dendritic cells. The 14 methods are organized into two panels, with the top panel showing UMAP plots of raw data, Seurat 2, Seurat 3, Harmony, fastMNN, MNN Correct, ComBat, and limma outputs, while the bottom panel shows the UMAP plots of scGen, Scanorama, MMD-ResNet, ZINB-WaVE, scMerge, LIGER, and BBKNN outputs. Each panel contains two rows of UMAP plots. In the first row, cells are colored by batch, and in the second by cell typeCC BY · PubMed Central
Fig. 7 Quantitative evaluation of 14 batch-effect correction methods using the four assessment metrics a ASW, b ARI, c LISI, and d kBET on dataset 1 of human dendritic cells. Methods appearing at the upper right quadrant of the ASW, ARI, and LISI plots are the good performing methods. Methods with higher kBET acceptance rates are the better performing methods
Fig. 7 Quantitative evaluation of 14 batch-effect correction methods using the four assessment metrics a ASW, b ARI, c LISI, and d kBET on dataset 1 of human dendritic cells. Methods appearing at the upper right quadrant of the ASW, ARI, and LISI plots are the good performing methods. Methods with higher kBET acceptance rates are the better performing methodsCC BY · PubMed Central
Fig. 8 Qualitative evaluation of 14 batch-effect correction methods using UMAP visualization for dataset 6 of cell lines. The 14 methods are organized into two panels, with the top panel showing UMAP plots of raw data, Seurat 2, Seurat 3, Harmony, fastMNN, MNN Correct, ComBat, and limma outputs, while the bottom panel shows the UMAP plots of scGen, Scanorama, MMD-ResNet, ZINB-WaVE, scMerge, LIGER, and BBKNN outputs. Each panel contains two rows of UMAP plots. In the first row, cells are colored by batch, and in the second by cell type
Fig. 8 Qualitative evaluation of 14 batch-effect correction methods using UMAP visualization for dataset 6 of cell lines. The 14 methods are organized into two panels, with the top panel showing UMAP plots of raw data, Seurat 2, Seurat 3, Harmony, fastMNN, MNN Correct, ComBat, and limma outputs, while the bottom panel shows the UMAP plots of scGen, Scanorama, MMD-ResNet, ZINB-WaVE, scMerge, LIGER, and BBKNN outputs. Each panel contains two rows of UMAP plots. In the first row, cells are colored by batch, and in the second by cell typeCC BY · PubMed Central
Fig. 9 Quantitative evaluation of 14 batch-effect correction methods using the four assessment metrics a ASW, b ARI, c LISI, and d kBET on dataset 6 of cell lines. Methods appearing at the upper right quadrant of the ASW, ARI, and LISI plots are the good performing methods. Methods with higher kBET acceptance rates are the better performing methods
Fig. 9 Quantitative evaluation of 14 batch-effect correction methods using the four assessment metrics a ASW, b ARI, c LISI, and d kBET on dataset 6 of cell lines. Methods appearing at the upper right quadrant of the ASW, ARI, and LISI plots are the good performing methods. Methods with higher kBET acceptance rates are the better performing methodsCC BY · PubMed Central
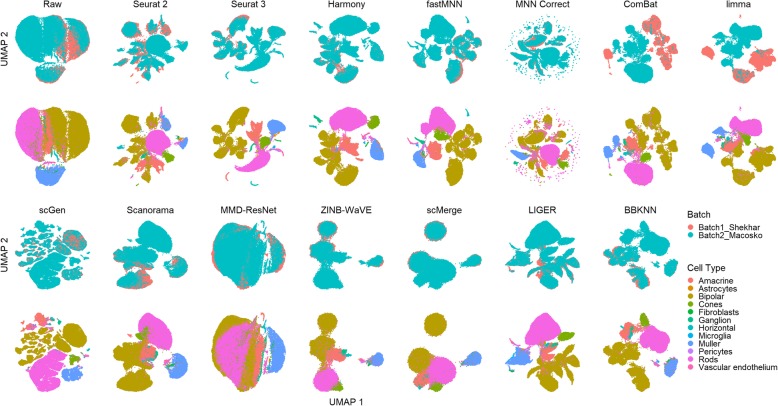
Fig. 10 Qualitative evaluation of 14 batch-effect correction methods using UMAP visualization for dataset 7 of mouse retinal cells. The 14 methods are organized into two panels, with the top panel showing UMAP plots of raw data, Seurat 2, Seurat 3, Harmony, fastMNN, MNN Correct, ComBat, and limma outputs, while the bottom panel shows the UMAP plots of scGen, Scanorama, MMD-ResNet, ZINB-WaVE, scMerge, LIGER, and BBKNN outputs. Each panel contains two rows of UMAP plots. In the first row, cells are colored by batch, and in the second by cell type
Fig. 10 Qualitative evaluation of 14 batch-effect correction methods using UMAP visualization for dataset 7 of mouse retinal cells. The 14 methods are organized into two panels, with the top panel showing UMAP plots of raw data, Seurat 2, Seurat 3, Harmony, fastMNN, MNN Correct, ComBat, and limma outputs, while the bottom panel shows the UMAP plots of scGen, Scanorama, MMD-ResNet, ZINB-WaVE, scMerge, LIGER, and BBKNN outputs. Each panel contains two rows of UMAP plots. In the first row, cells are colored by batch, and in the second by cell typeCC BY · PubMed Central
Fig. 11 Quantitative evaluation of 14 batch-effect correction methods using the four assessment metrics a ASW, b ARI, c LISI, and d kBET on dataset 7 of mouse retinal cells. Methods appearing at the upper right quadrant of the ASW, ARI, and LISI plots are the good performing methods. Methods with higher kBET acceptance rates are the better performing methods
Fig. 11 Quantitative evaluation of 14 batch-effect correction methods using the four assessment metrics a ASW, b ARI, c LISI, and d kBET on dataset 7 of mouse retinal cells. Methods appearing at the upper right quadrant of the ASW, ARI, and LISI plots are the good performing methods. Methods with higher kBET acceptance rates are the better performing methodsCC BY · PubMed Central
Fig. 12 Qualitative evaluation of 14 batch-effect correction methods using UMAP visualization for dataset 10 of mouse hematopoietic stem and progenitor cells. The 14 methods are organized into two panels, with the top panel showing UMAP plots of raw data, Seurat 2, Seurat 3, Harmony, fastMNN, MNN Correct, ComBat, and limma outputs, while the bottom panel shows the UMAP plots of scGen, Scanorama, MMD-ResNet, ZINB-WaVE, scMerge, LIGER, and BBKNN outputs. Each panel contains two rows of UMAP plots. In the first row, cells are colored by batch, and in the second by cell type
Fig. 12 Qualitative evaluation of 14 batch-effect correction methods using UMAP visualization for dataset 10 of mouse hematopoietic stem and progenitor cells. The 14 methods are organized into two panels, with the top panel showing UMAP plots of raw data, Seurat 2, Seurat 3, Harmony, fastMNN, MNN Correct, ComBat, and limma outputs, while the bottom panel shows the UMAP plots of scGen, Scanorama, MMD-ResNet, ZINB-WaVE, scMerge, LIGER, and BBKNN outputs. Each panel contains two rows of UMAP plots. In the first row, cells are colored by batch, and in the second by cell typeCC BY · PubMed Central
Fig. 13 Quantitative evaluation of 14 batch-effect correction methods using the four assessment metrics a ASW, b ARI, c LISI, and d kBET on dataset 10 of mouse hematopoietic stem and progenitor cells. Methods appearing at the upper right quadrant of the ASW, ARI, and LISI plots are the good performing methods. Methods with higher kBET acceptance rates are the better performing methods
Fig. 13 Quantitative evaluation of 14 batch-effect correction methods using the four assessment metrics a ASW, b ARI, c LISI, and d kBET on dataset 10 of mouse hematopoietic stem and progenitor cells. Methods appearing at the upper right quadrant of the ASW, ARI, and LISI plots are the good performing methods. Methods with higher kBET acceptance rates are the better performing methodsCC BY · PubMed Central
Fig. 14 Qualitative evaluation of 14 batch-effect correction methods using UMAP visualization for dataset 4 of human pancreatic cells. The 14 methods are organized into two panels, with the top panel showing UMAP plots of raw data, Seurat 2, Seurat 3, Harmony, fastMNN, MNN Correct, ComBat, and limma outputs, while the bottom panel shows the UMAP plots of scGen, Scanorama, MMD-ResNet, ZINB-WaVE, scMerge, LIGER, and BBKNN outputs. Each panel contains two rows of UMAP plots. In the first row, cells are colored by batch, and in the second by cell type
Fig. 14 Qualitative evaluation of 14 batch-effect correction methods using UMAP visualization for dataset 4 of human pancreatic cells. The 14 methods are organized into two panels, with the top panel showing UMAP plots of raw data, Seurat 2, Seurat 3, Harmony, fastMNN, MNN Correct, ComBat, and limma outputs, while the bottom panel shows the UMAP plots of scGen, Scanorama, MMD-ResNet, ZINB-WaVE, scMerge, LIGER, and BBKNN outputs. Each panel contains two rows of UMAP plots. In the first row, cells are colored by batch, and in the second by cell typeCC BY · PubMed Central
Fig. 15 Quantitative evaluation of 14 batch-effect correction methods using the four assessment metrics a ASW, b ARI, c LISI, and d kBET on dataset 4 of human pancreatic cells. Methods appearing at the upper right quadrant of the ASW, ARI, and LISI plots are the good performing methods. Methods with higher kBET acceptance rates are the better performing methods
Fig. 15 Quantitative evaluation of 14 batch-effect correction methods using the four assessment metrics a ASW, b ARI, c LISI, and d kBET on dataset 4 of human pancreatic cells. Methods appearing at the upper right quadrant of the ASW, ARI, and LISI plots are the good performing methods. Methods with higher kBET acceptance rates are the better performing methodsCC BY · PubMed Central
Fig. 16 Qualitative evaluation of 14 batch-effect correction methods using UMAP visualization for dataset 8 of mouse brain. The 14 methods are organized into two panels, with the top panel showing UMAP plots of raw data, Seurat 2, Seurat 3, Harmony, fastMNN, MNN Correct, ComBat, and limma outputs, while the bottom panel shows the UMAP plots of scGen, Scanorama, MMD-ResNet, ZINB-WaVE, scMerge, LIGER, and BBKNN outputs. Each panel contains two rows of UMAP plots. In the first row, cells are colored by batch, and in the second by cell type
Fig. 16 Qualitative evaluation of 14 batch-effect correction methods using UMAP visualization for dataset 8 of mouse brain. The 14 methods are organized into two panels, with the top panel showing UMAP plots of raw data, Seurat 2, Seurat 3, Harmony, fastMNN, MNN Correct, ComBat, and limma outputs, while the bottom panel shows the UMAP plots of scGen, Scanorama, MMD-ResNet, ZINB-WaVE, scMerge, LIGER, and BBKNN outputs. Each panel contains two rows of UMAP plots. In the first row, cells are colored by batch, and in the second by cell typeCC BY · PubMed Central
Fig. 17 Quantitative evaluation of 14 batch-effect correction methods using the four assessment metrics a ASW, b ARI, c LISI, and d kBET on dataset 8 of mouse brain. Methods appearing at the upper right quadrant of the ASW, ARI, and LISI plots are the good performing methods. Methods with higher kBET acceptance rates are the better performing methods
Fig. 17 Quantitative evaluation of 14 batch-effect correction methods using the four assessment metrics a ASW, b ARI, c LISI, and d kBET on dataset 8 of mouse brain. Methods appearing at the upper right quadrant of the ASW, ARI, and LISI plots are the good performing methods. Methods with higher kBET acceptance rates are the better performing methodsCC BY · PubMed Central
Fig. 18 Qualitative evaluation of 14 batch-effect correction methods using UMAP visualization for dataset 9 of human cell atlas. The 14 methods are organized into two panels, with the top panel showing UMAP plots of raw data, Seurat 2, Seurat 3, Harmony, fastMNN, MNN Correct, ComBat, and limma outputs, while the bottom panel shows the UMAP plots of scGen, Scanorama, MMD-ResNet, ZINB-WaVE, scMerge, LIGER, and BBKNN outputs. Cells are colored by batch
Fig. 18 Qualitative evaluation of 14 batch-effect correction methods using UMAP visualization for dataset 9 of human cell atlas. The 14 methods are organized into two panels, with the top panel showing UMAP plots of raw data, Seurat 2, Seurat 3, Harmony, fastMNN, MNN Correct, ComBat, and limma outputs, while the bottom panel shows the UMAP plots of scGen, Scanorama, MMD-ResNet, ZINB-WaVE, scMerge, LIGER, and BBKNN outputs. Cells are colored by batchCC BY · PubMed Central
Fig. 19 Quantitative evaluation of 14 batch-effect correction methods using the four assessment metrics a ASW, b ARI, c LISI, and d kBET on dataset 9 of human cell atlas. Methods appearing at the upper right quadrant of the ASW, ARI, and LISI plots are the good performing methods. Methods with higher kBET acceptance rates are the better performing methods
Fig. 19 Quantitative evaluation of 14 batch-effect correction methods using the four assessment metrics a ASW, b ARI, c LISI, and d kBET on dataset 9 of human cell atlas. Methods appearing at the upper right quadrant of the ASW, ARI, and LISI plots are the good performing methods. Methods with higher kBET acceptance rates are the better performing methodsCC BY · PubMed Central
Fig. 20 Evaluation of eight batch-effect correction methods using simulated datasets and differential gene expression analysis. a Evaluation workflow: six sets of simulation data with predefined batch effect and differential gene expression profiles were generated using the Splatter package with varied parameters. The eight methods that return corrected expression matrices were applied to the simulated data, and the batch-corrected output were subsequently subjected to differential gene expression analysis with the Seurat package. Differentially expressed genes (DEGs) identified from the batch-corrected matrices were compared to the ground truth DEGs, and accuracy metrics including precision, recall, and F-score were calculated. b Description of the six simulated datasets. Different combinations of parameters were used to cover different scenarios of cell population sizes and drop-out rates. c F-score boxplot for the eight methods using all genes or HVGs
Fig. 20 Evaluation of eight batch-effect correction methods using simulated datasets and differential gene expression analysis. a Evaluation workflow: six sets of simulation data with predefined batch effect and differential gene expression profiles were generated using the Splatter package with varied parameters. The eight methods that return corrected expression matrices were applied to the simulated data, and the batch-corrected output were subsequently subjected to differential gene expression analysis with the Seurat package. Differentially expressed genes (DEGs) identified from the batch-corrected matrices were compared to the ground truth DEGs, and accuracy metrics including precision, recall, and F-score were calculated. b Description of the six simulated datasets. Different combinations of parameters were used to cover different scenarios of cell population sizes and drop-out rates. c F-score boxplot for the eight methods using all genes or HVGsCC BY · PubMed Central
Fig. 21 Efficacy and efficiency of the 14 batch-effect correction methods. a Rank sum of the assessment metrics. Methods were ranked based on each of the ASW, ARI, LISI, and kBET metrics, and the rankings were then combined across all metrics using the rank sum approach. The height of the ridgelines represents the rank sum scores across different datasets, with a lower rank sum score denoting better performance. Methods are ordered from bottom to top by increasing sum of rank scores across all ten datasets. Thus, methods appearing at the bottom are the best. b Memory usage of ten methods on dataset 8. c Runtime of 14 methods on ten datasets. Color represents log10(time in seconds), node size represents log10(cell number)
Fig. 21 Efficacy and efficiency of the 14 batch-effect correction methods. a Rank sum of the assessment metrics. Methods were ranked based on each of the ASW, ARI, LISI, and kBET metrics, and the rankings were then combined across all metrics using the rank sum approach. The height of the ridgelines represents the rank sum scores across different datasets, with a lower rank sum score denoting better performance. Methods are ordered from bottom to top by increasing sum of rank scores across all ten datasets. Thus, methods appearing at the bottom are the best. b Memory usage of ten methods on dataset 8. c Runtime of 14 methods on ten datasets. Color represents log10(time in seconds), node size represents log10(cell number)CC BY · PubMed Central

Verification

Claims the paper makes

The claims and statistics of this paper haven’t been checked yet.

Run the check — free, no account needed. It reads the open-access text and checks the sources it cites.

A few free checks a day · papers already verified open instantly · results are public

Claims other papers make about this one

Each is checked against this paper’s own text: does it say what the citing paper says it does?

Self-check

Percentages, sums and reported differences re-computed from the paper’s own numbers.

The self-check needs the paper’s full text.

Citations

Cites

Show all 45 references

Research works printed but not linked: 2

  1. Goodfellow I, Pouget-Abadie J, Mirza M, Xu B, Warde-Farley D, Ozair S, et al. Generative adversarial nets. In: Ghahramani Z, Welling M, Cortes C, Lawrence ND, Weinberger KQ, editors. Adv Neural Inf Process Syst 27: Curran Associates, Inc; 2014. p. 2672–80. Available from: http://papers.nips.cc/paper/5423-generative-adversarial-nets.pdf. Accessed 11 Mar 2019.
  2. Deng Y, Bao F, Dai Q, Wu LF, Altschuler SJ. Massive single-cell RNA-seq analysis and imputation via deep learning. bioRxiv. 2018:315556 Available from: http://biorxiv.org/content/early/2018/11/27/315556.abstract. Accessed 5 July 2019.

Cited by

See all 1,113

Metadata

Authors
Tran, H. T. N., Ang, K. S., Chevrier, M., Zhang, X., Lee, N. Y. S., Goh, M., & Chen, J.
Affiliations
Agency for Science, Technology and Research (SG)
Corresponding author
Chen, Jinmiao
Venue
Genome Biology
Published
2020-01-16
Volume
21
Issue
1
Pages
12-12
ISSN
  • 1465-6906 (ISSN-L)
  • 1474-760X
OpenAlex
W3002417351
Cited by
1,113
References
45
Citations by year
2026: 145 · 2025: 170 · 2024: 188 · 2023: 187 · 2022: 180 · 2021: 178 · 2020: 62
FWCI
50.62
Type
journal article
Language
en
Open access
Licence
Locations
  • Genome biology (publishedVersion, cc-by)
  • PubMed Central (publishedVersion, cc-by)
  • PubMed (publishedVersion)
  • DOAJ (DOAJ: Directory of Open Access Journals) (submittedVersion, cc-by-sa)
Funders
Singapore Immunology Network (NA)
Topics
  • Life Sciences › Biochemistry, Genetics and Molecular Biology › Molecular Biology › Single-cell and spatial transcriptomics
  • Life Sciences › Biochemistry, Genetics and Molecular Biology › Molecular Biology › Gene expression and cancer classification
  • Life Sciences › Biochemistry, Genetics and Molecular Biology › Molecular Biology › Bioinformatics and Genomic Networks
Keywords
batch effect correction, single-cell RNA sequencing, benchmarking, data integration, harmony, LIGER, Seurat, LiSi, adjusted Rand index, differential gene expression, computational time
MeSH terms
Big Data, RNA-Seq, Algorithms, Animals, Humans, Benchmarking, Mice, Single-Cell Analysis

About these checks

Registry, retraction, Cites and statistics results are computed, not judged, with one exception: a printed reference that no index lists is read once by a model before it counts as a citation error. Claims are extracted by a model and kept only when their quote appears verbatim in the text; each cited source is then checked, with a model’s help, for whether it says what the claim relies on. Those verdicts can be wrong — read the claim’s quote and the cited source before relying on one.

Statistics and arithmetic are recomputed, not judged.

Confidence bands are shown only for fields calibrated on our annotated test set. None is calibrated yet, so no band is shown.

What counts as a claim ›How we measure confidence ›How we check this ›

Are you an author, or do you see a problem with this page? Request a review

How to cite

Cite CoChat for the checks on this page, and the paper for its own findings.

This page
CoChat. (2026). Citation check: A benchmark of batch-effect correction methods for single-cell RNA sequencing data. https://app.cochat.ai/papers/10.1186/s13059-019-1850-9
The paper
Tran, H. T. N., Ang, K. S., Chevrier, M., Zhang, X., Lee, N. Y. S., Goh, M., & Chen, J. (2020). A benchmark of batch-effect correction methods for single-cell RNA sequencing data. Genome Biology. https://doi.org/10.1186/s13059-019-1850-9

Data sources

Bibliographic data: Semantic Scholar, OpenAlex, Crossref.

Contains information from the Semantic Scholar Academic Graph Datasets, made available under the ODC Attribution License (ODC-BY 1.0).

Semantic Scholar’s data is described in: Kinney, R., et al. (2023). The Semantic Scholar Open Data Platform. arXiv:2301.10140.