

The DOI matches its Crossref record; 54 of the 54 references it cites were found in a registry or an index; 1 of the 9 sources its claims cite were checked for support.
Systematic assessment of tissue dissociation and storage biases in single-cell and single-nucleus RNA-seq workflows
Open accessPublished version of a preprint
Abstract
Background: Single-cell RNA sequencing has been widely adopted to estimate the cellular composition of heterogeneous tissues and obtain transcriptional profiles of individual cells. Multiple approaches for optimal sample dissociation and storage of single cells have been proposed as have single-nuclei profiling methods. What has been lacking is a systematic comparison of their relative biases and benefits. Results: Here, we compare gene expression and cellular composition of single-cell suspensions prepared from adult mouse kidney using two tissue dissociation protocols. For each sample, we also compare fresh cells to cryopreserved and methanol-fixed cells. Lastly, we compare this single-cell data to that generated using three single-nucleus RNA sequencing workflows. Our data confirms prior reports that digestion on ice avoids the stress response observed with 37 °C dissociation. It also reveals cell types more abundant either in the cold or warm dissociations that may represent populations that require gentler or harsher conditions to be released intact. For cell storage, cryopreservation of dissociated cells results in a major loss of epithelial cell types; in contrast, methanol fixation maintains the cellular composition but suffers from ambient RNA leakage. Finally, cell type composition differences are observed between single-cell and single-nucleus RNA sequencing libraries. In particular, we note an underrepresentation of T, B, and NK lymphocytes in the single-nucleus libraries. Conclusions: Systematic comparison of recovered cell types and their transcriptional profiles across the workflows has highlighted protocol-specific biases and thus enables researchers starting single-cell experiments to make an informed choice.
Overview
AI snapshot
Written from the paper’s full text.
TL;DR
This study systematically compares tissue dissociation, cell preservation, and single-cell versus single-nucleus RNA-seq workflows in adult mouse kidney, using 77,656 single-cell, 98,303 single-nucleus, and 15 bulk RNA-seq profiles. It finds protocol-specific biases: warm dissociation induces stress genes and depletes sensitive cell types, cryopreservation loses epithelial cells, methanol fixation preserves composition but causes ambient RNA leakage, and snRNA-seq underrepresents T, B, and NK lymphocytes.
Key findings
- Warm dissociation induced a stress response: bulk RNA-seq found 71 genes higher in warm-dissociated kidneys versus 5 in cold-dissociated kidneys (logFC > 2, FDR < 0.05), and scRNA-seq found 64 genes higher in warm-dissociated libraries in at least one cell type versus 20 in cold-dissociated libraries. Stress scores were significantly high in 8 of 14 cell types in warm-dissociated samples.
- Cell composition differed by dissociation protocol: podocytes were 0.03% in warm-dissociated samples versus 2.78% in cold-dissociated samples; aLOH cells were 4.99% versus 2.52%, and PT cells were 71.36% versus 63.34% in warm versus cold, respectively.
- Cryopreservation severely depleted epithelial cells: PT cells were 63.12% and 70.86% in fresh cold- and warm-dissociated samples but only 0.31% and 0.57% in cryopreserved samples; a repeat experiment showed PT at 55.55% fresh versus 7.65% cryopreserved. Only ~30% of cryopreserved cells were recovered, while methanol fixation better preserved composition but showed ambient RNA leakage.
- Single-nucleus libraries underdetected immune cells: immune cells averaged 0.73% in snRNA-seq versus 6.03% in scRNA-seq; T, B, and NK cells were not detected in snRNA-seq, and podocytes were 0.7% in snRNA-seq versus 3.28% in scRNA-seq. snRNA-seq detected more genes per nucleus (median 1819) than scRNA-seq per cell (median 981).
Methods
- Adult mouse kidneys were used: male C57BL/6J mice (19 weeks) for the first dissociation/preservation series, and male Balb/c (18 weeks) or female Balb/c (15 weeks) mice for later scRNA-seq versus snRNA-seq comparisons, with biological triplicates.
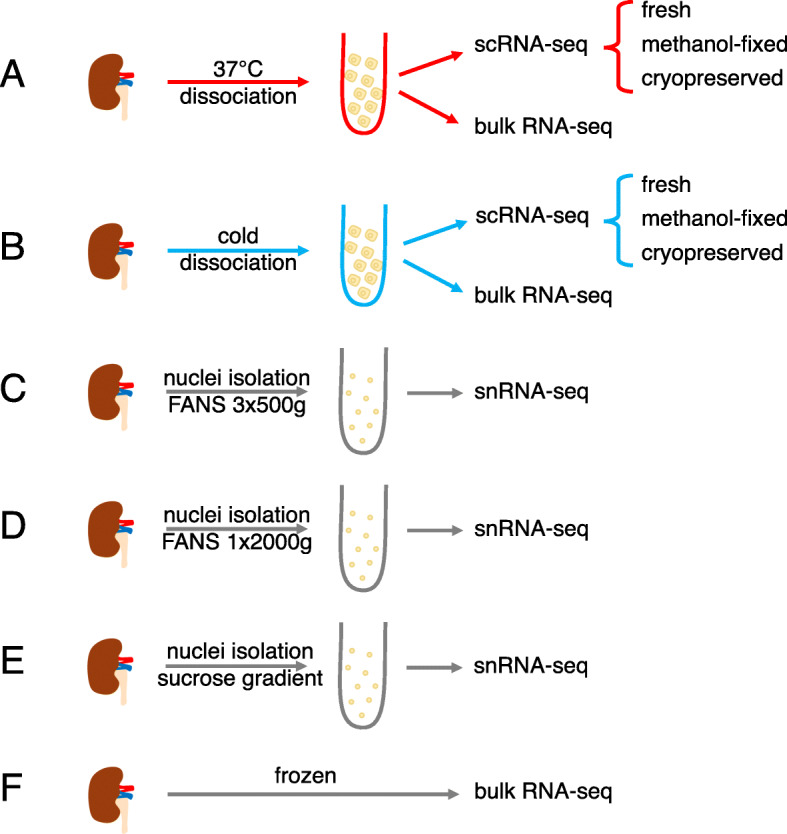
- Workflows compared two dissociation protocols (37 °C Miltenyi Multi Tissue Dissociation Kit 2 versus cold-active *Bacillus licheniformis* protease on ice), two preservation methods (methanol fixation and cryopreservation), and three single-nuclei isolation protocols (SN_FANS_3x500g, SN_FANS_1x2000g, SN_sucrose), plus bulk RNA-seq of intact and dissociated kidney.
- Libraries were profiled with 10x Genomics Chromium scRNA-seq/snRNA-seq and bulk RNA-seq; analyses included Cell Ranger, EmptyDrops, Seurat, scMatch annotation, edgeR/GeTMM, BSEQ-sc deconvolution, a 17-gene stress score, and Seurat cell-cycle scoring. Data are available at GSE141115.
Limitations
- Stated in the paper: bulk RNA-seq deconvolution is sensitive to the input marker gene list, may overlook rare and novel cell types, and cell abundance estimates from bulk data are influenced by both cell number and relative mRNA content; the authors note they lack a definitive “ground truth” for cell composition and did not use in vitro cell mixtures or spiking because these do not represent dissociation from solid tissue.
- Stated in the paper: flow cytometry still requires dissociation, and ISH/IHC/spatial methods only give proportions for sections examined rather than whole-organ estimates; a classifier able to distinguish mitotic cells from early G1 and late G2 is needed to fully dissect cell-cycle biases in snRNA-seq.
- Evident from the text: findings are restricted to adult mouse kidney, specific mouse strains/sexes, selected 10x chemistries, and particular dissociation, preservation, and nuclei-isolation protocols, so generalization to other tissues, species, or protocols is not established; some analyses excluded low-abundance cell types such as podocytes and transitional cells, and red blood cell depletion was not applied.
Model-written summary. Check it against the paper before relying on it.
Integrity signals
Registry
Cites
Statistics
Figures
Verification
Claims the paper makes
35 Own result · 20 Own interpretation · 6 Not checked yet · 4 Own method · 4 No basis given · 1 Supported
Every source the paper cites for this claim was checked and supports it.
In the paper
“Differential expression analysis identified 71 genes with higher expression in warm-dissociated kidneys and 5 genes with higher expression in cold-dissociated kidneys (logFC > 2, FDR < 0.05, edgeR exact test [27], Additional file 1).”
§ Systematic assessment of tissue dissociation and storage biases in single-cell and single-nucleus RNA-seq workflows > Results > Comparison of tissue dissociation protocols
What the sources say
- Supportedcites [27] Robinson MD, McCarthy DJ, Smyth GK. edgeR: a Bioconductor package for differential expression analysis of digital gene expression data. Bioinformatics. 2010;26:139–40. source
The citation is attached to “edgeR exact test,” not to the kidney gene counts. The Features section states that edgeR supports pairwise testing for differential expression and specifically describes its pairwise exact testing procedure. (LLM, conf=0.92)
plaincorrelational- Asserted: passes — The authors put it forward as true.
- Checkable: passes — It can be checked against evidence.
- Load-bearing: passes — The paper’s conclusions depend on it.
- Based: passes — The paper gives a reason why it holds.
- Supported
A result the paper reports from its own data — it cites no other source for it, so there is none to check. The quote shows it is in the paper.
In the paper
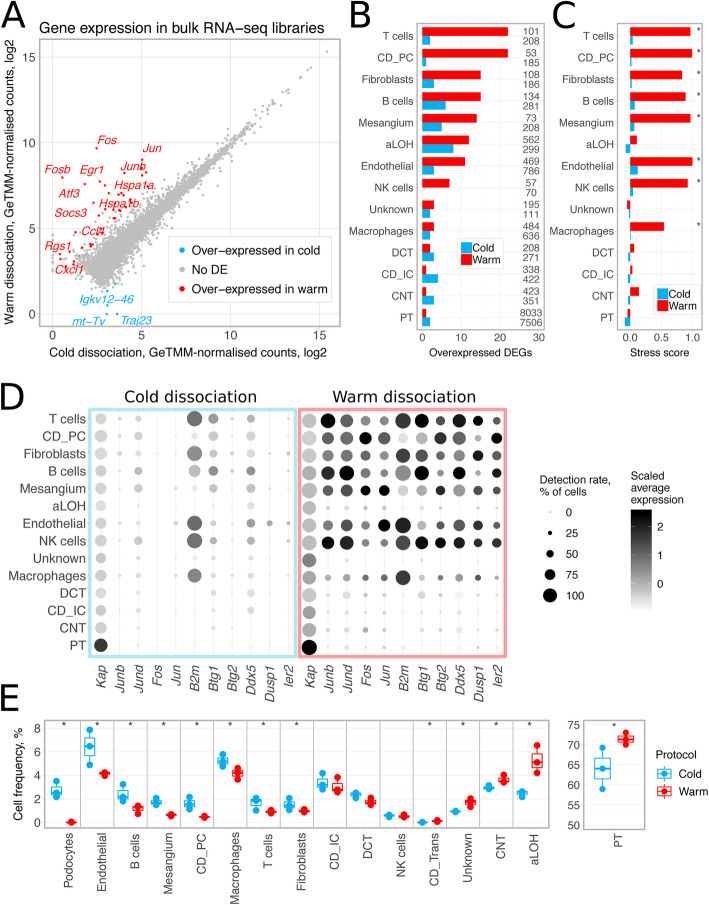
“Differential expression analysis identified 64 genes more highly expressed in warm-dissociated libraries in at least one cell type (Fig. 2b, Additional file 4)”
§ Systematic assessment of tissue dissociation and storage biases in single-cell and single-nucleus RNA-seq workflows > Results > Comparison of tissue dissociation protocols
plaincorrelational- Asserted: passes — The authors put it forward as true.
- Checkable: passes — It can be checked against evidence.
- Load-bearing: passes — The paper’s conclusions depend on it.
- Based: passes — The paper gives a reason why it holds.
A result the paper reports from its own data — it cites no other source for it, so there is none to check. The quote shows it is in the paper.
In the paper
“we identified cells such as those of the ascending loop of Henle (aLOH) and proximal tubule (PT), that were more abundant in warm-dissociated samples (aLOH 4.99% vs. 2.52% in cold, PT 71.36% vs. 63.34% in cold)”
§ Systematic assessment of tissue dissociation and storage biases in single-cell and single-nucleus RNA-seq workflows > Results > Comparison of tissue dissociation protocols
plaincorrelational- Asserted: passes — The authors put it forward as true.
- Checkable: passes — It can be checked against evidence.
- Load-bearing: passes — The paper’s conclusions depend on it.
- Based: passes — The paper gives a reason why it holds.
A result the paper reports from its own data — it cites no other source for it, so there is none to check. The quote shows it is in the paper.
In the paper
“Cell types more abundant in snRNA-seq libraries included loop of Henle and mesangial cells”
§ Systematic assessment of tissue dissociation and storage biases in single-cell and single-nucleus RNA-seq workflows > Results > Comparison of single-cell and single-nucleus sequencing protocols
plaincorrelational- Asserted: passes — The authors put it forward as true.
- Checkable: passes — It can be checked against evidence.
- Load-bearing: passes — The paper’s conclusions depend on it.
- Based: passes — The paper gives a reason why it holds.
In the paper
“Our data confirms prior reports that digestion on ice avoids the stress response observed with 37 °C dissociation.”
- Also stated in: § Comparison of tissue dissociation protocols · plain
“Bulk RNA-seq profiling of single-cell suspensions revealed induction of stress response genes in warm-dissociated samples.”
- Also stated in: § Discussion · plain
“Our findings corroborate this bias and show induction of heat shock proteins and immediate-early response genes in warm-dissociated libraries when compared to cold-dissociated libraries.”
§ Systematic assessment of tissue dissociation and storage biases in single-cell and single-nucleus RNA-seq workflows > Abstract > Results
What the sources say
- Not checked yetcites Adam et al. [18] Adam M, Potter AS, Potter SS. Psychrophilic proteases dramatically reduce single-cell RNA-seq artifacts: a molecular atlas of kidney development. Development. 2017;144:3625–32. source
plaindirect- Asserted: passes — The authors put it forward as true.
- Checkable: passes — It can be checked against evidence.
- Load-bearing: passes — The paper’s conclusions depend on it.
- Based: passes — The paper gives a reason why it holds.
- Also stated in: § Comparison of tissue dissociation protocols · plain
A result the paper reports from its own data — it cites no other source for it, so there is none to check. The quote shows it is in the paper.
In the paper
“Despite loading similar numbers of cells, the number of high-quality cells obtained from the cryopreserved samples after quality control and filtering (“Methods”) was substantially lower (~ 30%) than that of the fresh and methanol-fixed samples.”
§ Systematic assessment of tissue dissociation and storage biases in single-cell and single-nucleus RNA-seq workflows > Results > Comparison of cell preservation protocols
plaincorrelational- Asserted: passes — The authors put it forward as true.
- Checkable: passes — It can be checked against evidence.
- Load-bearing: passes — The paper’s conclusions depend on it.
- Based: passes — The paper gives a reason why it holds.
A result the paper reports from its own data — it cites no other source for it, so there is none to check. The quote shows it is in the paper.
In the paper
“In contrast, genes overexpressed in methanol-fixed cells were those highly expressed in tubular cells and hemoglobin genes”
§ Systematic assessment of tissue dissociation and storage biases in single-cell and single-nucleus RNA-seq workflows > Results > Comparison of cell preservation protocols
plaincorrelational- Asserted: passes — The authors put it forward as true.
- Checkable: passes — It can be checked against evidence.
- Load-bearing: passes — The paper’s conclusions depend on it.
- Based: passes — The paper gives a reason why it holds.
A result the paper reports from its own data — it cites no other source for it, so there is none to check. The quote shows it is in the paper.
In the paper
“Notably, the numbers of differentially expressed genes varied among cell types (Fig. 2b)”
§ Systematic assessment of tissue dissociation and storage biases in single-cell and single-nucleus RNA-seq workflows > Results > Comparison of tissue dissociation protocols
plaincorrelational- Asserted: passes — The authors put it forward as true.
- Checkable: passes — It can be checked against evidence.
- Load-bearing: passes — The paper’s conclusions depend on it.
- Based: passes — The paper gives a reason why it holds.
A result the paper reports from its own data — it cites no other source for it, so there is none to check. The quote shows it is in the paper.
In the paper
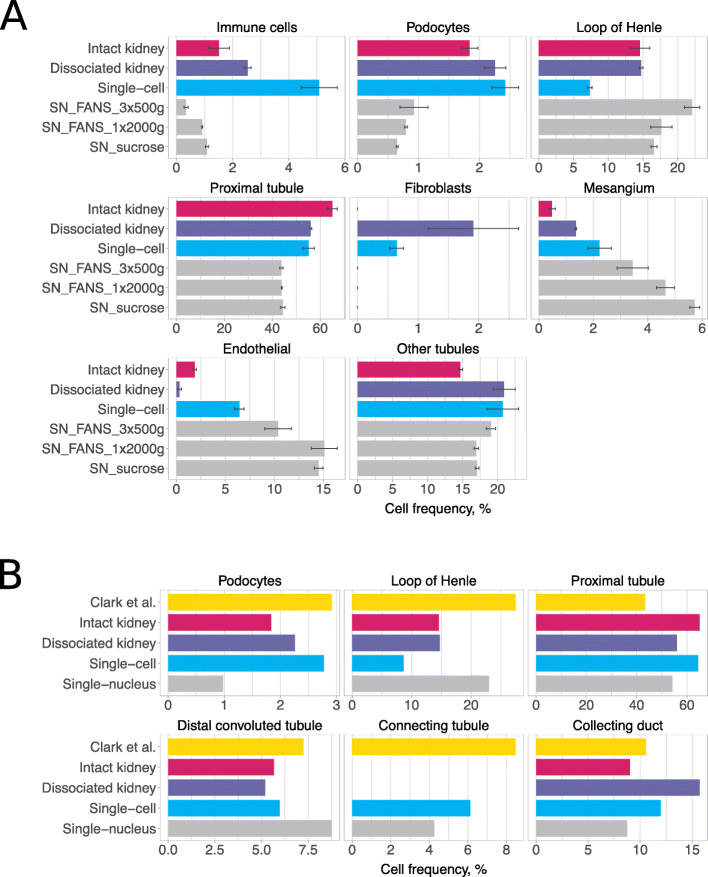
“Immune cells were detected at lower rates in snRNA-seq (average of 0.73%) than in scRNA-seq (average of 6.03%) across all experiments performed”
§ Systematic assessment of tissue dissociation and storage biases in single-cell and single-nucleus RNA-seq workflows > Results > Comparison of single-cell and single-nucleus sequencing protocols
plaincorrelational- Asserted: passes — The authors put it forward as true.
- Checkable: passes — It can be checked against evidence.
- Load-bearing: passes — The paper’s conclusions depend on it.
- Based: passes — The paper gives a reason why it holds.
A result the paper reports from its own data — it cites no other source for it, so there is none to check. The quote shows it is in the paper.
In the paper
“our analyses identified eight cell populations that were less abundant in warm-dissociated samples in comparison to cold-dissociated ones, including podocytes, mesangial cells, and endothelial cells (Fig. 2e left, chi-square test p value < 0.001).”
§ Systematic assessment of tissue dissociation and storage biases in single-cell and single-nucleus RNA-seq workflows > Results > Comparison of tissue dissociation protocols
plaincorrelational- Asserted: passes — The authors put it forward as true.
- Checkable: passes — It can be checked against evidence.
- Load-bearing: passes — The paper’s conclusions depend on it.
- Based: passes — The paper gives a reason why it holds.
A result the paper reports from its own data — it cites no other source for it, so there is none to check. The quote shows it is in the paper.
In the paper
“Notably, only three podocytes were detected in warm-dissociated samples (0.03% of the total cell count), compared to 330 (2.78%) in the cold-dissociated samples.”
§ Systematic assessment of tissue dissociation and storage biases in single-cell and single-nucleus RNA-seq workflows > Results > Comparison of tissue dissociation protocols
plaincorrelational- Asserted: passes — The authors put it forward as true.
- Checkable: passes — It can be checked against evidence.
- Load-bearing: passes — The paper’s conclusions depend on it.
- Based: passes — The paper gives a reason why it holds.
A result the paper reports from its own data — it cites no other source for it, so there is none to check. The quote shows it is in the paper.
In the paper
“These depleted populations also showed significantly high expression of the stress-response-related gene set as described above (Fig. 2c).”
§ Systematic assessment of tissue dissociation and storage biases in single-cell and single-nucleus RNA-seq workflows > Results > Comparison of tissue dissociation protocols
plaincorrelational- Asserted: passes — The authors put it forward as true.
- Checkable: passes — It can be checked against evidence.
- Load-bearing: passes — The paper’s conclusions depend on it.
- Based: passes — The paper gives a reason why it holds.
A result the paper reports from its own data — it cites no other source for it, so there is none to check. The quote shows it is in the paper.
In the paper
“Again, there was a significant depletion of PT cells, with them making up 55.55% of the freshly profiled cells but only 7.65% of the cryopreserved cells”
§ Systematic assessment of tissue dissociation and storage biases in single-cell and single-nucleus RNA-seq workflows > Results > Comparison of cell preservation protocols
plaincorrelational- Asserted: passes — The authors put it forward as true.
- Checkable: passes — It can be checked against evidence.
- Load-bearing: passes — The paper’s conclusions depend on it.
- Based: passes — The paper gives a reason why it holds.
A result the paper reports from its own data — it cites no other source for it, so there is none to check. The quote shows it is in the paper.
In the paper
“Figure 2c shows that significantly high stress scores were detected only in warm-dissociated samples in eight out of 14 cell types.”
§ Systematic assessment of tissue dissociation and storage biases in single-cell and single-nucleus RNA-seq workflows > Results > Comparison of tissue dissociation protocols
plaincorrelational- Asserted: passes — The authors put it forward as true.
- Checkable: passes — It can be checked against evidence.
- Load-bearing: passes — The paper’s conclusions depend on it.
- Based: passes — The paper gives a reason why it holds.
A result the paper reports from its own data — it cites no other source for it, so there is none to check. The quote shows it is in the paper.
In the paper
“Similarly, podocytes composed only 0.7% in snRNA-seq libraries as opposed to 3.28% in scRNA-seq”
§ Systematic assessment of tissue dissociation and storage biases in single-cell and single-nucleus RNA-seq workflows > Results > Comparison of single-cell and single-nucleus sequencing protocols
plaincorrelational- Asserted: passes — The authors put it forward as true.
- Checkable: passes — It can be checked against evidence.
- Load-bearing: passes — The paper’s conclusions depend on it.
- Based: passes — The paper gives a reason why it holds.
A result the paper reports from its own data — it cites no other source for it, so there is none to check. The quote shows it is in the paper.
In the paper
“gene ontology analysis again reported “regulation of cell death” as one of the top significantly enriched terms (an overlap of 23 genes, FDR = 3.9E−7, Additional file 4).”
§ Systematic assessment of tissue dissociation and storage biases in single-cell and single-nucleus RNA-seq workflows > Results > Comparison of tissue dissociation protocols
plaincorrelational- Asserted: passes — The authors put it forward as true.
- Checkable: passes — It can be checked against evidence.
- Load-bearing: unclear — It is unclear whether the paper’s conclusions depend on it.
- Based: passes — The paper gives a reason why it holds.
A result the paper reports from its own data — it cites no other source for it, so there is none to check. The quote shows it is in the paper.
In the paper
“Genes with the highest logFC values (> 4) included immediate-early genes Fosb, Fos, Jun, Junb, Atf3, and Egr1 and heat shock proteins Hspa1a and Hspa1b (Fig. 2a).”
§ Systematic assessment of tissue dissociation and storage biases in single-cell and single-nucleus RNA-seq workflows > Results > Comparison of tissue dissociation protocols
plaincorrelational- Asserted: passes — The authors put it forward as true.
- Checkable: passes — It can be checked against evidence.
- Load-bearing: passes — The paper’s conclusions depend on it.
- Based: passes — The paper gives a reason why it holds.
The paper states this without a source or data behind it here, so there is nothing to check it against. The quote shows it is in the paper.
In the paper
“Bulk RNA-seq-based proportions estimated from intact kidneys largely contradicted the anatomical estimates”
§ Systematic assessment of tissue dissociation and storage biases in single-cell and single-nucleus RNA-seq workflows > Results > Comparison of single-cell and single-nucleus sequencing protocols
plain- Asserted: passes — The authors put it forward as true.
- Checkable: passes — It can be checked against evidence.
- Load-bearing: passes — The paper’s conclusions depend on it.
- Based: passes — The paper gives a reason why it holds.
A result the paper reports from its own data — it cites no other source for it, so there is none to check. The quote shows it is in the paper.
In the paper
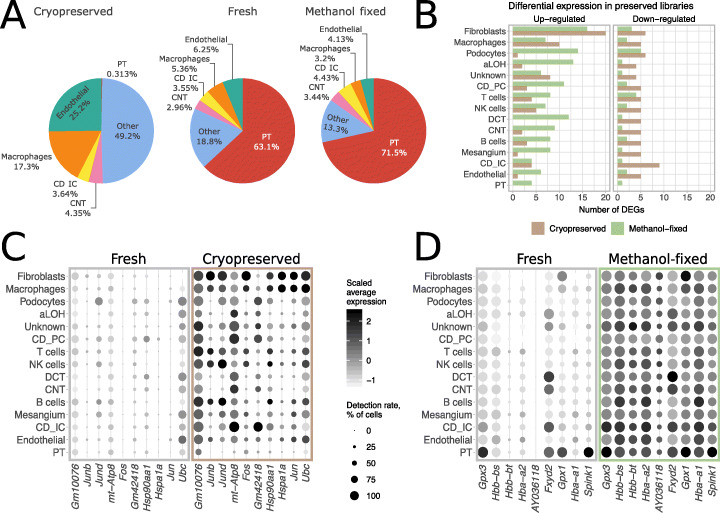
“In cryopreserved samples, stress-response-related genes were induced, including multiple immediate-early response genes and heat shock proteins”
§ Systematic assessment of tissue dissociation and storage biases in single-cell and single-nucleus RNA-seq workflows > Results > Comparison of cell preservation protocols
plaindirect- Asserted: passes — The authors put it forward as true.
- Checkable: passes — It can be checked against evidence.
- Load-bearing: passes — The paper’s conclusions depend on it.
- Based: passes — The paper gives a reason why it holds.
In the paper
“Gene ontology analysis with ToppGene [28] reported “regulation of cell death” as the top significantly enriched biological process for the genes more highly expressed in warm-dissociated kidneys (an overlap of 22 genes, FDR = 1.7E−7, see Additional file 1).”
§ Systematic assessment of tissue dissociation and storage biases in single-cell and single-nucleus RNA-seq workflows > Results > Comparison of tissue dissociation protocols
What the sources say
- Not checked yetcites [28] Chen J, Bardes EE, Aronow BJ, Jegga AG. ToppGene Suite for gene list enrichment analysis and candidate gene prioritization. Nucleic Acids Res. 2009;37:W305–11. source
plaincorrelational- Asserted: passes — The authors put it forward as true.
- Checkable: passes — It can be checked against evidence.
- Load-bearing: passes — The paper’s conclusions depend on it.
- Based: passes — The paper gives a reason why it holds.
A result the paper reports from its own data — it cites no other source for it, so there is none to check. The quote shows it is in the paper.
In the paper
“Detection rates of non-epithelial kidney cell types were markedly different between scRNA-seq and snRNA-seq libraries”
§ Systematic assessment of tissue dissociation and storage biases in single-cell and single-nucleus RNA-seq workflows > Results > Comparison of single-cell and single-nucleus sequencing protocols
plaincorrelational- Asserted: passes — The authors put it forward as true.
- Checkable: passes — It can be checked against evidence.
- Load-bearing: passes — The paper’s conclusions depend on it.
- Based: passes — The paper gives a reason why it holds.
A result the paper reports from its own data — it cites no other source for it, so there is none to check. The quote shows it is in the paper.
In the paper
“Notably, Seurat predicted a higher fraction of G1 phase cells and lower fraction of S phase cells in scRNA-seq libraries when compared to snRNA-seq libraries for virtually all cell types”
§ Systematic assessment of tissue dissociation and storage biases in single-cell and single-nucleus RNA-seq workflows > Results > Comparison of single-cell and single-nucleus sequencing protocols
plaincorrelational- Asserted: passes — The authors put it forward as true.
- Checkable: passes — It can be checked against evidence.
- Load-bearing: passes — The paper’s conclusions depend on it.
- Based: passes — The paper gives a reason why it holds.
A result the paper reports from its own data — it cites no other source for it, so there is none to check. The quote shows it is in the paper.
In the paper
“Single-nuclei sequencing detected more genes per nuclei than single-cell sequencing per cell, with the median numbers of 1819 and 981 genes, respectively”
§ Systematic assessment of tissue dissociation and storage biases in single-cell and single-nucleus RNA-seq workflows > Results > Comparison of single-cell and single-nucleus sequencing protocols
plaincorrelational- Asserted: passes — The authors put it forward as true.
- Checkable: passes — It can be checked against evidence.
- Load-bearing: unclear — It is unclear whether the paper’s conclusions depend on it.
- Based: passes — The paper gives a reason why it holds.
A result the paper reports from its own data — it cites no other source for it, so there is none to check. The quote shows it is in the paper.
In the paper
“In cold-dissociated samples, 31 and 27 genes were overexpressed in at least one cell type in cryopreserved and methanol-fixed cells, respectively, when compared to freshly profiled suspensions”
§ Systematic assessment of tissue dissociation and storage biases in single-cell and single-nucleus RNA-seq workflows > Results > Comparison of cell preservation protocols
plaincorrelational- Asserted: passes — The authors put it forward as true.
- Checkable: passes — It can be checked against evidence.
- Load-bearing: passes — The paper’s conclusions depend on it.
- Based: passes — The paper gives a reason why it holds.
A result the paper reports from its own data — it cites no other source for it, so there is none to check. The quote shows it is in the paper.
In the paper
“one of the most notable differences between single-cell and single-nuclei experiments was the low detection rate of immune cells, in particular the failure to detect T, B, or NK cells in any of the snRNA-seq libraries.”
§ Systematic assessment of tissue dissociation and storage biases in single-cell and single-nucleus RNA-seq workflows > Discussion
plaincorrelational- Asserted: passes — The authors put it forward as true.
- Checkable: passes — It can be checked against evidence.
- Load-bearing: passes — The paper’s conclusions depend on it.
- Based: passes — The paper gives a reason why it holds.
A result the paper reports from its own data — it cites no other source for it, so there is none to check. The quote shows it is in the paper.
In the paper
“cell composition of methanol-fixed suspensions resembled that of freshly profiled libraries.”
§ Systematic assessment of tissue dissociation and storage biases in single-cell and single-nucleus RNA-seq workflows > Discussion
plain- Asserted: passes — The authors put it forward as true.
- Checkable: passes — It can be checked against evidence.
- Load-bearing: passes — The paper’s conclusions depend on it.
- Based: passes — The paper gives a reason why it holds.
None of the sources cited for this claim have been checked yet.
In the paper
“Candidate CNT cells were identified as a cluster overexpressing Calb1 and Klk1 genes [34, 56].”
§ Systematic assessment of tissue dissociation and storage biases in single-cell and single-nucleus RNA-seq workflows > Methods > Inferring cell identity
What the sources say
- Not checked yetcites [34] Clark JZ, Chen L, Chou CL, Jung HJ, Lee JW, Knepper MA. Representation and relative abundance of cell-type selective markers in whole-kidney RNA-Seq data. Kidney Int. 2019;95:787–96. source
- Not checked yetcites [56] Rohrwasser A, Ishigami T, Gociman B, Lantelme P, Morgan T, Cheng T, et al. Renin and kallikrein in connecting tubule of mouse. Kidney Int. 2003;64:2155–62. source
plaincorrelational- Asserted: passes — The authors put it forward as true.
- Checkable: passes — It can be checked against evidence.
- Load-bearing: unclear — It is unclear whether the paper’s conclusions depend on it.
- Based: passes — The paper gives a reason why it holds.
A result the paper reports from its own data — it cites no other source for it, so there is none to check. The quote shows it is in the paper.
In the paper
“This artifact was reproducible across two mouse strains, both sexes, and two 10x chemistry versions.”
§ Systematic assessment of tissue dissociation and storage biases in single-cell and single-nucleus RNA-seq workflows > Discussion
plain- Asserted: passes — The authors put it forward as true.
- Checkable: passes — It can be checked against evidence.
- Load-bearing: passes — The paper’s conclusions depend on it.
- Based: passes — The paper gives a reason why it holds.
A result the paper reports from its own data — it cites no other source for it, so there is none to check. The quote shows it is in the paper.
In the paper
“cryopreservation of single-cell suspensions of dissociated mouse kidneys resulted in depletion of epithelial cell types.”
§ Systematic assessment of tissue dissociation and storage biases in single-cell and single-nucleus RNA-seq workflows > Discussion
plaindirect- Asserted: passes — The authors put it forward as true.
- Checkable: passes — It can be checked against evidence.
- Load-bearing: passes — The paper’s conclusions depend on it.
- Based: passes — The paper gives a reason why it holds.
The paper states this without a source or data behind it here, so there is nothing to check it against. The quote shows it is in the paper.
In the paper
“Cold-dissociated samples showed higher contamination with hemoglobin transcripts than warm-dissociated ones.”
§ Systematic assessment of tissue dissociation and storage biases in single-cell and single-nucleus RNA-seq workflows > Discussion
plaincorrelational- Asserted: passes — The authors put it forward as true.
- Checkable: passes — It can be checked against evidence.
- Load-bearing: unclear — It is unclear whether the paper’s conclusions depend on it.
- Based: passes — The paper gives a reason why it holds.
The paper states this without a source or data behind it here, so there is nothing to check it against. The quote shows it is in the paper.
In the paper
“In the first series of experiments, marker genes for the deconvolution were calculated from scRNA-seq data, using only cold-dissociated samples to avoid the influence of the identified warm dissociation-related biases.”
§ Systematic assessment of tissue dissociation and storage biases in single-cell and single-nucleus RNA-seq workflows > Methods > Bulk RNA-seq deconvolution
plain- Asserted: passes — The authors put it forward as true.
- Checkable: passes — It can be checked against evidence.
- Load-bearing: passes — The paper’s conclusions depend on it.
- Based: passes — The paper gives a reason why it holds.
A conclusion the paper draws from its own results — it cites no other source for it, so there is none to check. The quote shows it is in the paper.
In the paper
“in the case of dissociated mouse kidneys, methanol fixation better preserved cell type composition than cryopreservation”
§ Systematic assessment of tissue dissociation and storage biases in single-cell and single-nucleus RNA-seq workflows > Results > Comparison of cell preservation protocols
plaindirect- Asserted: passes — The authors put it forward as true.
- Checkable: passes — It can be checked against evidence.
- Load-bearing: passes — The paper’s conclusions depend on it.
- Based: passes — The paper gives a reason why it holds.
A conclusion the paper draws from its own results — it cites no other source for it, so there is none to check. The quote shows it is in the paper.
In the paper
“Together with the loss of PT cells, this indicates that the cryopreservation and subsequent thawing protocol failed to efficiently recover kidney epithelial cell populations.”
§ Systematic assessment of tissue dissociation and storage biases in single-cell and single-nucleus RNA-seq workflows > Results > Comparison of cell preservation protocols
hedgeddirect- Asserted: passes — The authors put it forward as true.
- Checkable: passes — It can be checked against evidence.
- Load-bearing: passes — The paper’s conclusions depend on it.
- Based: passes — The paper gives a reason why it holds.
A conclusion the paper draws from its own results — it cites no other source for it, so there is none to check. The quote shows it is in the paper.
In the paper
“This suggests an underrepresentation of immune cells in the snRNA-seq data.”
§ Systematic assessment of tissue dissociation and storage biases in single-cell and single-nucleus RNA-seq workflows > Results > Comparison of single-cell and single-nucleus sequencing protocols
hedged- Asserted: passes — The authors put it forward as true.
- Checkable: passes — It can be checked against evidence.
- Load-bearing: passes — The paper’s conclusions depend on it.
- Based: passes — The paper gives a reason why it holds.
- Rests on an assumption: BSEQ-sc deconvolution of bulk RNA-seq accurately estimates cell type proportions in intact kidney.
A conclusion the paper draws from its own results — it cites no other source for it, so there is none to check. The quote shows it is in the paper.
In the paper
“From this, we conclude that, at least in the case of mouse kidneys, cryopreservation of dissociated cells using 50% FBS, 40% RPMI, and 10% DMSO can induce substantial deleterious changes in cell composition.”
§ Systematic assessment of tissue dissociation and storage biases in single-cell and single-nucleus RNA-seq workflows > Results > Comparison of cell preservation protocols
plainconditional- Asserted: passes — The authors put it forward as true.
- Checkable: passes — It can be checked against evidence.
- Load-bearing: passes — The paper’s conclusions depend on it.
- Based: passes — The paper gives a reason why it holds.
A conclusion the paper draws from its own results — it cites no other source for it, so there is none to check. The quote shows it is in the paper.
In the paper
“Taken together, these results highlight that certain cell types, such as immune and endothelial cells, are particularly sensitive to warm tissue dissociation.”
§ Systematic assessment of tissue dissociation and storage biases in single-cell and single-nucleus RNA-seq workflows > Results > Comparison of tissue dissociation protocols
plaincorrelational- Asserted: passes — The authors put it forward as true.
- Checkable: passes — It can be checked against evidence.
- Load-bearing: passes — The paper’s conclusions depend on it.
- Based: passes — The paper gives a reason why it holds.
A conclusion the paper draws from its own results — it cites no other source for it, so there is none to check. The quote shows it is in the paper.
In the paper
“suggesting that cell types respond differently to warm tissue dissociation.”
§ Systematic assessment of tissue dissociation and storage biases in single-cell and single-nucleus RNA-seq workflows > Results > Comparison of tissue dissociation protocols
hedgedcorrelational- Asserted: passes — The authors put it forward as true.
- Checkable: passes — It can be checked against evidence.
- Load-bearing: passes — The paper’s conclusions depend on it.
- Based: passes — The paper gives a reason why it holds.
A conclusion the paper draws from its own results — it cites no other source for it, so there is none to check. The quote shows it is in the paper.
In the paper
“We note the levels of hemoglobin transcripts suggest contamination from erythrocytes is higher in the samples dissociated on ice.”
§ Systematic assessment of tissue dissociation and storage biases in single-cell and single-nucleus RNA-seq workflows > Results > Comparison of tissue dissociation protocols
hedgedcorrelational- Asserted: passes — The authors put it forward as true.
- Checkable: passes — It can be checked against evidence.
- Load-bearing: unclear — It is unclear whether the paper’s conclusions depend on it.
- Based: passes — The paper gives a reason why it holds.
A conclusion the paper draws from its own results — it cites no other source for it, so there is none to check. The quote shows it is in the paper.
In the paper
“potentially indicating their less efficient dissociation by cold-active protease”
§ Systematic assessment of tissue dissociation and storage biases in single-cell and single-nucleus RNA-seq workflows > Results > Comparison of tissue dissociation protocols
hedgedconditional- Asserted: passes — The authors put it forward as true.
- Checkable: passes — It can be checked against evidence.
- Load-bearing: unclear — It is unclear whether the paper’s conclusions depend on it.
- Based: passes — The paper gives a reason why it holds.
A conclusion the paper draws from its own results — it cites no other source for it, so there is none to check. The quote shows it is in the paper.
In the paper
“This suggests that there are indeed underlying biases in cell cycle phase distributions in snRNA-seq data in comparison to scRNA-seq data”
§ Systematic assessment of tissue dissociation and storage biases in single-cell and single-nucleus RNA-seq workflows > Results > Comparison of single-cell and single-nucleus sequencing protocols
hedgedcorrelational- Asserted: passes — The authors put it forward as true.
- Checkable: passes — It can be checked against evidence.
- Load-bearing: passes — The paper’s conclusions depend on it.
- Based: passes — The paper gives a reason why it holds.
A conclusion the paper draws from its own results — it cites no other source for it, so there is none to check. The quote shows it is in the paper.
In the paper
“Overexpression of stress-response-related genes was also detected by bulk RNA-seq analysis of dissociated tissues, confirming that this artifact stems from the dissociation protocol rather than from microfluidic separation, single-cell sequencing, or data processing.”
§ Systematic assessment of tissue dissociation and storage biases in single-cell and single-nucleus RNA-seq workflows > Discussion
boosteddirect- Asserted: passes — The authors put it forward as true.
- Checkable: passes — It can be checked against evidence.
- Load-bearing: passes — The paper’s conclusions depend on it.
- Based: passes — The paper gives a reason why it holds.
A conclusion the paper draws from its own results — it cites no other source for it, so there is none to check. The quote shows it is in the paper.
In the paper
“It is important to remember that cell type composition of single-cell or single-nucleus data differs from that of the original tissue”
§ Systematic assessment of tissue dissociation and storage biases in single-cell and single-nucleus RNA-seq workflows > Discussion
plain- Asserted: passes — The authors put it forward as true.
- Checkable: passes — It can be checked against evidence.
- Load-bearing: passes — The paper’s conclusions depend on it.
- Based: passes — The paper gives a reason why it holds.
In the paper
“we observed ambient RNA contamination with highly abundant transcripts suggesting cell damage by methanol fixation [22].”
§ Systematic assessment of tissue dissociation and storage biases in single-cell and single-nucleus RNA-seq workflows > Discussion
What the sources say
- Not checked yetcites [22] Wohnhaas CT, Leparc GG, Fernandez-Albert F, Kind D, Gantner F, Viollet C, et al. DMSO cryopreservation is the method of choice to preserve cells for droplet-based single-cell RNA sequencing. Sci Rep. 2019;9:10699. source
hedgeddirect- Asserted: passes — The authors put it forward as true.
- Checkable: passes — It can be checked against evidence.
- Load-bearing: passes — The paper’s conclusions depend on it.
- Based: passes — The paper gives a reason why it holds.
A conclusion the paper draws from its own results — it cites no other source for it, so there is none to check. The quote shows it is in the paper.
In the paper
“we observed reduced contamination of other cells with highly expressed PT transcripts, which indicates that PT cells might be lost in the thawing and resuspension.”
§ Systematic assessment of tissue dissociation and storage biases in single-cell and single-nucleus RNA-seq workflows > Discussion
hedgedconditional- Asserted: passes — The authors put it forward as true.
- Checkable: passes — It can be checked against evidence.
- Load-bearing: passes — The paper’s conclusions depend on it.
- Based: passes — The paper gives a reason why it holds.
- It may state two separate claims as one. 19
- Probably not a substantial claim. 8
- The quote only partly states this claim. 1
In the paper
“we estimated that approximately 1.51% should correspond to immune cells in Balb/c female mice and 4.84% in Balb/c male mice.”
§ Systematic assessment of tissue dissociation and storage biases in single-cell and single-nucleus RNA-seq workflows > Results > Comparison of single-cell and single-nucleus sequencing protocols
What the sources say
- Not checked yetcites [35] Baron M, Veres A, Wolock SL, Faust AL, Gaujoux R, Vetere A, et al. A single-cell transcriptomic map of the human and mouse pancreas reveals inter- and intra-cell population structure. Cell Syst. 2016;3:346–60.e4. source
hedged- Asserted: passes — The authors put it forward as true.
- Checkable: passes — It can be checked against evidence.
- Load-bearing: passes — The paper’s conclusions depend on it.
- Based: passes — The paper gives a reason why it holds.
It may state two separate claims as one.
- Rests on an assumption: BSEQ-sc deconvolution of bulk RNA-seq accurately estimates cell type proportions in intact kidney.
A result the paper reports from its own data — it cites no other source for it, so there is none to check. The quote shows it is in the paper.
In the paper
“Furthermore, macrophages were the only type of immune cells recovered in snRNA-seq libraries, whereas in scRNA-seq libraries we also detected T cells (1.38% on average), B cells (0.77%), and NK cells (0.65%).”
§ Systematic assessment of tissue dissociation and storage biases in single-cell and single-nucleus RNA-seq workflows > Results > Comparison of single-cell and single-nucleus sequencing protocols
plain- Asserted: passes — The authors put it forward as true.
- Checkable: passes — It can be checked against evidence.
- Load-bearing: passes — The paper’s conclusions depend on it.
- Based: passes — The paper gives a reason why it holds.
It may state two separate claims as one.
A result the paper reports from its own data — it cites no other source for it, so there is none to check. The quote shows it is in the paper.
In the paper
“In freshly profiled suspensions, PT composed 63.12% and 70.86% of all cells in cold- and warm-dissociated samples, respectively. In contrast, PT were scarcely detected in cryopreserved samples, at 0.31% and 0.57%, respectively”
§ Systematic assessment of tissue dissociation and storage biases in single-cell and single-nucleus RNA-seq workflows > Results > Comparison of cell preservation protocols
plain- Asserted: passes — The authors put it forward as true.
- Checkable: passes — It can be checked against evidence.
- Load-bearing: passes — The paper’s conclusions depend on it.
- Based: passes — The paper gives a reason why it holds.
It may state two separate claims as one.
A result the paper reports from its own data — it cites no other source for it, so there is none to check. The quote shows it is in the paper.
In the paper
“Notably, only ~ 33% and ~ 32% of cells were recovered after cryostorage in the first and the repeated experiment, respectively; the average viability estimated by the Countess was 86% and 75%, respectively.”
§ Systematic assessment of tissue dissociation and storage biases in single-cell and single-nucleus RNA-seq workflows > Results > Comparison of cell preservation protocols
hedged- Asserted: passes — The authors put it forward as true.
- Checkable: passes — It can be checked against evidence.
- Load-bearing: passes — The paper’s conclusions depend on it.
- Based: passes — The paper gives a reason why it holds.
It may state two separate claims as one.
A result the paper reports from its own data — it cites no other source for it, so there is none to check. The quote shows it is in the paper.
In the paper
“In contrast to the 64 genes with higher expression in the warm dissociation, only 20 genes had higher expression in the cold-dissociated cell populations, and only five of them (Hbb-bs, Hba-a1, Hba-a2, mt-Co1, Malat1) were identified in at least two cell types (Fig. 2b, Additional file 5).”
§ Systematic assessment of tissue dissociation and storage biases in single-cell and single-nucleus RNA-seq workflows > Results > Comparison of tissue dissociation protocols
plain- Asserted: passes — The authors put it forward as true.
- Checkable: passes — It can be checked against evidence.
- Load-bearing: unclear — It is unclear whether the paper’s conclusions depend on it.
- Based: passes — The paper gives a reason why it holds.
It may state two separate claims as one.
A result the paper reports from its own data — it cites no other source for it, so there is none to check. The quote shows it is in the paper.
In the paper
“Nevertheless, certain cell types were moderately underrepresented in the methanol-fixed samples in comparison to freshly profiled samples, with macrophages showing the largest reduction from 5.36 to 3.2% in cold-dissociated samples and from 4.28 to 2.54% in warm-dissociated samples.”
§ Systematic assessment of tissue dissociation and storage biases in single-cell and single-nucleus RNA-seq workflows > Results > Comparison of cell preservation protocols
plaindirect- Asserted: passes — The authors put it forward as true.
- Checkable: passes — It can be checked against evidence.
- Load-bearing: passes — The paper’s conclusions depend on it.
- Based: passes — The paper gives a reason why it holds.
It may state two separate claims as one.
A result the paper reports from its own data — it cites no other source for it, so there is none to check. The quote shows it is in the paper.
In the paper
“This comparison revealed significant underrepresentation (chi-square test p value < 0.001) of five kidney cell types in cryopreserved samples prepared with the cold dissociation protocol, three of which were also underrepresented in the cryopreserved warm dissociation samples”
§ Systematic assessment of tissue dissociation and storage biases in single-cell and single-nucleus RNA-seq workflows > Results > Comparison of cell preservation protocols
plaincorrelational- Asserted: passes — The authors put it forward as true.
- Checkable: passes — It can be checked against evidence.
- Load-bearing: passes — The paper’s conclusions depend on it.
- Based: passes — The paper gives a reason why it holds.
It may state two separate claims as one.
A result the paper reports from its own data — it cites no other source for it, so there is none to check. The quote shows it is in the paper.
In the paper
“The three nuclei isolation protocols yielded comparable results, with the most notable difference being a higher contamination with mitochondrial genes in SN_FANS_1x2000g”
§ Systematic assessment of tissue dissociation and storage biases in single-cell and single-nucleus RNA-seq workflows > Results > Comparison of single-cell and single-nucleus sequencing protocols
plain- Asserted: passes — The authors put it forward as true.
- Checkable: passes — It can be checked against evidence.
- Load-bearing: unclear — It is unclear whether the paper’s conclusions depend on it.
- Based: passes — The paper gives a reason why it holds.
It may state two separate claims as one.
None of the sources cited for this claim have been checked yet.
In the paper
“Differential expression analysis comparing individual cell types profiled by snRNA-seq and scRNA-seq suggested higher expression of long noncoding RNAs in snRNA-seq libraries and higher expression of genes related to mitochondrial and ribosomal functions in scRNA-seq, in agreement with previous reports [24, 26]”
§ Systematic assessment of tissue dissociation and storage biases in single-cell and single-nucleus RNA-seq workflows > Results > Comparison of single-cell and single-nucleus sequencing protocols
What the sources say
- Not checked yetcites [24] Bakken TE, Hodge RD, Miller JA, Yao Z, Nguyen TN, Aevermann B, et al. Single-nucleus and single-cell transcriptomes compared in matched cortical cell types. PLoS One. 2018;13:e0209648. source
- Not checked yetcites [26] Wu H, Kirita Y, Donnelly EL, Humphreys BD. Advantages of single-nucleus over single-cell RNA sequencing of adult kidney: rare cell types and novel cell states revealed in fibrosis. J Am Soc Nephrol. 2019;30:23–32. source
hedgedcorrelational- Asserted: passes — The authors put it forward as true.
- Checkable: passes — It can be checked against evidence.
- Load-bearing: passes — The paper’s conclusions depend on it.
- Based: passes — The paper gives a reason why it holds.
It may state two separate claims as one.
A result the paper reports from its own data — it cites no other source for it, so there is none to check. The quote shows it is in the paper.
In the paper
“This dataset comprised 23,108 cells, including 11,851 cells from cold- and 11,257 cells from warm-dissociated kidneys (“Methods”).”
§ Systematic assessment of tissue dissociation and storage biases in single-cell and single-nucleus RNA-seq workflows > Results > Comparison of tissue dissociation protocols
plain- Asserted: passes — The authors put it forward as true.
- Checkable: passes — It can be checked against evidence.
- Load-bearing: fails — The paper’s conclusions may not depend on it.
- Based: passes — The paper gives a reason why it holds.
Probably not a substantial claim. The paper’s conclusions may not depend on it. It may state two separate claims as one.
A result the paper reports from its own data — it cites no other source for it, so there is none to check. The quote shows it is in the paper.
In the paper
“The genes most commonly overexpressed across cell populations are shown in Fig. 2d and include immediate-early response genes such as Junb and Jund (differentially expressed in seven cell types) and Jun and Fos (differentially expressed in five cell types).”
§ Systematic assessment of tissue dissociation and storage biases in single-cell and single-nucleus RNA-seq workflows > Results > Comparison of tissue dissociation protocols
plaincorrelational- Asserted: passes — The authors put it forward as true.
- Checkable: passes — It can be checked against evidence.
- Load-bearing: unclear — It is unclear whether the paper’s conclusions depend on it.
- Based: passes — The paper gives a reason why it holds.
It may state two separate claims as one.
The paper states this without a source or data behind it here, so there is nothing to check it against. The quote shows it is in the paper.
In the paper
“Due to the reverse transcription inhibition of 3x SSC, the sample had to be loaded at a concentration of 0.125x SSC, resulting in an approximate cell capture of 4000–5000 cells.”
§ Systematic assessment of tissue dissociation and storage biases in single-cell and single-nucleus RNA-seq workflows > Methods > Single-cell RNA-seq library preparation
plaindirect- Asserted: passes — The authors put it forward as true.
- Checkable: passes — It can be checked against evidence.
- Load-bearing: fails — The paper’s conclusions may not depend on it.
- Based: passes — The paper gives a reason why it holds.
Probably not a substantial claim. The paper’s conclusions may not depend on it.
- Rests on an assumption: 3x SSC inhibits reverse transcription.
A result the paper reports from its own data — it cites no other source for it, so there is none to check. The quote shows it is in the paper.
In the paper
“This approach failed to identify cells of connecting tubule (CNT) and, instead, matched them to other similar cell types.”
§ Systematic assessment of tissue dissociation and storage biases in single-cell and single-nucleus RNA-seq workflows > Methods > Inferring cell identity
plaindirect- Asserted: passes — The authors put it forward as true.
- Checkable: passes — It can be checked against evidence.
- Load-bearing: unclear — It is unclear whether the paper’s conclusions depend on it.
- Based: passes — The paper gives a reason why it holds.
It may state two separate claims as one.
A result the paper reports from its own data — it cites no other source for it, so there is none to check. The quote shows it is in the paper.
In the paper
“To select genes for the stress response score, we looked at all genes induced in the warm-dissociated samples, and from that list, we manually selected genes which have been reported in the literature as stress-response-related genes.”
§ Systematic assessment of tissue dissociation and storage biases in single-cell and single-nucleus RNA-seq workflows > Methods > Stress response score
plaindirect- Asserted: passes — The authors put it forward as true.
- Checkable: passes — It can be checked against evidence.
- Load-bearing: passes — The paper’s conclusions depend on it.
- Based: passes — The paper gives a reason why it holds.
The quote only partly states this claim.
A conclusion the paper draws from its own results — it cites no other source for it, so there is none to check. The quote shows it is in the paper.
In the paper
“These findings suggest that these populations are sensitive to warm dissociation and consequently underrepresented.”
§ Systematic assessment of tissue dissociation and storage biases in single-cell and single-nucleus RNA-seq workflows > Results > Comparison of tissue dissociation protocols
hedgeddirect- Asserted: passes — The authors put it forward as true.
- Checkable: passes — It can be checked against evidence.
- Load-bearing: passes — The paper’s conclusions depend on it.
- Based: passes — The paper gives a reason why it holds.
It may state two separate claims as one.
A conclusion the paper draws from its own results — it cites no other source for it, so there is none to check. The quote shows it is in the paper.
In the paper
“The same set of transcripts contaminated most cell types suggesting methanol fixation damages cells and leads to ambient RNA contamination of droplets”
§ Systematic assessment of tissue dissociation and storage biases in single-cell and single-nucleus RNA-seq workflows > Results > Comparison of cell preservation protocols
hedgeddirect- Asserted: passes — The authors put it forward as true.
- Checkable: passes — It can be checked against evidence.
- Load-bearing: passes — The paper’s conclusions depend on it.
- Based: passes — The paper gives a reason why it holds.
It may state two separate claims as one.
A conclusion the paper draws from its own results — it cites no other source for it, so there is none to check. The quote shows it is in the paper.
In the paper
“Figure 4b and Additional file 2: Figure S8 show that for some cell types, such as podocytes, scRNA-seq yields proportions most similar to the quantitative renal anatomy estimates, whereas for other cell types, such as loop of Henle cells, snRNA-seq better captures cell composition.”
§ Systematic assessment of tissue dissociation and storage biases in single-cell and single-nucleus RNA-seq workflows > Results > Comparison of single-cell and single-nucleus sequencing protocols
plaincorrelational- Asserted: passes — The authors put it forward as true.
- Checkable: passes — It can be checked against evidence.
- Load-bearing: passes — The paper’s conclusions depend on it.
- Based: passes — The paper gives a reason why it holds.
It may state two separate claims as one.
A conclusion the paper draws from its own results — it cites no other source for it, so there is none to check. The quote shows it is in the paper.
In the paper
“Our results suggest that proportions of aLOH cells in cell suspensions were higher before they were loaded on the Chromium Controller and that they are somehow underrepresented.”
§ Systematic assessment of tissue dissociation and storage biases in single-cell and single-nucleus RNA-seq workflows > Results > Comparison of tissue dissociation protocols
hedgeddirect- Asserted: passes — The authors put it forward as true.
- Checkable: passes — It can be checked against evidence.
- Load-bearing: passes — The paper’s conclusions depend on it.
- Based: passes — The paper gives a reason why it holds.
It may state two separate claims as one.
A conclusion the paper draws from its own results — it cites no other source for it, so there is none to check. The quote shows it is in the paper.
In the paper
“Based on these estimates, some cell types, such as podocytes, appear to be better represented in scRNA-seq, whereas others, such as loop of Henle cells, were captured more effectively by snRNA-seq.”
§ Systematic assessment of tissue dissociation and storage biases in single-cell and single-nucleus RNA-seq workflows > Discussion
hedgedcorrelational- Asserted: passes — The authors put it forward as true.
- Checkable: passes — It can be checked against evidence.
- Load-bearing: passes — The paper’s conclusions depend on it.
- Based: passes — The paper gives a reason why it holds.
It may state two separate claims as one.
What the paper did — it cites no source for this, so there is none to check. The quote shows it is in the paper.
In the paper
“Complete tissue dissociation was also checked by examining under the microscope and confirming the absence of visible tissue chunks.”
§ Systematic assessment of tissue dissociation and storage biases in single-cell and single-nucleus RNA-seq workflows > Methods > Cold tissue dissociation
plain- Asserted: passes — The authors put it forward as true.
- Checkable: passes — It can be checked against evidence.
- Load-bearing: fails — The paper’s conclusions may not depend on it.
- Based: passes — The paper gives a reason why it holds.
Probably not a substantial claim. The paper’s conclusions may not depend on it.
What the paper did — it cites no source for this, so there is none to check. The quote shows it is in the paper.
In the paper
“All single-cell libraries were constructed in biological triplicate using the 10x Chromium 3′ workflow as per the manufacturers’ directions.”
§ Systematic assessment of tissue dissociation and storage biases in single-cell and single-nucleus RNA-seq workflows > Methods > Single-cell RNA-seq library preparation
plain- Asserted: passes — The authors put it forward as true.
- Checkable: passes — It can be checked against evidence.
- Load-bearing: fails — The paper’s conclusions may not depend on it.
- Based: passes — The paper gives a reason why it holds.
Probably not a substantial claim. The paper’s conclusions may not depend on it.
What the paper did — it cites no source for this, so there is none to check. The quote shows it is in the paper.
In the paper
“All libraries were quantified with qPCR using the NEBnext Library Quant Kit for Illumina and checked for fragment size using the TapeStation D1000 kit (Agilent).”
§ Systematic assessment of tissue dissociation and storage biases in single-cell and single-nucleus RNA-seq workflows > Methods > Sequencing
plain- Asserted: passes — The authors put it forward as true.
- Checkable: passes — It can be checked against evidence.
- Load-bearing: fails — The paper’s conclusions may not depend on it.
- Based: passes — The paper gives a reason why it holds.
Probably not a substantial claim. The paper’s conclusions may not depend on it. It may state two separate claims as one.
A conclusion the paper draws from its own results — it cites no other source for it, so there is none to check. The quote shows it is in the paper.
In the paper
“the observation likely stems from a higher rate of hemoglobin transcript degradation in warm tissue dissociation conditions.”
§ Systematic assessment of tissue dissociation and storage biases in single-cell and single-nucleus RNA-seq workflows > Discussion
hedgedconditional- Asserted: passes — The authors put it forward as true.
- Checkable: passes — It can be checked against evidence.
- Load-bearing: fails — The paper’s conclusions may not depend on it.
- Based: fails — The paper may give no reason why it holds.
Probably not a substantial claim. The paper’s conclusions may not depend on it. The paper may give no reason why it holds.
A conclusion the paper draws from its own results — it cites no other source for it, so there is none to check. The quote shows it is in the paper.
In the paper
“In addition, cell abundance estimates from bulk data would be influenced by both cell number and relative mRNA content of each cell.”
§ Systematic assessment of tissue dissociation and storage biases in single-cell and single-nucleus RNA-seq workflows > Discussion
hedgeddirect- Asserted: passes — The authors put it forward as true.
- Checkable: passes — It can be checked against evidence.
- Load-bearing: fails — The paper’s conclusions may not depend on it.
- Based: fails — The paper may give no reason why it holds.
Probably not a substantial claim. The paper’s conclusions may not depend on it. The paper may give no reason why it holds.
A conclusion the paper draws from its own results — it cites no other source for it, so there is none to check. The quote shows it is in the paper.
In the paper
“However, the approach is sensitive to the input marker gene list used and may overlook rare and novel cell types.”
§ Systematic assessment of tissue dissociation and storage biases in single-cell and single-nucleus RNA-seq workflows > Discussion
hedgedconditional- Asserted: passes — The authors put it forward as true.
- Checkable: passes — It can be checked against evidence.
- Load-bearing: unclear — It is unclear whether the paper’s conclusions depend on it.
- Based: passes — The paper gives a reason why it holds.
It may state two separate claims as one.
What the paper did — it cites no source for this, so there is none to check. The quote shows it is in the paper.
In the paper
“RNA was assessed for quantity and quality using the TapeStation 4200 RNA ScreenTape kit [Agilent; 5067-5576], which showed all RNA used had a RIN of > 8.”
§ Systematic assessment of tissue dissociation and storage biases in single-cell and single-nucleus RNA-seq workflows > Methods > Bulk RNA-seq library preparation
plain- Asserted: passes — The authors put it forward as true.
- Checkable: passes — It can be checked against evidence.
- Load-bearing: fails — The paper’s conclusions may not depend on it.
- Based: passes — The paper gives a reason why it holds.
Probably not a substantial claim. The paper’s conclusions may not depend on it.
The paper relies on this without support.
The biases observed in adult mouse kidney workflows generalize to other tissues and to human disease biology.
“From our experiments, we have confirmed several observations by others in the field that have direct relevance to designing single-cell experiments studying human disease biology.”
“Specifically, the depletion of epithelial cell types in cryopreserved samples is concerning given the majority of human cancers are epithelial in origin.”
The paper relies on this without support.
BSEQ-sc deconvolution of bulk RNA-seq accurately estimates cell type proportions in intact kidney.
“Using the bulk RNA-seq from intact kidneys (Fig. 1f) and BSEQ-sc [35] to predict the proportions of each cell type present, we estimated that approximately 1.51% should correspond to immune cells in Balb/c female mice and 4.84% in Balb/c male mice.”
The paper relies on this without support.
The reference expression profiles from previous mouse kidney studies accurately represent the cell types in the studied samples.
“Cells were classified into 15 cell types using scMatch [31] by comparing their expression to reference expression profiles from three previous mouse kidney studies [26, 32, 33], followed by gene signature-based refinement”
The paper relies on this without support.
3x SSC inhibits reverse transcription.
“Due to the reverse transcription inhibition of 3x SSC, the sample had to be loaded at a concentration of 0.125x SSC”
Claims other papers make about this one
Each is checked against this paper’s own text: does it say what the citing paper says it does?
The cited source says what the claim attributes to it.
In the citing paper
“Our inhibitor-based protocol offers much greater experimental and tissue-/cell-type flexibility than previously developed experimental and computational solutions for this pervasive issue (see additional discussion of some alternative methods in Supplementary Note 7)33,34,45,65,67,68.”
From Dissection of artifactual and confounding glial signatures by single-cell sequencing of mouse and human brain (2022) · cites this paper as [45]
The cited source says what the claim attributes to it.
In the citing paper
“However, emerging results from other tissues/cell types have begun to characterize dissociation artifacts following enzymatic digestion43–45,65,66.”
From Dissection of artifactual and confounding glial signatures by single-cell sequencing of mouse and human brain (2022) · cites this paper as [45]
Self-check
Percentages, sums and reported differences re-computed from the paper’s own numbers.
Each contradiction between two passages listed here was confirmed by an independent check.
Rated major: it would touch a result — a value a result rests on, reported and recomputed p-values on opposite sides of the significance level, two passages that conflict with no sign which is right, or a cited work retracted before this paper was published.
In the paper
§ Systematic assessment of tissue dissociation and storage biases in single-cell and single-nucleus RNA-seq workflows > Results > Comparison of single-cell and single-nucleus sequencing protocols
“In the third protocol, nuclei were initially washed using a 500g spin and then cleaned using a sucrose cushion”
§ Systematic assessment of tissue dissociation and storage biases in single-cell and single-nucleus RNA-seq workflows > Methods > Single-nuclei isolation
“The homogenate was then filtered through a 30-μm MACS Smart Strainer into a new 15-mL centrifuge tube. Subsequently, the homogenate was centrifuged at 2000g for 5 min at 4 °C.”
Rated minor: it would not touch a result — a value no result rests on, a p-value that stays on the same side of the significance level, or a conflict that is clerical, resolved elsewhere in the paper, or outside its own findings.
In the paper
§ Systematic assessment of tissue dissociation and storage biases in single-cell and single-nucleus RNA-seq workflows > Methods > Cryopreservation
“The following day, the cells were transferred to liquid nitrogen storage.”
§ Systematic assessment of tissue dissociation and storage biases in single-cell and single-nucleus RNA-seq workflows > Methods > Cryopreservation
“The samples were removed from − 80 °C and immediately placed into a 37 °C waterbath for 2–3 min to rapidly thaw.”
Rated minor: it would not touch a result — a value no result rests on, a p-value that stays on the same side of the significance level, or a conflict that is clerical, resolved elsewhere in the paper, or outside its own findings.
In the paper
§ Systematic assessment of tissue dissociation and storage biases in single-cell and single-nucleus RNA-seq workflows > Results > Comparison of tissue dissociation protocols
“PT 71.36% vs. 63.34% in cold”
§ Systematic assessment of tissue dissociation and storage biases in single-cell and single-nucleus RNA-seq workflows > Results > Comparison of cell preservation protocols
“In freshly profiled suspensions, PT composed 63.12% and 70.86% of all cells in cold- and warm-dissociated samples, respectively.”
Citations
Cites
Controlling the False Discovery Rate: A Practical and Powerful Approach to Multiple Testing
Benjamini, Y., & Hochberg, Y. (1995) · Journal of the Royal Statistical Society Series B: Statistical Methodology · doi:10.1111/j.2517-6161.1995.tb02031.x · Cited by 109,482
STAR: ultrafast universal RNA-seq aligner
Dobin, A., Davis, C. A., Schlesinger, F., Drenkow, J., Zaleski, C., Jha, S., Batut, P., Chaisson, M., & Gingeras, T. R. (2013) · Bioinformatics · doi:10.1093/bioinformatics/bts635 · Cited by 51,709
Robinson, M. D., McCarthy, D. J., & Smyth, G. K. (2010) · Bioinformatics · doi:10.1093/bioinformatics/btp616 · Cited by 41,364
featureCounts: an efficient general purpose program for assigning sequence reads to genomic features
Liao, Y., Smyth, G. K., & Shi, W. (2014) · Bioinformatics · doi:10.1093/bioinformatics/btt656 · Cited by 27,219
Integrating single-cell transcriptomic data across different conditions, technologies, and species
Butler, A., Hoffman, P., Smibert, P., Papalexi, E., & Satija, R. (2018) · Nature Biotechnology · doi:10.1038/nbt.4096 · Cited by 13,174
Fast, sensitive and accurate integration of single-cell data with Harmony
Korsunsky, I., Millard, N., Fan, J., Slowikowski, K., Zhang, F., Wei, K., Baglaenko, Y., Brenner, M., Loh, P.-R., & Raychaudhuri, S. (2019) · Nature Methods · doi:10.1038/s41592-019-0619-0 · Cited by 10,488
Massively parallel digital transcriptional profiling of single cells
Zheng, G. X. Y., Terry, J. M., Belgrader, P., Ryvkin, P., Bent, Z. W., Wilson, R., Ziraldo, S. B., Wheeler, T. D., McDermott, G. P., Zhu, J., et al. (2017) · Nature Communications · doi:10.1038/ncomms14049 · Cited by 7,353
Highly parallel genome-wide expression profiling of individual cells using nanoliter droplets.
Macosko, E. Z., Basu, A., Satija, R., Nemesh, J., Shekhar, K., Goldman, M., Tirosh, I., Bialas, A. R., Kamitaki, N., Martersteck, E. M., et al. (2015) · Cell · doi:10.1016/j.cell.2015.05.002 · Cited by 7,110
Dissecting the multicellular ecosystem of metastatic melanoma by single-cell RNA-seq
Tirosh, I., Izar, B., Prakadan, S. M., Wadsworth, M. H., Treacy, D., Trombetta, J. J., Rotem, A., Rodman, C., Lian, C., Murphy, G., et al. (2016) · Science · doi:10.1126/science.aad0501 · Cited by 4,944
The single-cell transcriptional landscape of mammalian organogenesis
Cao, J., Spielmann, M., Qiu, X., Huang, X., Ibrahim, D. M., Hill, A. J., Zhang, F., Mundlos, S., Christiansen, L., Steemers, F. J., et al. (2019) · Nature · doi:10.1038/s41586-019-0969-x · Cited by 4,490
Research works printed but not linked: 2
- Mus musculus ribosomal DNA, complete repeating unit. https://www.ncbi.nlm.nih.gov/nuccore/BK000964. Accessed 24 Jan 2019.
- Denisenko E, Guo B, Jones M, Hou R, de Kock L, Lassmann T, et al. Systematic assessment of tissue dissociation and storage biases in single-cell and single-nucleus RNA-seq workflows. Datasets. Gene Expression Omnibus. 2020. https://www.ncbi.nlm.nih.gov/geo/query/acc.cgi?acc=GSE141115. Accessed 11 May 2020.
Cited by
Sorted by citations
Diversity and biology of cancer-associated fibroblasts
Biffi, G., & Tuveson, D. A. (2021) · Physiological Reviews · doi:10.1152/physrev.00048.2019 · Cited by 1,265
Confronting false discoveries in single-cell differential expression
Squair, J. W., Gautier, M., Kathe, C., Anderson, M. A., James, N. D., Hutson, T. H., Hudelle, R., Qaiser, T., Matson, K. J. E., Barraud, Q., et al. (2021) · doi:10.1101/2021.03.12.435024 · Cited by 1,086
An integrated cell atlas of the lung in health and disease
Sikkema, L., Ramírez-Suástegui, C., Strobl, D. C., Gillett, T. E., Zappia, L., Madissoon, E., Markov, N. S., Zaragosi, L., Ji, Y., Ansari, M., et al. (2023) · Nature Medicine · doi:10.1038/s41591-023-02327-2 · Cited by 930
Chu, T., Wang, Z., Pe’er, D., & Danko, C. G. (2022) · Nature Cancer · doi:10.1038/s43018-022-00356-3 · Cited by 626
Progressive immune dysfunction with advancing disease stage in renal cell carcinoma
Braun, D. A., Street, K., Burke, K. P., Cookmeyer, D. L., Denize, T., Pedersen, C. B., Gohil, S. H., Schindler, N. R., Pomerance, L., Hirsch, L., et al. (2021) · Cancer Cell · doi:10.1016/j.ccell.2021.02.013 · Cited by 524
Metadata
- Authors
- Denisenko, E., Guo, B. B., Jones, M., Hou, R., de Kock, L., Lassmann, T., Poppe, D., Clément, O., Simmons, R. K., Lister, R., & Forrest, A. R. R.
- Affiliations
- The University of Western Australia (AU)
- The Kids Research Institute Australia (AU)
- Corresponding author
- Forrest, Alistair R. R.
- ORCID
- Venue
- Genome Biology
- Published
- 2020-06-02
- Volume
- 21
- Issue
- 1
- Pages
- 130-130
- ISSN
- 1465-6906 (ISSN-L)
- 1474-760X
- PMC
- PMC7265231
- OpenAlex
- W3030739213
- Semantic Scholar
- c1ec88ccea70a4d53e919faf8a30b50e74271c2b
- Cited by
- 686
- References
- 54
- Citations by year
- 2026: 138 · 2025: 96 · 2024: 118 · 2023: 118 · 2022: 100 · 2021: 83 · 2020: 33
- FWCI
- 27.50
- Type
- journal article
- Language
- en
- Open access
- gold
- doi.org
- Locations
- Genome biology (publishedVersion, cc-by)
- bioRxiv (Cold Spring Harbor Laboratory) (acceptedVersion, cc-by-nd)
- PubMed Central (publishedVersion, cc-by)
- PubMed (publishedVersion)
- UWA Profiles and Research Repository (UWA) (submittedVersion, cc-by)
- Adelaide Research & Scholarship (AR&S) (University of Adelaide) (submittedVersion, cc-by)
- DOAJ (DOAJ: Directory of Open Access Journals) (submittedVersion, cc-by-sa)
- Funders
- National Health and Medical Research Council (APP1154524)
- Topics
- Life Sciences › Biochemistry, Genetics and Molecular Biology › Molecular Biology › Single-cell and spatial transcriptomics
- Life Sciences › Biochemistry, Genetics and Molecular Biology › Molecular Biology › Genomics and Phylogenetic Studies
- Life Sciences › Biochemistry, Genetics and Molecular Biology › Molecular Biology › Molecular Biology Techniques and Applications
- Keywords
- tissue dissociation, single-cell RNA sequencing, single-nucleus RNA sequencing, cryopreservation, methanol fixation, kidney, cell type composition
- MeSH terms
- Animals, Cell Separation, Kidney, Male, Mice, Inbred C57BL, Stress, Physiological, Cryopreservation, Sequence Analysis, RNA, Single-Cell Analysis
About these checks
Registry, retraction, Cites and statistics results are computed, not judged, with one exception: a printed reference that no index lists is read once by a model before it counts as a citation error. Claims are extracted by a model and kept only when their quote appears verbatim in the text; each cited source is then checked, with a model’s help, for whether it says what the claim relies on. Those verdicts can be wrong — read the claim’s quote and the cited source before relying on one.
A language model drew the claims from the paper on 2026-10-10, under version 3 of the claim definition (model deepseek-v4.1-flash, prompt extract-v3).
A second model labelled each claim on 2026-10-10 (model jev-1.13-20260917, definition revision gold-guideline-v0.2).
Cited sources are checked with a language model’s help (gpt-6-sol).
Statistics and arithmetic are recomputed, not judged.
Confidence bands are shown only for fields calibrated on our annotated test set. None is calibrated yet, so no band is shown.
What counts as a claim ›How we measure confidence ›How we check this ›
Are you an author, or do you see a problem with this page? Request a review
