

The DOI matches its Crossref record; 58 of the 58 references it cites were found in a registry or an index.
Single-nucleus and single-cell transcriptomes compared in matched cortical cell types
Open accessPublished version of a preprint
Abstract
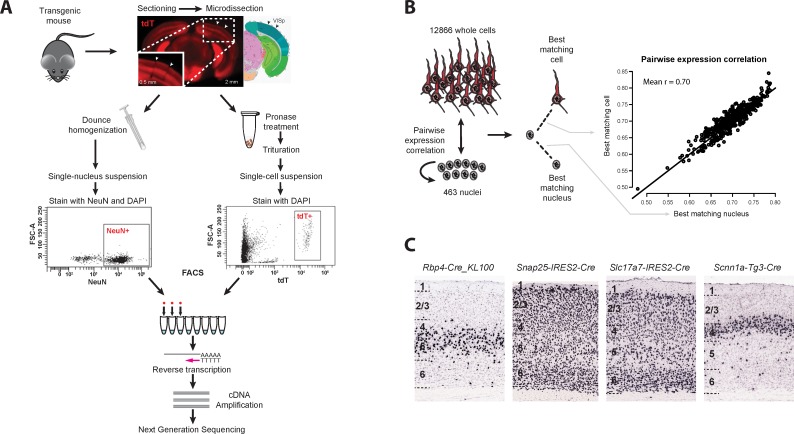
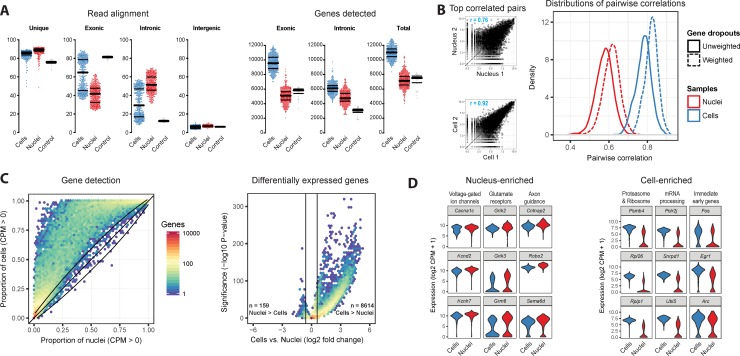
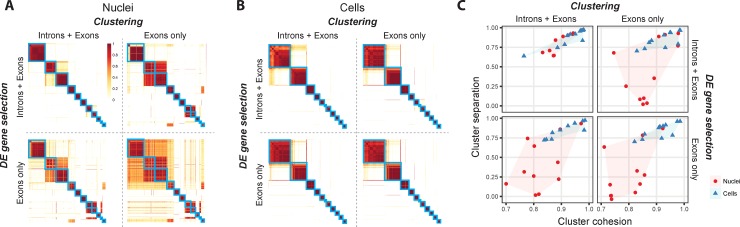
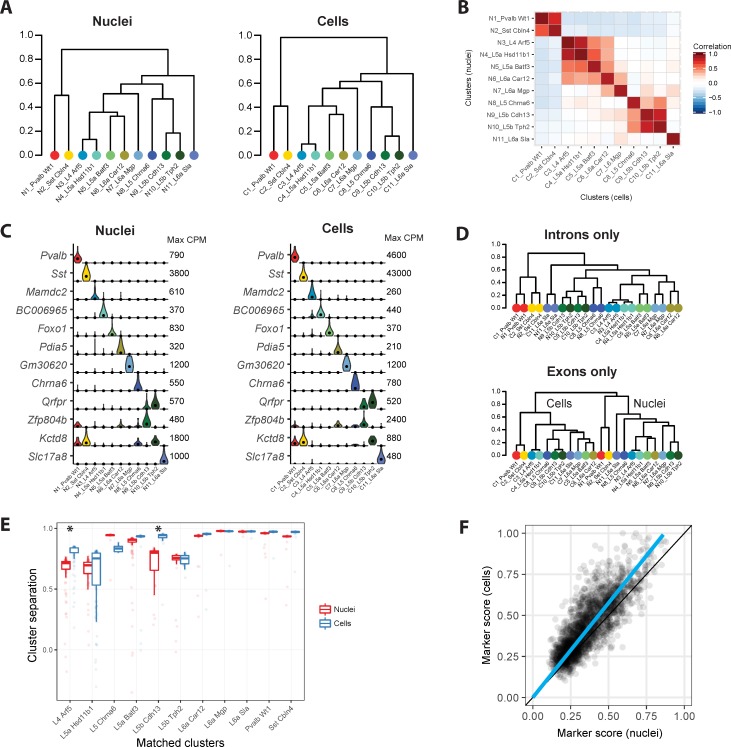
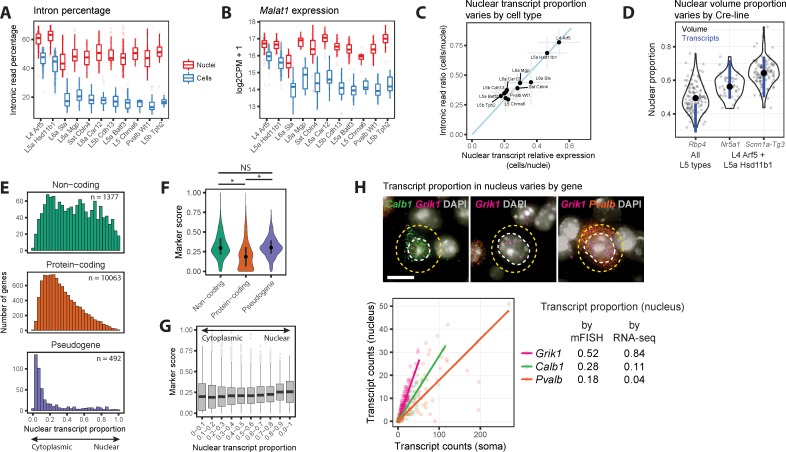
Transcriptomic profiling of complex tissues by single-nucleus RNA-sequencing (snRNA-seq) affords some advantages over single-cell RNA-sequencing (scRNA-seq). snRNA-seq provides less biased cellular coverage, does not appear to suffer cell isolation-based transcriptional artifacts, and can be applied to archived frozen specimens. We used well-matched snRNA-seq and scRNA-seq datasets from mouse visual cortex to compare cell type detection. Although more transcripts are detected in individual whole cells (~11,000 genes) than nuclei (~7,000 genes), we demonstrate that closely related neuronal cell types can be similarly discriminated with both methods if intronic sequences are included in snRNA-seq analysis. We estimate that the nuclear proportion of total cellular mRNA varies from 20% to over 50% for large and small pyramidal neurons, respectively. Together, these results illustrate the high information content of nuclear RNA for characterization of cellular diversity in brain tissues.
Overview
The claims and statistics of this paper haven’t been checked yet.
Free: it reads the open-access text and checks the first 5 claims that cite a source we can check. Create a free account to check every claim.
Integrity signals
Registry
Cites
Statistics
Figures
Verification
Claims the paper makes
The claims and statistics of this paper haven’t been checked yet.
Free: it reads the open-access text and checks the first 5 claims that cite a source we can check. Create a free account to check every claim.
Claims other papers make about this one
Each is checked against this paper’s own text: does it say what the citing paper says it does?
The source backs part of the claim, not all of it — or backs it for a different population, condition or comparison.
In the citing paper
“While scRNA-seq data are analyzed by mapping sequenced fragments to exons, snRNA-seq data analysis should also consider the abundance of intronic reads from pre-mRNA, which may account for >75% of fragments (Bakken et al., 2018; Gaidatzis et al., 2015).”
From Single-Cell Sequencing of Brain Cell Transcriptomes and Epigenomes (2021) · cites this paper as Bakken et al., 2018
Experimental — accuracy not yet measuredThe source backs part of the claim, not all of it — or backs it for a different population, condition or comparison.
In the citing paper
“Nuclear transcripts comprise ~20%−50% of all the RNA in the cell (Bakken et al., 2018), including immature and unspliced RNA molecules containing introns (Fig. 2a).”
From Single-Cell Sequencing of Brain Cell Transcriptomes and Epigenomes (2021) · cites this paper as Bakken et al., 2018
Experimental — accuracy not yet measuredThe source backs part of the claim, not all of it — or backs it for a different population, condition or comparison.
In the citing paper
“Fresh tissue samples are deemed appropriate for single-cell sequencing, whereas freeze-thaw samples are generally recommended for snRNA-seq [242, 243].”
From Single-cell sequencing to multi-omics: technologies and applications (2024) · cites this paper as [243]
Experimental — accuracy not yet measuredThe source backs part of the claim, not all of it — or backs it for a different population, condition or comparison.
In the citing paper
“Differential expression analysis comparing individual cell types profiled by snRNA-seq and scRNA-seq suggested higher expression of long noncoding RNAs in snRNA-seq libraries and higher expression of genes related to mitochondrial and ribosomal functions in scRNA-seq, in agreement with previous reports [24, 26]”
From Systematic assessment of tissue dissociation and storage biases in single-cell and single-nucleus RNA-seq workflows (2020) · cites this paper as [24]
Experimental — accuracy not yet measuredThe source backs part of the claim, not all of it — or backs it for a different population, condition or comparison.
In the citing paper
“whereas longer CDSs were enriched (NES = 1.91, padj = 3.6e-05), as already observed in earlier snRNA-seq studies (Bakken et al., 2018).”
From Single-Nucleus RNA-Seq Is Not Suitable for Detection of Microglial Activation Genes in Humans (2020) · cites this paper as Bakken et al., 2018
Experimental — accuracy not yet measured
5 more claims about this paper
Create a free account to see every claim other papers make about this one.
Self-check
Percentages, sums and reported differences re-computed from the paper’s own numbers.
The self-check needs the paper’s full text.
Citations
Cites
STAR: ultrafast universal RNA-seq aligner
Dobin, A., Davis, C. A., Schlesinger, F., Drenkow, J., Zaleski, C., Jha, S., Batut, P., Chaisson, M., & Gingeras, T. R. (2013) · Bioinformatics · doi:10.1093/bioinformatics/bts635 · Cited by 51,709
limma powers differential expression analyses for RNA-sequencing and microarray studies
Ritchie, M. E., Phipson, B., Wu, D., Hu, Y., Law, C. W., Shi, W., & Smyth, G. K. (2015) · Nucleic Acids Research · doi:10.1093/nar/gkv007 · Cited by 40,458
ggplot2: Elegant Graphics for Data Analysis
Wickham, H. (2009) · doi:10.1007/978-0-387-98141-3 · Cited by 14,447
Highly parallel genome-wide expression profiling of individual cells using nanoliter droplets.
Macosko, E. Z., Basu, A., Satija, R., Nemesh, J., Shekhar, K., Goldman, M., Tirosh, I., Bialas, A. R., Kamitaki, N., Martersteck, E. M., et al. (2015) · Cell · doi:10.1016/j.cell.2015.05.002 · Cited by 7,110
A robust and high-throughput Cre reporting and characterization system for the whole mouse brain
Madisen, L., Zwingman, T. A., Sunkin, S. M., Oh, S. W., Zariwala, H. A., Gu, H., Ng, L. L., Palmiter, R. D., Hawrylycz, M. J., Jones, A. R., et al. (2010) · Nature Neuroscience · doi:10.1038/nn.2467 · Cited by 6,907
Self-citationREVIGO summarizes and visualizes long lists of gene ontology terms
Supek, F., Bošnjak, M., Škunca, N., & Šmuc, T. (2011) · PLoS ONE · doi:10.1371/journal.pone.0021800 · Cited by 6,264
Genome-wide atlas of gene expression in the adult mouse brain
Lein, E. S., Hawrylycz, M. J., Ao, N., Ayres, M., Bensinger, A., Bernard, A., Boe, A. F., Boguski, M. S., Brockway, K. S., Byrnes, E. J., et al. (2007) · Nature · doi:10.1038/nature05453 · Cited by 5,572
Self-citationLandscape of transcription in human cells
Djebali, S., Davis, C. A., Merkel, A., Dobin, A., Lassmann, T., Mortazavi, A., Tanzer, A., Lagarde, J., Lin, W., Schlesinger, F., et al. (2012) · Nature · doi:10.1038/nature11233 · Cited by 5,187
Software for Computing and Annotating Genomic Ranges
Lawrence, M., Huber, W., Pagès, H., Aboyoun, P., Carlson, M., Gentleman, R., Morgan, M. T., & Carey, V. J. (2013) · PLoS Computational Biology · doi:10.1371/journal.pcbi.1003118 · Cited by 4,398
Cell types in the mouse cortex and hippocampus revealed by single-cell RNA-seq
Zeisel, A., Muñoz-Manchado, A. B., Codeluppi, S., Lönnerberg, P., La Manno, G., Juréus, A., Marques, S., Munguba, H., He, L., Betsholtz, C., et al. (2015) · Science · doi:10.1126/science.aaa1934 · Cited by 3,124
Research works printed but not linked: 2
- N Habib, 2017, Nat Methods, Nat Methods, 14, 955
- E. Aronesty, 2011, ea-utils: Command-line tools for processing biological sequencing data, Expr Anal
Cited by
Conserved cell types with divergent features in human versus mouse cortex
Hodge, R. D., Bakken, T. E., Miller, J. A., Smith, K. A., Barkan, E. R., Graybuck, L. T., Close, J. L., Long, B., Johansen, N., Penn, O., et al. (2019) · Nature · doi:10.1038/s41586-019-1506-7 · Cited by 1,775
Self-citationRobust decomposition of cell type mixtures in spatial transcriptomics
Cable, D. M., Murray, E., Zou, L. S., Goeva, A., Macosko, E. Z., Chen, F., & Irizarry, R. A. (2022) · Nature Biotechnology · doi:10.1038/s41587-021-00830-w · Cited by 1,487
“These effects have been previously found in comparisons between single-cell and single-nucleus RNAseq on the same biological sample [15], where it has been shown that e.”
Transcriptome-scale spatial gene expression in the human dorsolateral prefrontal cortex
Maynard, K. R., Collado-Torres, L., Weber, L. M., Uytingco, C., Barry, B. K., Williams, S. R., Catallini, J. L., Tran, M. N., Besich, Z., Tippani, M., et al. (2021) · Nature Neuroscience · doi:10.1038/s41593-020-00787-0 · Cited by 1,222
“While nuclear profiles are generally representative of whole cell profiles (Bakken et al., 2018), isolated nuclei lack the cytoplasmic compartment as well as axons and proximal dendrites, which limits our understanding of gene expression in the cytosol and neuropil (Skene et al.”
BackgroundLukassen, S., Chua, R. L., Trefzer, T., Kahn, N. C., Schneider, M. A., Muley, T., Winter, H., Meister, M., Veith, C., Boots, A. W., et al. (2020) · The EMBO Journal · doi:10.15252/embj.20105114 · Cited by 1,100
“On the other hand, it typically comes with less reads per cell and less genes detected (Bakken et al, 2018), although this bias seems low in our dataset, as the number of both detected genes and unique molecular identifiers (UMIs) is comparable across samples in both datasets (Appendix Fig S3).”
Systematic comparison of single-cell and single-nucleus RNA-sequencing methods
Ding, J., Adiconis, X., Simmons, S. K., Kowalczyk, M. S., Hession, C. C., Marjanovic, N. D., Hughes, T. K., Wadsworth, M. H., Burks, T., Nguyen, L. T., et al. (2020) · Nature Biotechnology · doi:10.1038/s41587-020-0465-8 · Cited by 871
Metadata
- Authors
- Bakken, T. E., Hodge, R. D., Miller, J. A., Yao, Z., Nguyen, T. N., Aevermann, B., Barkan, E., Bertagnolli, D., Casper, T., Dee, N., Garren, E., Goldy, J., Graybuck, L. T., Kroll, M., Lasken, R. S., Lathia, K., Parry, S., Rimorin, C., Scheuermann, R. H., Schork, N. J., Shehata, S. I., Tieu, M., Phillips, J. W., Bernard, A., Smith, K. A., Zeng, H., Lein, E. S., & Tasic, B.
- Affiliations
- Allen Institute for Brain Science (US)
- J. Craig Venter Institute (US)
- Corresponding author
- Bakken, Trygve E.
- Hodge, Rebecca D.
- Miller, Jeremy A.
- Yao, Zizhen
- Nguyen, Thuc Nghi
- Aevermann, Brian
- Barkan, Eliza
- Bertagnolli, Darren
- Casper, Tamara
- Dee, Nick
- Garren, Emma
- Goldy, Jeff
- Graybuck, Lucas T.
- Kroll, Matthew
- Lasken, Roger S.
- Lathia, Kanan
- Parry, Sheana
- Rimorin, Christine
- Scheuermann, Richard H.
- Schork, Nicholas J.
- Shehata, Soraya I.
- Tieu, Michael
- Phillips, John W.
- Bernard, Amy
- Smith, Kimberly A.
- Zeng, Hongkui
- Lein, Ed S.
- Tasic, Bosiljka
- ORCID
- Bakken, Trygve E.
- Hodge, Rebecca D.
- Miller, Jeremy A.
- Yao, Zizhen
- Nguyen, Thuc Nghi
- Aevermann, Brian
- Barkan, Eliza
- Bertagnolli, Darren
- Casper, Tamara
- Dee, Nick
- Goldy, Jeff
- Graybuck, Lucas T.
- Kroll, Matthew
- Lathia, Kanan
- Rimorin, Christine
- Scheuermann, Richard H.
- Schork, Nicholas J.
- Shehata, Soraya I.
- Tieu, Michael
- Phillips, John W.
- Bernard, Amy
- Smith, Kimberly A.
- Zeng, Hongkui
- Lein, Ed S.
- Tasic, Bosiljka
- Venue
- PLoS ONE
- Publisher
- Public Library of Science (PLoS)
- Published
- 2018-12-26
- Volume
- 13
- Issue
- 12
- Pages
- e0209648
- ISSN
- 1932-6203 (ISSN-L)
- PMC
- PMC6306246
- OpenAlex
- W2906213364
- Cited by
- 608
- References
- 57
- Citations by year
- 2026: 75 · 2025: 78 · 2024: 86 · 2023: 86 · 2022: 89 · 2021: 84 · 2020: 80 · 2019: 24 · 2018: 5
- FWCI
- 17.25
- Type
- journal article
- Language
- en
- Open access
- gold
- doi.org
- Licence
- Locations
- PLoS ONE (publishedVersion, cc-by)
- bioRxiv (Cold Spring Harbor Laboratory) (acceptedVersion)
- Europe PMC (PubMed Central) (publishedVersion, cc-by)
- PubMed Central (publishedVersion, cc-by)
- PubMed (publishedVersion)
- DOAJ (DOAJ: Directory of Open Access Journals) (submittedVersion, cc-by-sa)
- Figshare (submittedVersion, cc-by)
- Funders
- National Institute of Mental Health (U01MH105982)
- National Eye Institute (R01EY023173)
- Topics
- Life Sciences › Biochemistry, Genetics and Molecular Biology › Molecular Biology › Single-cell and spatial transcriptomics
- Life Sciences › Biochemistry, Genetics and Molecular Biology › Molecular Biology › Genomics and Phylogenetic Studies
- Life Sciences › Biochemistry, Genetics and Molecular Biology › Molecular Biology › Genomics and Chromatin Dynamics
- Keywords
- single-nucleus RNA sequencing, single-cell RNA sequencing, cell type annotation, mouse visual cortex, nuclear RNA, introns, pyramidal neurons, neuronal cell types, transcriptome comparison
- MeSH terms
- Animals, Cell Nucleus, Neurons, Visual Cortex, Sequence Analysis, RNA, Cell Lineage, Gene Expression Profiling, Mice, Single-Cell Analysis, Transcriptome
About these checks
Registry, retraction, Cites and statistics results are computed, not judged, with one exception: a printed reference that no index lists is read once by a model before it counts as a citation error. Claims are extracted by a model and kept only when their quote appears verbatim in the text; each cited source is then checked, with a model’s help, for whether it says what the claim relies on. Those verdicts can be wrong — read the claim’s quote and the cited source before relying on one.
Statistics and arithmetic are recomputed, not judged.
Confidence bands are shown only for fields calibrated on our annotated test set. None is calibrated yet, so no band is shown.
What counts as a claim ›How we measure confidence ›How we check this ›
Are you an author, or do you see a problem with this page? Request a review
How to cite
Cite CoChat for the checks on this page, and the paper for its own findings.
- This page
- CoChat. (2026). Citation check: Single-nucleus and single-cell transcriptomes compared in matched cortical cell types. https://app.cochat.ai/papers/10.1371/journal.pone.0209648
- The paper
- Bakken, T. E., Hodge, R. D., Miller, J. A., Yao, Z., Nguyen, T. N., Aevermann, B., Barkan, E., Bertagnolli, D., Casper, T., Dee, N., Garren, E., Goldy, J., Graybuck, L. T., Kroll, M., Lasken, R. S., Lathia, K., Parry, S., Rimorin, C., Scheuermann, R. H., . . . Tasic, B. (2018). Single-nucleus and single-cell transcriptomes compared in matched cortical cell types. PLoS ONE. https://doi.org/10.1371/journal.pone.0209648
Data sources
Bibliographic data: Semantic Scholar, OpenAlex, Crossref.
Contains information from the Semantic Scholar Academic Graph Datasets, made available under the ODC Attribution License (ODC-BY 1.0).
Semantic Scholar’s data is described in: Kinney, R., et al. (2023). The Semantic Scholar Open Data Platform. arXiv:2301.10140.
