

The DOI matches its Crossref record; 30 of the 30 references it cites were found in a registry or an index.
Decontamination of ambient RNA in single-cell RNA-seq with DecontX
Open accessPublished version of a preprint
Abstract
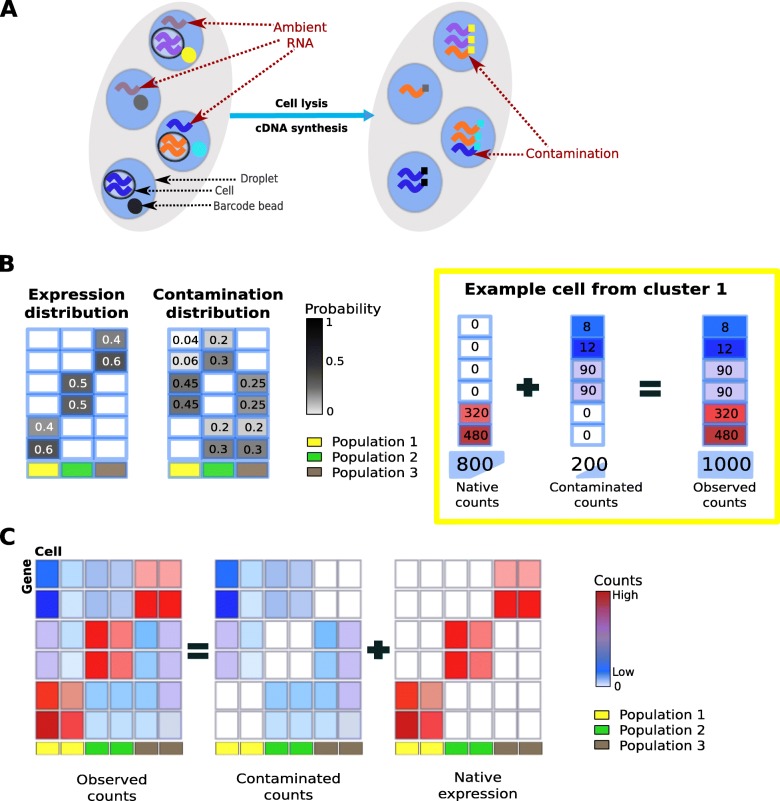
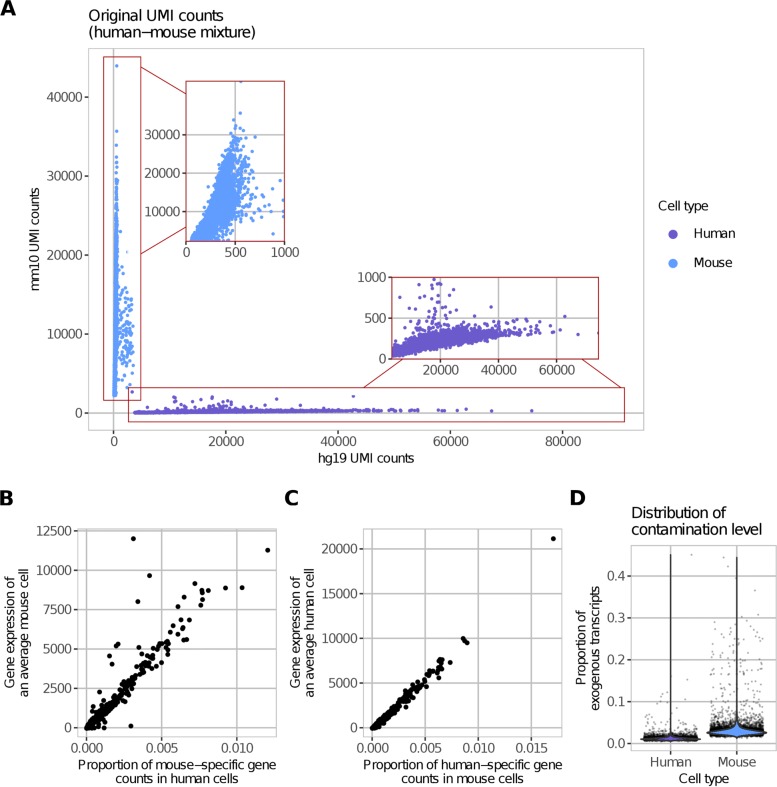
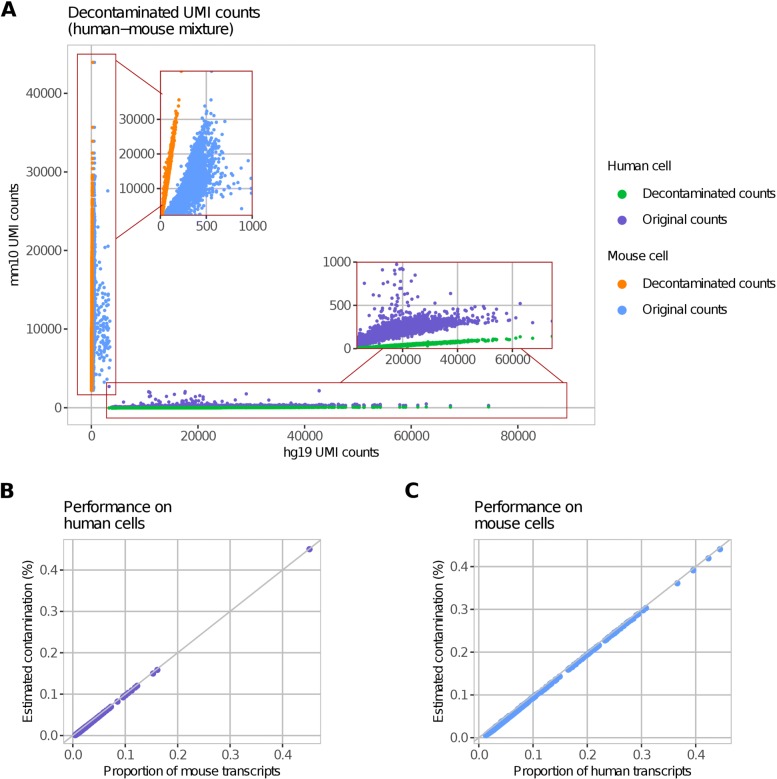
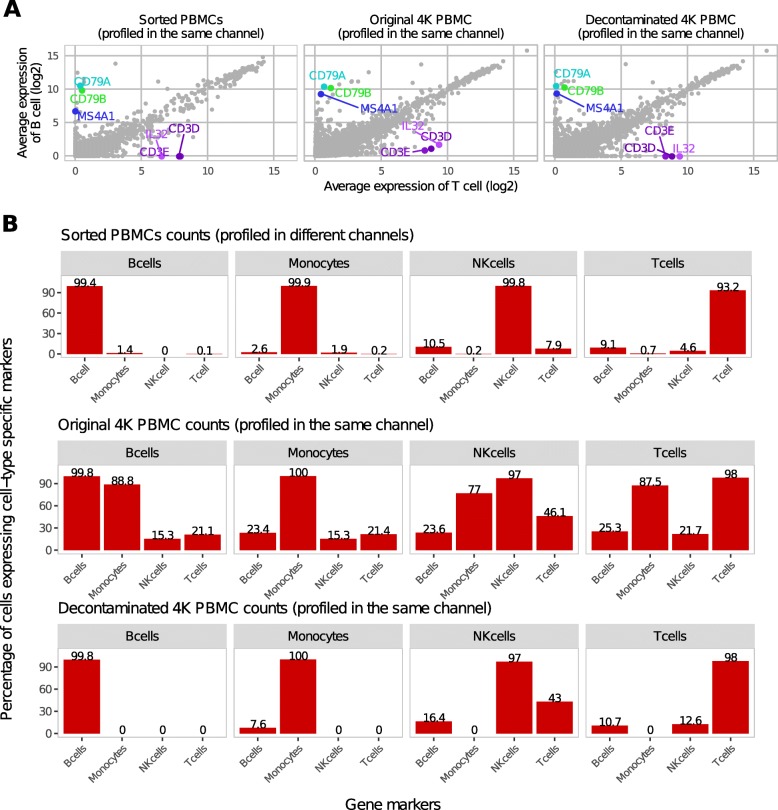
Droplet-based microfluidic devices have become widely used to perform single-cell RNA sequencing (scRNA-seq). However, ambient RNA present in the cell suspension can be aberrantly counted along with a cell’s native mRNA and result in cross-contamination of transcripts between different cell populations. DecontX is a novel Bayesian method to estimate and remove contamination in individual cells. DecontX accurately predicts contamination levels in a mouse-human mixture dataset and removes aberrant expression of marker genes in PBMC datasets. We also compare the contamination levels between four different scRNA-seq protocols. Overall, DecontX can be incorporated into scRNA-seq workflows to improve downstream analyses.
Overview
The claims and statistics of this paper haven’t been checked yet.
Run the check — free, no account needed. It reads the open-access text and checks the sources it cites.
Integrity signals
Registry
Cites
Statistics
Figures
Verification
Claims the paper makes
The claims and statistics of this paper haven’t been checked yet.
Run the check — free, no account needed. It reads the open-access text and checks the sources it cites.
Claims other papers make about this one
Each is checked against this paper’s own text: does it say what the citing paper says it does?
The cited source says what the claim attributes to it.
In the citing paper
“This allows DecontX to be applied when empty droplet counts are not available but also means that the results are potentially heavily dependent on the accuracy of the clustering provided.”
From SoupX removes ambient RNA contamination from droplet-based single-cell RNA sequencing data (2020) · cites this paper as [23]
The cited source says what the claim attributes to it.
In the citing paper
“Finally, DecontX [23] relies on accurate clustering of the data to estimate and remove the background without the need for gene counts from empty droplets.”
From SoupX removes ambient RNA contamination from droplet-based single-cell RNA sequencing data (2020) · cites this paper as [23]
In the citing paper
“one should consider removing ambient RNA as an initial analysis step in quality control to improve downstream analyses for many tissues21–23.”
From Best practices for single-cell analysis across modalities (2023) · cites this paper as [23]
Self-check
Percentages, sums and reported differences re-computed from the paper’s own numbers.
The self-check needs the paper’s full text.
Citations
Cites
(2008) · Journal of Machine Learning Research · Cited by 33,051
(2003) · Journal of Machine Learning Research · doi:10.5555/944919.944937 · Cited by 32,337
Gelman, A., Carlin, J. B., Stern, H. S., & Rubin, D. B. (2003) · doi:10.1201/9780429258480 · Cited by 27,276
UMAP: Uniform Manifold Approximation and Projection
McInnes, L., Healy, J., Saul, N., & Großberger, L. (2018) · Journal of Open Source Software · doi:10.21105/joss.00861 · Cited by 9,826
Massively parallel digital transcriptional profiling of single cells
Zheng, G. X. Y., Terry, J. M., Belgrader, P., Ryvkin, P., Bent, Z. W., Wilson, R., Ziraldo, S. B., Wheeler, T. D., McDermott, G. P., Zhu, J., et al. (2017) · Nature Communications · doi:10.1038/ncomms14049 · Cited by 7,353
Highly parallel genome-wide expression profiling of individual cells using nanoliter droplets.
Macosko, E. Z., Basu, A., Satija, R., Nemesh, J., Shekhar, K., Goldman, M., Tirosh, I., Bialas, A. R., Kamitaki, N., Martersteck, E. M., et al. (2015) · Cell · doi:10.1016/j.cell.2015.05.002 · Cited by 7,110
UMAP: Uniform Manifold Approximation and Projection for Dimension Reduction
McInnes, L., Healy, J., & Melville, J. (2018) · arXiv · doi:10.48550/arxiv.1802.03426 · Cited by 7,101
McGinnis, C. S., Murrow, L. M., & Gartner, Z. J. (2019) · Cell Systems · doi:10.1016/j.cels.2019.03.003 · Cited by 4,521
Variational Inference: A Review for Statisticians
Blei, D. M., Kucukelbir, A., & McAuliffe, J. D. (2017) · Journal of the American Statistical Association · doi:10.1080/01621459.2017.1285773 · Cited by 4,498
An Introduction to Variational Methods for Graphical Models
Jordan, M. I., Ghahramani, Z., Jaakkola, T. S., & Saul, L. K. (1999) · Machine Learning · doi:10.1023/a:1007665907178 · Cited by 3,791
Scrublet: computational identification of cell doublets in single-cell transcriptomic data
Wolock, S. L., Lopez, R., & Klein, A. M. (2018) · doi:10.1101/357368 · Cited by 2,758 · cited 8×
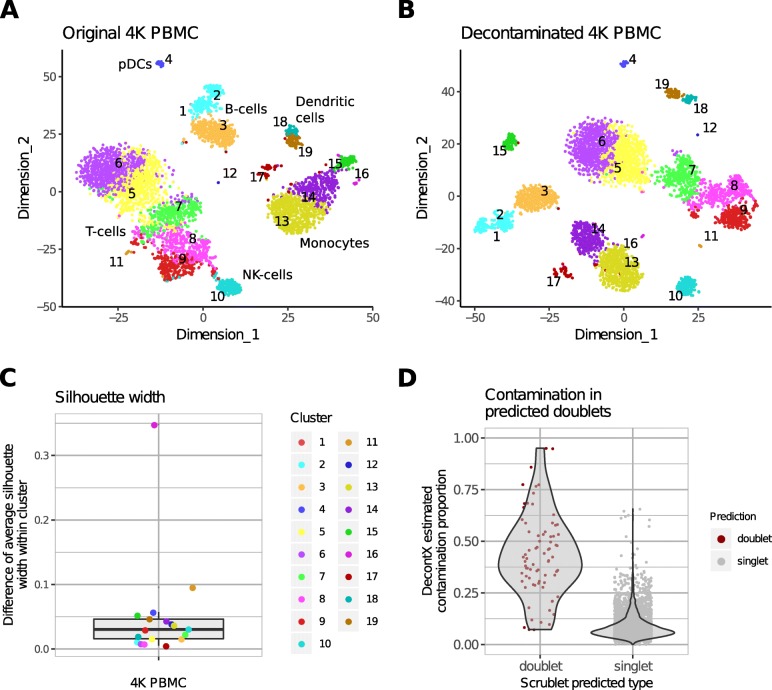
“Interestingly, cells from cluster 17 were predicted to be doublets by a doublet prediction method Scrublet (Wolock et al,2019) (Figure 6A).”
MethodInfluentialScrublet: computational identification of cell doublets in single-cell transcriptomic data
Wolock, S. L., Lopez, R., & Klein, A. M. (2019) · Cell Systems · doi:10.1016/j.cels.2018.11.005 · Cited by 2,758
Variational Inference: A Review for Statisticians
Blei, D. M., Kucukelbir, A., & McAuliffe, J. (2023) · Figshare · doi:10.6084/m9.figshare.5203696.v2 · Cited by 2,088
Variational Inference: A Review for Statisticians
Blei, D. M., Kucukelbir, A., & McAuliffe, J. (2017) · Figshare · doi:10.6084/m9.figshare.5203696 · Cited by 2,048
Comparative Analysis of Single-Cell RNA Sequencing Methods
Ziegenhain, C., Vieth, B., Parekh, S., Reinius, B., Guillaumet-Adkins, A., Smets, M., Leonhardt, H., Heyn, H., Hellmann, I., & Enard, W. (2017) · Molecular Cell · doi:10.1016/j.molcel.2017.01.023 · Cited by 1,494
Multiplexed droplet single-cell RNA-sequencing using natural genetic variation
Kang, H. M., Subramaniam, M., Targ, S., Nguyen, M., Maliskova, L., McCarthy, E., Wan, E., Wong, S., Byrnes, L., Lanata, C. M., et al. (2018) · Nature Biotechnology · doi:10.1038/nbt.4042 · Cited by 1,101 · cited 1×
“Other approaches such as demuxlet [12] and scds [13] model gene expression from the original data, then assign doublet to barcodes that have observed expression from genes that are likely to not occur simultaneously.”
MethodDefining cell types and states with single-cell genomics
Trapnell, C. (2015) · Genome Research · doi:10.1101/gr.190595.115 · Cited by 813
Estimating a Dirichlet Distribution
Minka, T. P. (2000) · Cited by 778
The unconventional lifestyle of NKT cells
Kronenberg, M., & Gapin, L. (2002) · Nature reviews. Immunology · doi:10.1038/nri854 · Cited by 750
Single-cell barcoding and sequencing using droplet microfluidics
Žilionis, R., Nainys, J., Veres, A., Savova, V., Zemmour, D., Klein, A. M., & Mažutis, L. (2016) · Nature Protocols · doi:10.1038/nprot.2016.154 · Cited by 735
Advances and Applications of Single-Cell Sequencing Technologies
Wang, Y., & Navin, N. E. (2015) · Molecular Cell · doi:10.1016/j.molcel.2015.05.005 · Cited by 624
An Introduction to Variational Methods for Graphical Models
Jordan, M. I., Ghahramani, Z., Jaakkola, T., & Saul, L. K. (1998) · Springer eBooks · doi:10.1007/978-94-011-5014-9_5 · Cited by 604
Benchmarking single-cell RNA-sequencing protocols for cell atlas projects
Mereu, E., Lafzi, A., Moutinho, C., Ziegenhain, C., McCarthy, D. J., Álvarez-Varela, A., Batlle, E., Sagar, Grün, D., Lau, J. K., et al. (2020) · Nature Biotechnology · doi:10.1038/s41587-020-0469-4 · Cited by 499
Benchmarking single cell RNA-sequencing analysis pipelines using mixture control experiments
Tian, L., Dong, X., Freytag, S., Cao, K. L., Su, S., JalalAbadi, A., Amann‐Zalcenstein, D., Weber, T. S., Seidi, A., Jabbari, J. S., et al. (2019) · Nature Methods · doi:10.1038/s41592-019-0425-8 · Cited by 355
Detection and removal of barcode swapping in single-cell RNA-seq data
Griffiths, J. A., Richard, A. C., Bach, K., Lun, A. T. L., & Marioni, J. C. (2018) · Nature Communications · doi:10.1038/s41467-018-05083-x · Cited by 324
scds: computational annotation of doublets in single-cell RNA sequencing data
Bais, A. S., & Kostka, D. (2020) · Bioinformatics · doi:10.1093/bioinformatics/btz698 · Cited by 308
Costello, M., Fleharty, M., Abreu, J., Farjoun, Y., Ferriera, S., Holmes, L., Granger, B., Green, L., Howd, T., Mason, T., et al. (2018) · BMC Genomics · doi:10.1186/s12864-018-4703-0 · Cited by 260
An Enhanced Density Based Spatial Clustering of Applications with Noise
Ram, A., Sharma, A., Jalal, A. S., Agrawal, A. K., & Singh, R. (2009) · IEEE International Advance Computing Conference · doi:10.1109/iadcc.2009.4809235 · Cited by 144
scds: Computational Annotation of Doublets in Single Cell RNA Sequencing DataPreprint
Bais, A., & Kostka, D. (2019) · bioRxiv · doi:10.1101/564021 · Cited by 122
Decontamination of ambient RNA in single-cell RNA-seq with DecontXPreprint
Yang, S., Corbett, S. E., Koga, Y., et al. (2019) · bioRxiv (Cold Spring Harbor Laboratory) · doi:10.1101/704015 · Cited by 56
Self-citation
Cited by
Sorted by citations
SoupX removes ambient RNA contamination from droplet-based single-cell RNA sequencing data
Young, M. D., & Behjati, S. (2020) · GigaScience · doi:10.1093/gigascience/giaa151 · Cited by 1,619
“Finally, De-contX [23] relies on accurate clustering of the data to estimate and remove the background without the need for gene counts from empty droplets.”
Best practices for single-cell analysis across modalities
Heumos, L., Schaar, A. C., Lance, C., Litinetskaya, A., Drost, F., Zappia, L., Lücken, M. D., Strobl, D. C., Henao, J., Curion, F., et al. (2023) · Nature Reviews Genetics · doi:10.1038/s41576-023-00586-w · Cited by 1,051
The Tabula Sapiens: A multiple-organ, single-cell transcriptomic atlas of humans
The Tabula Sapiens Consortium*, Jones, R. C., Karkanias, J., Krasnow, M. A., Pisco, A. O., Quake, S. R., Salzman, J., Yosef, N., Bulthaup, B., Brown, P., et al. (2022) · Science · doi:10.1126/science.abl4896 · Cited by 1,056
Self-citationFleming, S. J., Chaffin, M. D., Arduini, A., Akkad, A.-D., Banks, E., Marioni, J. C., Philippakis, A. A., Ellinor, P. T., & Babadi, M. (2023) · Nature Methods · doi:10.1038/s41592-023-01943-7 · Cited by 867
Fly Cell Atlas: A single-nucleus transcriptomic atlas of the adult fruit fly
Li, H., Janssens, J., Waegeneer, M. D., Kolluru, S. S., Davie, K., Gardeux, V., Saelens, W., David, F. P. A., Brbić, M., Spanier, K. I., et al. (2022) · Science · doi:10.1126/science.abk2432 · Cited by 826
Metadata
- Authors
- Yang, S., Corbett, S. E., Koga, Y., Wang, Z., Johnson, W. E., Yajima, M., & Campbell, J. D.
- Affiliations
- Boston University (US)
- Corresponding author
- Campbell, Joshua D.
- Venue
- Genome Biology
- Published
- 2020-03-05
- Volume
- 21
- Issue
- 1
- Pages
- 57-57
- ISSN
- 1465-6906 (ISSN-L)
- 1474-760X
- PMC
- PMC7059395
- OpenAlex
- W3010766518
- Cited by
- 635
- References
- 27
- Citations by year
- 2026: 177 · 2025: 158 · 2024: 131 · 2023: 77 · 2022: 52 · 2021: 23 · 2020: 15
- FWCI
- 14.34
- Type
- journal article
- Language
- en
- Open access
- gold
- doi.org
- Locations
- Genome biology (publishedVersion, cc-by)
- bioRxiv (Cold Spring Harbor Laboratory) (acceptedVersion, cc-by)
- PubMed Central (publishedVersion, cc-by)
- PubMed (publishedVersion)
- OpenBU (Boston University) (publishedVersion, cc-by)
- DOAJ (DOAJ: Directory of Open Access Journals) (submittedVersion, cc-by-sa)
- Funders
- National Library of Medicine (R01LM013154-01)
- Informatics Technology for Cancer Research (1U01 CA220413- 01)
- Topics
- Life Sciences › Biochemistry, Genetics and Molecular Biology › Molecular Biology › Single-cell and spatial transcriptomics
- Life Sciences › Biochemistry, Genetics and Molecular Biology › Molecular Biology › Genomics and Phylogenetic Studies
- Life Sciences › Biochemistry, Genetics and Molecular Biology › Molecular Biology › Gene expression and cancer classification
- Keywords
- single-cell RNA sequencing, pollutant removal, Bayesian estimation, droplet microfluidics, cross-contamination, peripheral blood mononuclear cells
- MeSH terms
- RNA-Seq, Animals, Bayes Theorem, Cell Line, Humans, RNA, Mice, Lab-On-A-Chip Devices, Single-Cell Analysis
About these checks
Registry, retraction, Cites and statistics results are computed, not judged, with one exception: a printed reference that no index lists is read once by a model before it counts as a citation error. Claims are extracted by a model and kept only when their quote appears verbatim in the text; each cited source is then checked, with a model’s help, for whether it says what the claim relies on. Those verdicts can be wrong — read the claim’s quote and the cited source before relying on one.
Statistics and arithmetic are recomputed, not judged.
Confidence bands are shown only for fields calibrated on our annotated test set. None is calibrated yet, so no band is shown.
What counts as a claim ›How we measure confidence ›How we check this ›
Are you an author, or do you see a problem with this page? Request a review
