Cited by 21

The DOI matches its Crossref record; 4 of the 4 references it cites were found in a registry or an index.

MBD5 and MBD6 stabilize the BAP1 complex and promote BAP1-dependent cancer

Tsuboyama, Natsumi, Szczepanski, Aileen Patricia, Zhao, Zibo, Wang, Lu·2022·Genome Biology

Abstract

Background: BRCA1-associated protein 1 (BAP1) is an ubiquitin carboxy-terminal hydrolase, which forms a multi-protein complex with different epigenetic factors, such as ASXL1-3 and FOXK1/2. At the chromatin level, BAP1 catalyzes the removal of mono-ubiquitination on histone H2AK119 in collaboration with other subunits within the complex and functions as a transcriptional activator in mammalian cells. However, the crosstalk between different subunits and how these subunits impact BAP1’s function remains unclear. Results: We report the identification of the methyl-CpG-binding domain proteins 5 and 6 (MBD5 and MBD6) that bind to the C-terminal PHD fingers of the large scaffold subunits ASXL1-3 and stabilize the BAP1 complex at the chromatin. We further identify a novel Drosophila protein, the six-banded (SBA), as an ortholog of human MBD5 and MBD6, and demonstrate that the core modules of the BAP1 complex is structurally and functionally conserved from Drosophila (Calypso/ASX/SBA) to human cells (BAP1/ASXL/MBD). Dysfunction of the BAP1 complex induced by the misregulation/mutations in its subunit(s) are frequent in many human cancers. In BAP1-dependent human cancers, such as small cell lung cancer (SCLC), MBD6 tends to be a part of the predominant complex formed. Therefore, depletion of MBD6 leads to a global loss of BAP1 occupancy at the chromatin, resulting in a reduction of BAP1-dependent gene expression and tumor growth in vitro and in vivo. Conclusions: We characterize MBD5 and MBD6 as important regulators of the BAP1 complex and maintain its transcriptional landscape, shedding light on the therapeutic potential of targeting MBD5 and MBD6 in BAP1-dependent human cancers.

Overview

The claims and statistics of this paper haven’t been checked yet.

Run the check — free, no account needed. It reads the open-access text and checks the sources it cites.

A few free checks a day · papers already verified open instantly · results are public

Integrity signals

Registry

Crossref · 10.1186/s13059-022-02776-x

Cites

4 of 4 references verified0 citation errors · 0 not checkable

Statistics

Figures

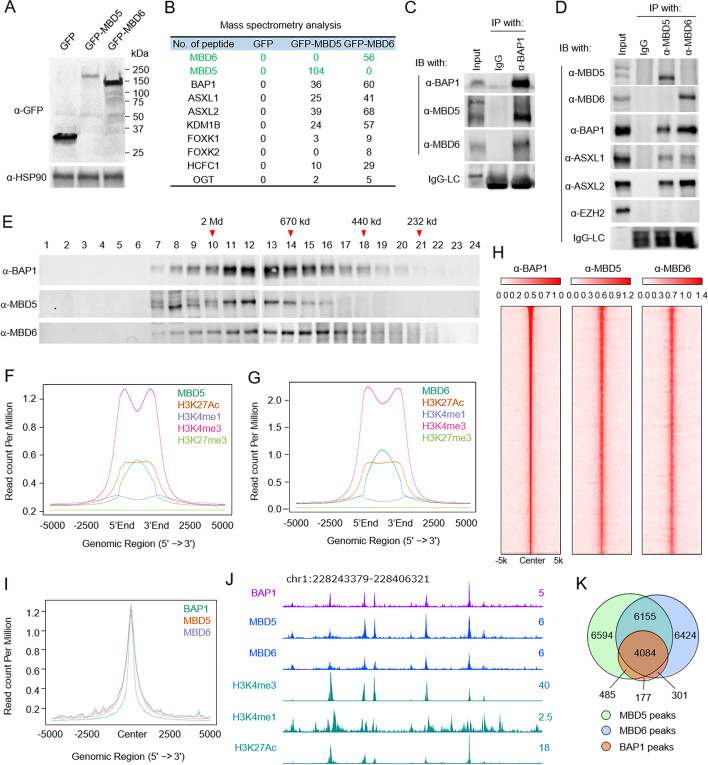
Fig. 1 Endogenous MBD5 and MBD6 are stable components in the BAP1 complex. A HEK293T cells were infected by lentivirus expressing GFP, GFP-tagged MBD5, or GFP-tagged-MBD6. The protein levels of GFP, GFP-MBD5, and GFP-MBD6 were determined by western blot, n=2. B The GFP-fusion proteins were purified from HEK293T cells stably expressing GFP, GFP-MBD5, or GFP-MBD6 defined in A. The purified proteins were subjected to mass spectrometry analysis. Peptide numbers of subunits within the BAP1 complex pulled down by GFP-tagged proteins are shown. C Immunoprecipitation (IP) of endogenous BAP1 from HEK293T cells followed by immunoblot (IB) for BAP1, MBD5, and MBD6. IgG was used as a negative control, n = 2. D IP of endogenous MBD5 or MBD6 from HEK293T cells followed by IB for MBD5, MBD6, BAP1, ASXL1, and ASXL2. IgG was used as a negative control, n = 2. E Nuclear extract from HEK293T cells was subjected to size exclusion (SE) chromatography and then protein levels of BAP1, MBD5, and MBD6 were determined by western blot analysis, n = 2. F The average plots shown represent the chromatin occupancy of H3K27Ac, H3K4me1, H3K4me3, and H3K27me3 centered on MBD5 peaks (F) or MBD6 peaks (G). H Sorted and centered heatmaps generated from ChIP-seq data analyses show the occupancy of BAP1, MBD5, and MBD6 in HEK293T cells. All rows are centered on BAP1 peaks based on the ranking of signals. I The average plot shows the co-occupancy between BAP1, MBD5, and MBD6 centered on BAP1 peaks. J The representative tracks show H3K27Ac, H3K4me1, and H3K4me3 levels at BAP1, MBD5, and MBD6 occupied loci in HEK293T cells. K A Venn diagram representation of the overlapped ChIP-seq peaks between BAP1, MBD5, and MBD6
Fig. 1 Endogenous MBD5 and MBD6 are stable components in the BAP1 complex. A HEK293T cells were infected by lentivirus expressing GFP, GFP-tagged MBD5, or GFP-tagged-MBD6. The protein levels of GFP, GFP-MBD5, and GFP-MBD6 were determined by western blot, n=2. B The GFP-fusion proteins were purified from HEK293T cells stably expressing GFP, GFP-MBD5, or GFP-MBD6 defined in A. The purified proteins were subjected to mass spectrometry analysis. Peptide numbers of subunits within the BAP1 complex pulled down by GFP-tagged proteins are shown. C Immunoprecipitation (IP) of endogenous BAP1 from HEK293T cells followed by immunoblot (IB) for BAP1, MBD5, and MBD6. IgG was used as a negative control, n = 2. D IP of endogenous MBD5 or MBD6 from HEK293T cells followed by IB for MBD5, MBD6, BAP1, ASXL1, and ASXL2. IgG was used as a negative control, n = 2. E Nuclear extract from HEK293T cells was subjected to size exclusion (SE) chromatography and then protein levels of BAP1, MBD5, and MBD6 were determined by western blot analysis, n = 2. F The average plots shown represent the chromatin occupancy of H3K27Ac, H3K4me1, H3K4me3, and H3K27me3 centered on MBD5 peaks (F) or MBD6 peaks (G). H Sorted and centered heatmaps generated from ChIP-seq data analyses show the occupancy of BAP1, MBD5, and MBD6 in HEK293T cells. All rows are centered on BAP1 peaks based on the ranking of signals. I The average plot shows the co-occupancy between BAP1, MBD5, and MBD6 centered on BAP1 peaks. J The representative tracks show H3K27Ac, H3K4me1, and H3K4me3 levels at BAP1, MBD5, and MBD6 occupied loci in HEK293T cells. K A Venn diagram representation of the overlapped ChIP-seq peaks between BAP1, MBD5, and MBD6CC BY · PubMed Central
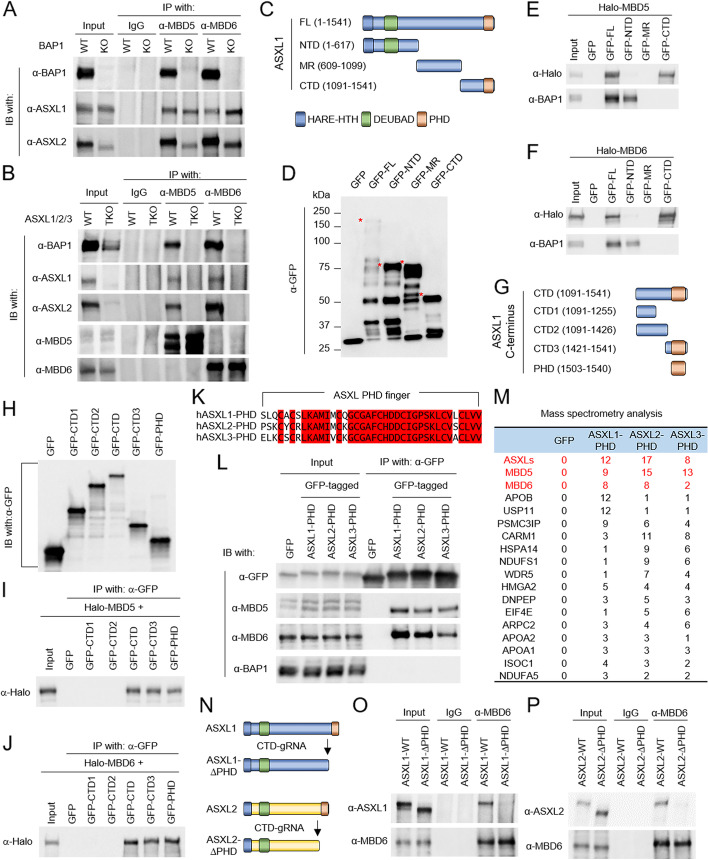
Fig. 2 The ASXL subunits link MBD5, MBD6 to BAP1 via their C-terminal PHD fingers. A IP of endogenous MBD5 or MBD6 from wild-type or BAP1 knockout HEK293T cells followed by IB for BAP1, ASXL1, and ASXL2. IgG was used as a negative control, n = 2. B IP of endogenous MBD5 or MBD6 from ASXL1/2/3 triple-knockout (TKO) HEK293T cells followed by IB for BAP1, ASXL1, ASXL2, MBD5, and MBD6. IgG was used as a negative control, n = 2. C Schematic diagram depicting the truncations of human ASXL1 protein. D HEK293T cells were transfected with plasmids expressing GFP, GFP-tagged full-length, or truncated ASXL1. The levels of GFP-tagged proteins were determined by western blot analysis, n = 2. E, F HEK293T cells were co-transfected with plasmids expressing each fragment of ASXL1 and either Halo-tagged MBD5 (E) or MBD6 (F). Then, the cells were subjected to co-IP assay using GFP-trap agarose followed by western blotting using antibodies against BAP1 and Halo-tag, n = 2. G Schematic diagram depicting the truncations of C-terminus of human ASXL1 protein. H HEK293T cells were transfected with plasmids expressing either GFP, GFP-tagged full-length, or GFP-tagged truncated C-terminus of ASXL1 and the protein levels of GFP-tagged proteins were determined by western blot analysis, n = 2. I, J HEK293T cells were co-transfected with plasmids expressing GFP-tagged truncated C-terminus of ASXL1 and either Halo-tagged MBD6 (I) or MBD5 (J). They were subjected to co-IP assay using an antibody against GFP followed by western blotting using antibodies against Halo-tag, n = 2. K CLUSTALW alignment shows the similarity between PHD fingers of ASXL1/2/3. L HEK293T cells were transfected with GFP-tagged PHD fingers of ASXL1/2/3 followed by IP of GFP and IB of MBD5, MBD6, and BAP1, n = 2. M The GFP-fusion proteins were purified from HEK293T cells transduced with GFP-tagged PHD finger of ASXL1/2/3. The purified proteins were subjected to mass spectrometry analysis. Peptide numbers of representative proteins were shown. N Schematic diagram depicting the PHD finger depletion of human ASXL1/2 proteins targeted by sgRNA. O, P IP of MBD6 from wild-type cells and ASXL1-PHD finger deleted (O) or ASXL2-PHD finger deleted (P) cells followed by IB of MBD6 and ASXL1 (O) or ASXL2 (P), n = 2
Fig. 2 The ASXL subunits link MBD5, MBD6 to BAP1 via their C-terminal PHD fingers. A IP of endogenous MBD5 or MBD6 from wild-type or BAP1 knockout HEK293T cells followed by IB for BAP1, ASXL1, and ASXL2. IgG was used as a negative control, n = 2. B IP of endogenous MBD5 or MBD6 from ASXL1/2/3 triple-knockout (TKO) HEK293T cells followed by IB for BAP1, ASXL1, ASXL2, MBD5, and MBD6. IgG was used as a negative control, n = 2. C Schematic diagram depicting the truncations of human ASXL1 protein. D HEK293T cells were transfected with plasmids expressing GFP, GFP-tagged full-length, or truncated ASXL1. The levels of GFP-tagged proteins were determined by western blot analysis, n = 2. E, F HEK293T cells were co-transfected with plasmids expressing each fragment of ASXL1 and either Halo-tagged MBD5 (E) or MBD6 (F). Then, the cells were subjected to co-IP assay using GFP-trap agarose followed by western blotting using antibodies against BAP1 and Halo-tag, n = 2. G Schematic diagram depicting the truncations of C-terminus of human ASXL1 protein. H HEK293T cells were transfected with plasmids expressing either GFP, GFP-tagged full-length, or GFP-tagged truncated C-terminus of ASXL1 and the protein levels of GFP-tagged proteins were determined by western blot analysis, n = 2. I, J HEK293T cells were co-transfected with plasmids expressing GFP-tagged truncated C-terminus of ASXL1 and either Halo-tagged MBD6 (I) or MBD5 (J). They were subjected to co-IP assay using an antibody against GFP followed by western blotting using antibodies against Halo-tag, n = 2. K CLUSTALW alignment shows the similarity between PHD fingers of ASXL1/2/3. L HEK293T cells were transfected with GFP-tagged PHD fingers of ASXL1/2/3 followed by IP of GFP and IB of MBD5, MBD6, and BAP1, n = 2. M The GFP-fusion proteins were purified from HEK293T cells transduced with GFP-tagged PHD finger of ASXL1/2/3. The purified proteins were subjected to mass spectrometry analysis. Peptide numbers of representative proteins were shown. N Schematic diagram depicting the PHD finger depletion of human ASXL1/2 proteins targeted by sgRNA. O, P IP of MBD6 from wild-type cells and ASXL1-PHD finger deleted (O) or ASXL2-PHD finger deleted (P) cells followed by IB of MBD6 and ASXL1 (O) or ASXL2 (P), n = 2CC BY · PubMed Central
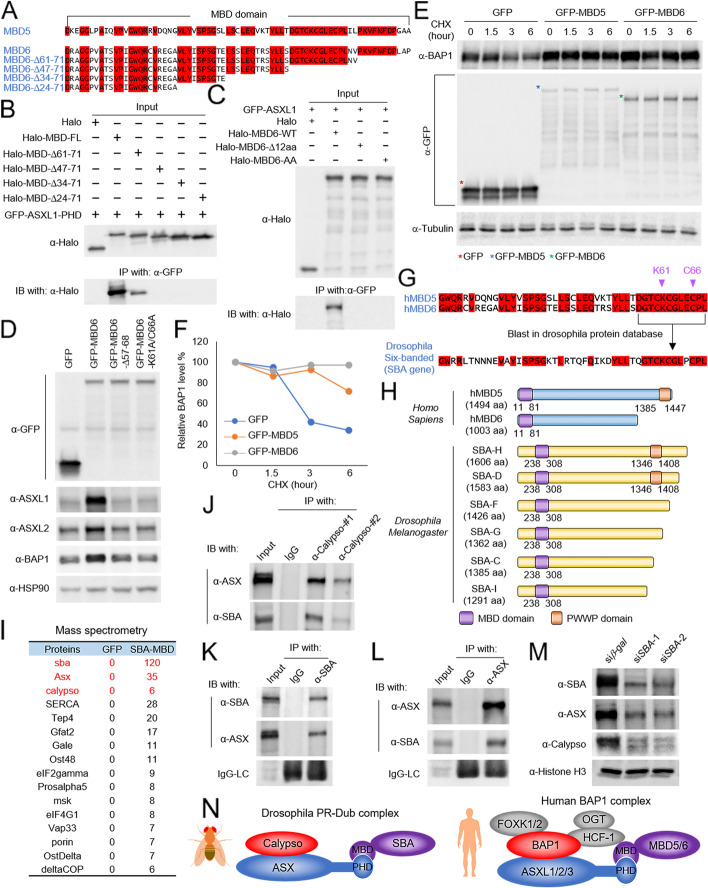
Fig. 3 MBD5 and MBD6 evolutionally contributes to the stability of the BAP1 complex. A Alignment by CLUSTALW analysis shows the similarity between MBD domains of human MBD5 and MBD6. B HEK293T cells were co-transfected with plasmids expressing GFP-tagged PHD finger of ASXL1 and each Halo-tagged truncated MBD domain of MBD6. Then the cells were subjected to co-IP assay using GFP-trap agarose followed by IB for Halo-tag, n = 2. C HEK293T cells were transfected with plasmids expressing Halo-tagged MBD6-WT, MBD6-Δ12aa, or MBD6-K61A/C66A together with GFP-tagged ASXL1 followed by IP of GFP and IB for Halo-tag, n = 2. D HEK293T cells were transduced with lentivirus expressing GFP, GFP-tagged MBD6-WT, MBD6-Δ12aa, or MBD6-K61A/C66A. The protein levels of ASXL1, ASXL2, and BAP1 were determined by western blot. HSP90 was used as an internal control, n = 2. E, F HEK293T cells stably expressing GFP, GFP-tagged MBD5, or GFP-tagged MBD6 were treated with CHX (50 μg/ml) for indicated time durations. The whole cell lysate was collected at each time point, and the total protein level of BAP1 was determined by western blot, n=2 (E) and quantified by ImageJ (F). G The computational BLAST with the 12-aa from human MBD5 and MBD6 in Drosophila protein database. H Schematic diagram depicting human MBD5 and MBD6 and isoforms of Drosophila SBA. I The GFP-fusion proteins were purified from Drosophila S2 cells transduced with the GFP-tagged MBD domain of SBA. The purified proteins were subjected to mass spectrometry analysis. Peptide numbers of representative proteins pulled down by the GFP-MBD domain of SBA were shown. JDrosophila S2 cells were subjected to co-IP assay using an antibody against Calypso followed by IB for ASX and SBA, n = 2. KDrosophila S2 cells were subjected to co-IP assay using an antibody against SBA followed by IB for SBA and ASX, n = 2. LDrosophila S2 cells were subjected to co-IP assay using an antibody against ASX followed by IB for ASX and SBA, n = 2. M The western blot shows protein levels of SBA, ASX, and Calypso in Drosophila S2 cells treated with dsRNA targeting SBA. Histone H3 was used as internal control, n = 2. N Schema of the Drosophila PR-DUB complex and the human BAP1 complex
Fig. 3 MBD5 and MBD6 evolutionally contributes to the stability of the BAP1 complex. A Alignment by CLUSTALW analysis shows the similarity between MBD domains of human MBD5 and MBD6. B HEK293T cells were co-transfected with plasmids expressing GFP-tagged PHD finger of ASXL1 and each Halo-tagged truncated MBD domain of MBD6. Then the cells were subjected to co-IP assay using GFP-trap agarose followed by IB for Halo-tag, n = 2. C HEK293T cells were transfected with plasmids expressing Halo-tagged MBD6-WT, MBD6-Δ12aa, or MBD6-K61A/C66A together with GFP-tagged ASXL1 followed by IP of GFP and IB for Halo-tag, n = 2. D HEK293T cells were transduced with lentivirus expressing GFP, GFP-tagged MBD6-WT, MBD6-Δ12aa, or MBD6-K61A/C66A. The protein levels of ASXL1, ASXL2, and BAP1 were determined by western blot. HSP90 was used as an internal control, n = 2. E, F HEK293T cells stably expressing GFP, GFP-tagged MBD5, or GFP-tagged MBD6 were treated with CHX (50 μg/ml) for indicated time durations. The whole cell lysate was collected at each time point, and the total protein level of BAP1 was determined by western blot, n=2 (E) and quantified by ImageJ (F). G The computational BLAST with the 12-aa from human MBD5 and MBD6 in Drosophila protein database. H Schematic diagram depicting human MBD5 and MBD6 and isoforms of Drosophila SBA. I The GFP-fusion proteins were purified from Drosophila S2 cells transduced with the GFP-tagged MBD domain of SBA. The purified proteins were subjected to mass spectrometry analysis. Peptide numbers of representative proteins pulled down by the GFP-MBD domain of SBA were shown. JDrosophila S2 cells were subjected to co-IP assay using an antibody against Calypso followed by IB for ASX and SBA, n = 2. KDrosophila S2 cells were subjected to co-IP assay using an antibody against SBA followed by IB for SBA and ASX, n = 2. LDrosophila S2 cells were subjected to co-IP assay using an antibody against ASX followed by IB for ASX and SBA, n = 2. M The western blot shows protein levels of SBA, ASX, and Calypso in Drosophila S2 cells treated with dsRNA targeting SBA. Histone H3 was used as internal control, n = 2. N Schema of the Drosophila PR-DUB complex and the human BAP1 complexCC BY · PubMed Central
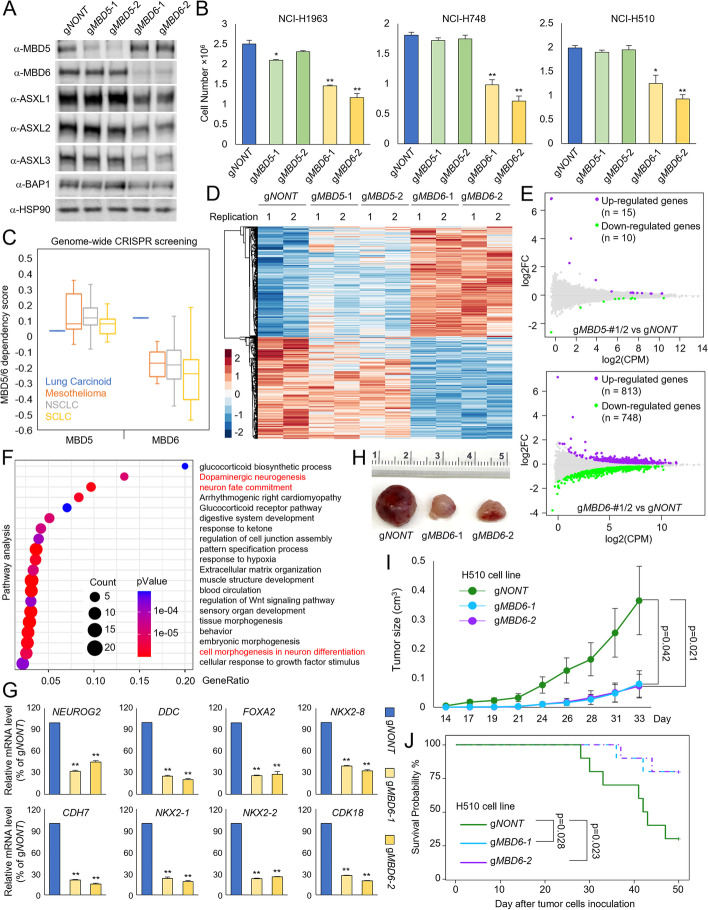
Fig. 4 MBD6 but not MBD5 is necessary for tumor cell growth. A The human SCLC cell line NCI-H1963 cells were transduced with either non-targeting CRISPR-Cas9 or two distinct CRISPR-Cas9 sgRNAs of MBD5 and MBD6. The protein levels of MBD5, MBD6, ASXL1-3, and BAP1 were determined by western blot, n=2. B Three different human SCLC cell lines were transduced with either non-targeting CRISPR gRNA, MBD5-specific gRNAs, or MBD6-specific gRNAs for 4 days. The cell numbers were determined by cell counting assay, n=3. Two-tailed unpaired Student’s t test, **P < 0.01; *P < 0.05. C The box plot shows the MBD5 and MBD6 dependency scores of different lung cancer cell types retrieved from the DepMap database. RNA-seq was performed for NCI-H1963 cells transduced with either non-targeting sgRNA, two different MBD5-specific sgRNAs, or two different MBD6-specific sgRNAs. The heatmaps (D) and the MA plot (E) show the differentially expressed genes by the depletion of MBD5 or MBD6, n = 2. F Pathway analysis by Metascape of genes that are downregulated upon MBD6 depletion in NCI-H1963 cells. G The mRNA levels of NEUROG2, DDC, FOXA2, NKX2-8, CDH7, NKX2-1, NXK2-2, and CDK18 genes, which are all critical genes for SCLC development were determined by real-time qPCR in NCI-H1963 cells transduced with non-targeting sgRNA or two different MBD6-specific sgRNAs, n=3. Two-tailed unpaired Student’s t test, **P < 0.01; *P < 0.05. H 1×10⁶ of NCI-H510 SCLC cells transduced with either non-targeting sgRNAs or two distinct MBD6 sgRNAs that were then inoculated into the right flank of athymic nude mice, n=10 per group. Images of representative tumor tissue samples from each mouse were taken at the end of the experiment. I The tumor growth was measured using a calibrated caliper every 2–3 days. Weltch’s t-test was used for statistical analysis. J When each tumor reached 1 cm3, the mouse was euthanized and the survival probability was shown. Log-rank test was performed
Fig. 4 MBD6 but not MBD5 is necessary for tumor cell growth. A The human SCLC cell line NCI-H1963 cells were transduced with either non-targeting CRISPR-Cas9 or two distinct CRISPR-Cas9 sgRNAs of MBD5 and MBD6. The protein levels of MBD5, MBD6, ASXL1-3, and BAP1 were determined by western blot, n=2. B Three different human SCLC cell lines were transduced with either non-targeting CRISPR gRNA, MBD5-specific gRNAs, or MBD6-specific gRNAs for 4 days. The cell numbers were determined by cell counting assay, n=3. Two-tailed unpaired Student’s t test, **P < 0.01; *P < 0.05. C The box plot shows the MBD5 and MBD6 dependency scores of different lung cancer cell types retrieved from the DepMap database. RNA-seq was performed for NCI-H1963 cells transduced with either non-targeting sgRNA, two different MBD5-specific sgRNAs, or two different MBD6-specific sgRNAs. The heatmaps (D) and the MA plot (E) show the differentially expressed genes by the depletion of MBD5 or MBD6, n = 2. F Pathway analysis by Metascape of genes that are downregulated upon MBD6 depletion in NCI-H1963 cells. G The mRNA levels of NEUROG2, DDC, FOXA2, NKX2-8, CDH7, NKX2-1, NXK2-2, and CDK18 genes, which are all critical genes for SCLC development were determined by real-time qPCR in NCI-H1963 cells transduced with non-targeting sgRNA or two different MBD6-specific sgRNAs, n=3. Two-tailed unpaired Student’s t test, **P < 0.01; *P < 0.05. H 1×10⁶ of NCI-H510 SCLC cells transduced with either non-targeting sgRNAs or two distinct MBD6 sgRNAs that were then inoculated into the right flank of athymic nude mice, n=10 per group. Images of representative tumor tissue samples from each mouse were taken at the end of the experiment. I The tumor growth was measured using a calibrated caliper every 2–3 days. Weltch’s t-test was used for statistical analysis. J When each tumor reached 1 cm3, the mouse was euthanized and the survival probability was shown. Log-rank test was performedCC BY · PubMed Central
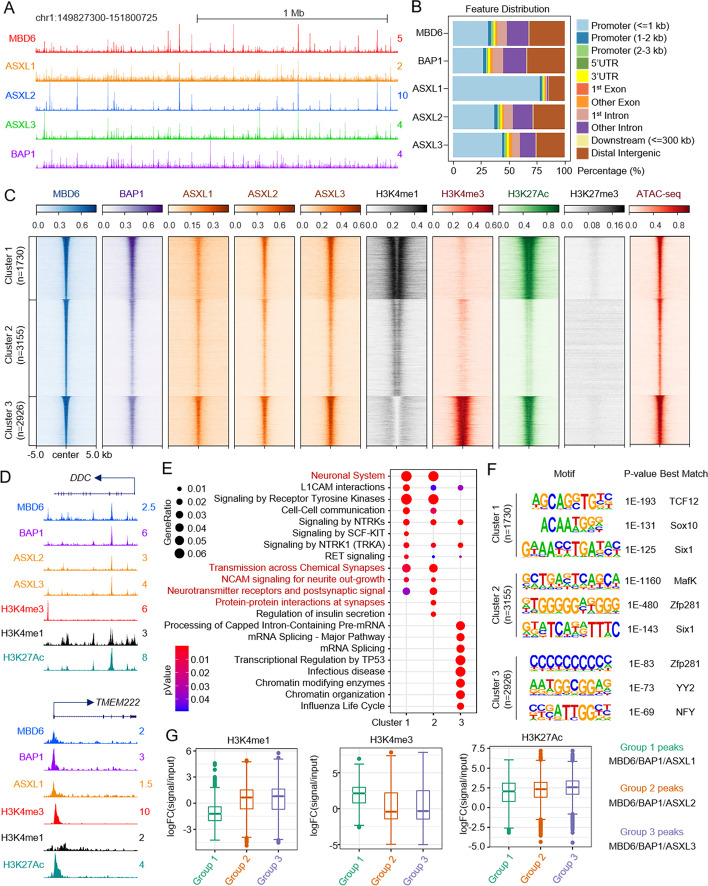
Fig. 5 Characterization of MBD6 occupancy in SCLC cells. A The representative tracks show chromatin occupancy of MBD6, ASXL1/2/3, and BAP1 binding sites in the human SCLC cell line NCI-H1963. B The bar plot shows the feature distribution of MBD6, ASXL1/2/3, and BAP1 peaks in NCI-H1963 cells. C Sorted and centered heatmaps generated from ChIP-seq and ATAC-seq data analyses show the occupancy of MBD6, ASXL1/2/3, BAP1, H3K27Ac, H3K4me1, H3K4me3, and H3K27me3 in NCI-H1963 cells. All signals were centered on MBD6 peaks, which were classified into three clusters, based on k-means clustering according to MBD6, H3K4me1, H3K4me3, and H3K27Ac ChIP-seq. D Representative tracks showing the occupancy MBD6, BAP1, ASXL1-3, and histone marks. E Pathway analysis was performed using ChIPseeker with genes nearest to MBD6 three cluster peaks defined in C. F Motif enrichment analysis of MBD6 three clusters’ peaks defined in C from NCI-H1963 cells. G The box plot shows the log2-fold-change of H3K4me1, H3K4me3, and H3K27Ac signals versus input at MBD6/BAP1/ASXL1, MBD6/BAP1/ASXL2, or MBD6/BAP1/ASXL3 co-occupied genomic regions
Fig. 5 Characterization of MBD6 occupancy in SCLC cells. A The representative tracks show chromatin occupancy of MBD6, ASXL1/2/3, and BAP1 binding sites in the human SCLC cell line NCI-H1963. B The bar plot shows the feature distribution of MBD6, ASXL1/2/3, and BAP1 peaks in NCI-H1963 cells. C Sorted and centered heatmaps generated from ChIP-seq and ATAC-seq data analyses show the occupancy of MBD6, ASXL1/2/3, BAP1, H3K27Ac, H3K4me1, H3K4me3, and H3K27me3 in NCI-H1963 cells. All signals were centered on MBD6 peaks, which were classified into three clusters, based on k-means clustering according to MBD6, H3K4me1, H3K4me3, and H3K27Ac ChIP-seq. D Representative tracks showing the occupancy MBD6, BAP1, ASXL1-3, and histone marks. E Pathway analysis was performed using ChIPseeker with genes nearest to MBD6 three cluster peaks defined in C. F Motif enrichment analysis of MBD6 three clusters’ peaks defined in C from NCI-H1963 cells. G The box plot shows the log2-fold-change of H3K4me1, H3K4me3, and H3K27Ac signals versus input at MBD6/BAP1/ASXL1, MBD6/BAP1/ASXL2, or MBD6/BAP1/ASXL3 co-occupied genomic regionsCC BY · PubMed Central
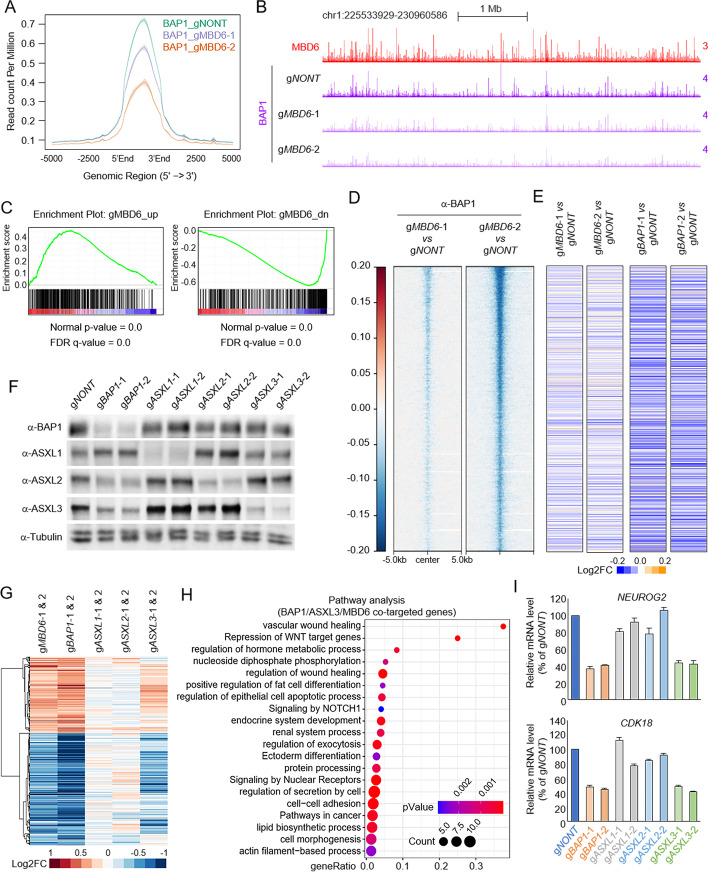
Fig. 6 MBD6 is essential for BAP1-dependent gene expression in SCLC. The average plot (A) and representative tracks (B) show the global reduction of BAP1 in MBD6-depleted SCLC cells by two distinct sgRNAs. C Gene Set Enrichment Analysis (GSEA) of BAP1 gene signature enrichment in MBD6-depleted conditions. D The log2 fold-change heatmap shows the reduction of BAP1 peaks at MBD6 loci in cells transduced with two distinct MBD6-specific sgRNAs. E The log2 fold-change heatmap shows the change of expression levels of genes nearest to MBD6 peaks after MBD6 (left two lanes) and BAP1 (right two lanes) depletion by CRISPR, n=2. F NCI-H1963 cells were transduced with either non-targeting sgRNA or two distinct sgRNA specific to ASXL1/2/3 or BAP1. The protein levels of BAP1, ASXL1, ASXL2, and ASXL3 were determined by western blot. Tubulin was used as an internal control, n = 2. G The log2 fold-change gene expression heatmap shows BAP1/MBD6 co-targeted genes in ASXL1/2/3-depleted conditions by CRISPR knockout, n=2. H Pathway analysis by Metascape of genes that are commonly downregulated upon BAP1, MBD6, or ASXL3 depletion in NCI-H1963 cells. I The mRNA levels of NEUROG2 and CDK18 were determined by real-time qPCR in NCI-H1963 cells transduced with either non-targeting sgRNA, two different BAP1-specific sgRNAs, or two different ASXL1/2/3 sgRNAs
Fig. 6 MBD6 is essential for BAP1-dependent gene expression in SCLC. The average plot (A) and representative tracks (B) show the global reduction of BAP1 in MBD6-depleted SCLC cells by two distinct sgRNAs. C Gene Set Enrichment Analysis (GSEA) of BAP1 gene signature enrichment in MBD6-depleted conditions. D The log2 fold-change heatmap shows the reduction of BAP1 peaks at MBD6 loci in cells transduced with two distinct MBD6-specific sgRNAs. E The log2 fold-change heatmap shows the change of expression levels of genes nearest to MBD6 peaks after MBD6 (left two lanes) and BAP1 (right two lanes) depletion by CRISPR, n=2. F NCI-H1963 cells were transduced with either non-targeting sgRNA or two distinct sgRNA specific to ASXL1/2/3 or BAP1. The protein levels of BAP1, ASXL1, ASXL2, and ASXL3 were determined by western blot. Tubulin was used as an internal control, n = 2. G The log2 fold-change gene expression heatmap shows BAP1/MBD6 co-targeted genes in ASXL1/2/3-depleted conditions by CRISPR knockout, n=2. H Pathway analysis by Metascape of genes that are commonly downregulated upon BAP1, MBD6, or ASXL3 depletion in NCI-H1963 cells. I The mRNA levels of NEUROG2 and CDK18 were determined by real-time qPCR in NCI-H1963 cells transduced with either non-targeting sgRNA, two different BAP1-specific sgRNAs, or two different ASXL1/2/3 sgRNAsCC BY · PubMed Central

Verification

Claims the paper makes

The claims and statistics of this paper haven’t been checked yet.

Run the check — free, no account needed. It reads the open-access text and checks the sources it cites.

A few free checks a day · papers already verified open instantly · results are public

Claims other papers make about this one

Each is checked against this paper’s own text: does it say what the citing paper says it does?

Self-check

Percentages, sums and reported differences re-computed from the paper’s own numbers.

The self-check needs the paper’s full text.

Citations

Cites

Show all 4 references

Research works printed but not linked: 42

  1. Plass C, Pfister SM, Lindroth AM, Bogatyrova O, Claus R, Lichter P. Mutations in regulators of the epigenome and their connections to global chromatin patterns in cancer. Nat Rev Genet. 2013;14:765–80. · DOI
  2. Morgan MA, Shilatifard A. Chromatin signatures of cancer. Genes Dev. 2015;29:238–49. · DOI
  3. Sharma S, Kelly TK, Jones PA. Epigenetics in cancer. Carcinogenesis. 2010;31:27–36. · DOI · Paper page
  4. Baylin SB, Jones PA. Epigenetic determinants of cancer. Cold Spring Harb Perspect Biol. 2016;8(9):a019505. · DOI · Paper page
  5. Jensen DE, Proctor M, Marquis ST, Gardner HP, Ha SI, Chodosh LA, et al. BAP1: a novel ubiquitin hydrolase which binds to the BRCA1 RING finger and enhances BRCA1-mediated cell growth suppression. Oncogene. 1998;16:1097–112. · DOI
  6. Scheuermann JC, de Ayala Alonso AG, Oktaba K, Ly-Hartig N, McGinty RK, Fraterman S, et al. Histone H2A deubiquitinase activity of the Polycomb repressive complex PR-DUB. Nature. 2010;465:243–7. · DOI · Paper page
  7. Kolovos P, Nishimura K, Sankar A, Sidoli S, Cloos PA, Helin K, et al. PR-DUB maintains the expression of critical genes through FOXK1/2- and ASXL1/2/3-dependent recruitment to chromatin and H2AK119ub1 deubiquitination. Genome Res. 2020;30:1119–30. · DOI
  8. Daou S, Hammond-Martel I, Mashtalir N, Barbour H, Gagnon J, Iannantuono NV, et al. The BAP1/ASXL2 histone H2A deubiquitinase complex regulates cell proliferation and is disrupted in cancer. J Biol Chem. 2015;290:28643–63. · DOI · Paper page
  9. Baymaz HI, Fournier A, Laget S, Ji Z, Jansen PW, Smits AH, et al. MBD5 and MBD6 interact with the human PR-DUB complex through their methyl-CpG-binding domain. Proteomics. 2014;14:2179–89. · DOI · Paper page
  10. Hauri S, Comoglio F, Seimiya M, Gerstung M, Glatter T, Hansen K, et al. A high-density map for navigating the human polycomb complexome. Cell Rep. 2016;17:583–95. · DOI
  11. Carbone M, Yang H, Pass HI, Krausz T, Testa JR, Gaudino G. BAP1 and cancer. Nat Rev Cancer. 2013;13:153–9. · DOI · Paper page
  12. Sahtoe DD, van Dijk WJ, Ekkebus R, Ovaa H, Sixma TK. BAP1/ASXL1 recruitment and activation for H2A deubiquitination. Nat Commun. 2016;7:10292. · DOI
  13. Wang L, Zhao Z, Ozark PA, Fantini D, Marshall SA, Rendleman EJ, et al. Resetting the epigenetic balance of Polycomb and COMPASS function at enhancers for cancer therapy. Nat Med. 2018;24:758–69. · DOI
  14. Szczepanski AP, Zhao Z, Sosnowski T, Goo YA, Bartom ET, Wang L. ASXL3 bridges BRD4 to BAP1 complex and governs enhancer activity in small cell lung cancer. Genome Med. 2020;12:63. · DOI
  15. Wang L, Birch NW, Zhao Z, Nestler CM, Kazmer A, Shilati A, et al. Epigenetic targeted therapy of stabilized BAP1 in ASXL1 gain-of-function mutated leukemia. Nat Cancer. 2021;2:515–26. · DOI
  16. Zhao Z, Szczepanski AP, Tsuboyama N, Abdala-Valencia H, Goo YA, Singer BD, et al. PAX9 determines epigenetic state transition and cell fate in cancer. Cancer Res. 2021;81:4696–708. · DOI
  17. Tsuboyama N, Wang R, Szczepanski AP, Chen H, Zhao Z, Shi L, et al. Therapeutic targeting of BAP1/ASXL3 sub-complex in ASCL1-dependent small cell lung cancer. Oncogene. 2022;41(15):2152–62. · DOI
  18. Qin J, Zhou Z, Chen W, Wang C, Zhang H, Ge G, et al. BAP1 promotes breast cancer cell proliferation and metastasis by deubiquitinating KLF5. Nat Commun. 2015;6:8471. · DOI
  19. Baas R, van der Wal FJ, Bleijerveld OB, van Attikum H, Sixma TK. Proteomic analysis identifies novel binding partners of BAP1. PLoS One. 2021;16:e0257688. · DOI
  20. Campagne A, Lee MK, Zielinski D, Michaud A, Le Corre S, Dingli F, et al. BAP1 complex promotes transcription by opposing PRC1-mediated H2A ubiquitylation. Nat Commun. 2019;10:348. · DOI
  21. Han A, Purwin TJ, Aplin AE. Roles of the BAP1 tumor suppressor in cell metabolism. Cancer Res. 2021;81:2807–14. · DOI
  22. Masclef L, Ahmed O, Estavoyer B, Larrivee B, Labrecque N, Nijnik A, et al. Roles and mechanisms of BAP1 deubiquitinase in tumor suppression. Cell Death Differ. 2021;28:606–25. · DOI
  23. White AE, Harper JW. Emerging anatomy of the BAP1 tumor suppressor system. Science. 2012;337:1463–4. · DOI
  24. Conway E, Rossi F, Fernandez-Perez D, Ponzo E, Ferrari KJ, Zanotti M, et al. BAP1 enhances Polycomb repression by counteracting widespread H2AK119ub1 deposition and chromatin condensation. Mol Cell. 2021;81:3526–3541.e3528. · DOI
  25. Fursova NA, Turberfield AH, Blackledge NP, Findlater EL, Lastuvkova A, Huseyin MK, et al. BAP1 constrains pervasive H2AK119ub1 to control the transcriptional potential of the genome. Genes Dev. 2021;35:749–70. · DOI
  26. Scheuermann JC, Alonso AGD, Oktaba K, Ly-Hartig N, McGinty RK, Fraterman S, et al. Histone H2A deubiquitinase activity of the Polycomb repressive complex PR-DUB. Nature. 2010;465:243–U138. · DOI · Paper page
  27. Balasubramani A, Larjo A, Bassein JA, Chang X, Hastie RB, Togher SM, et al. Cancer-associated ASXL1 mutations may act as gain-of-function mutations of the ASXL1-BAP1 complex. Nat Commun. 2015;6:7307. · DOI · Paper page
  28. Mirdita M, Schutze K, Moriwaki Y, Heo L, Ovchinnikov S, Steinegger M. ColabFold: making protein folding accessible to all. Nat Methods. 2022;19:679–+. · DOI · Paper page
  29. Guo Y, Yang H, Chen S, Zhang P, Li R, Nimer SD, et al. Reduced BAP1 activity prevents ASXL1 truncation-driven myeloid malignancy in vivo. Leukemia. 2018;32:1834–7. · DOI
  30. Shukla V, Rao M, Zhang HG, Beers J, Wangsa D, Wangsa D, et al. ASXL3 is a novel pluripotency factor in human respiratory epithelial cells and a potential therapeutic target in small cell lung cancer. Cancer Res. 2017;77:6267–81. · DOI
  31. Kim JH, Lee SY, Choi JE, Do SK, Lee JH, Hong MJ, et al. Polymorphism in ASCL1 target gene DDC is associated with clinical outcomes of small cell lung cancer patients. Thorac Cancer. 2020;11:19–28. · DOI
  32. Pozo K, Kollipara RK, Kelenis DP, Rodarte KE, Ullrich MS, Zhang X, et al. ASCL1, NKX2-1, and PROX1 co-regulate subtype-specific genes in small-cell lung cancer. iScience. 2021;24:102953. · DOI
  33. Dey A, Seshasayee D, Noubade R, French DM, Liu J, Chaurushiya MS, et al. Loss of the tumor suppressor BAP1 causes myeloid transformation. Science. 2012;337:1541–6. · DOI
  34. Bogdanovic O, Veenstra GJ. DNA methylation and methyl-CpG binding proteins: developmental requirements and function. Chromosoma. 2009;118:549–65. · DOI
  35. Mamdani H, Induru R, Jalal SI. Novel therapies in small cell lung cancer. Transl Lung Cancer Res. 2015;4:533–44.
  36. Wade PA. Methyl CpG binding proteins: coupling chromatin architecture to gene regulation. Oncogene. 2001;20:3166–73. · DOI
  37. Laget S, Joulie M, Le Masson F, Sasai N, Christians E, Pradhan S, et al. The human proteins MBD5 and MBD6 associate with heterochromatin but they do not bind methylated DNA. PLoS One. 2010;5:e11982. · DOI · Paper page
  38. Zeidler MP, Mlodzik M. six-banded, a novel Drosophila gene, is expressed in 6 segmental stripes during embryonic development and in the eye imaginal disc. Biol Chem. 1997;378:1119–24. · DOI
  39. Koemans TS, Kleefstra T, Chubak MC, Stone MH, Reijnders MRF, de Munnik S, et al. Functional convergence of histone methyltransferases EHMT1 and KMT2C involved in intellectual disability and autism spectrum disorder. PLoS Genet. 2017;13:e1006864. · DOI
  40. Sanchez R, Zhou MM. The PHD finger: a versatile epigenome reader. Trends Biochem Sci. 2011;36:364–72.
  41. Bonnet C, Ali Khan A, Bresso E, Vigouroux C, Beri M, Lejczak S, et al. Extended spectrum of MBD5 mutations in neurodevelopmental disorders. Eur J Hum Genet. 2013;21:1457–61. · DOI
  42. Zhao Z, Wang L. MBD5 and MBD6 stabilize the BAP1 complex and promote BAP1-dependent cancer. Datasets GSE196860: Gene Expression Omnibus; 2022. https://www.ncbi.nlm.nih.gov/geo/query/acc.cgi?acc=GSE196860.

Cited by

See all 21

Metadata

Authors
Tsuboyama, N., Szczepanski, A. P., Zhao, Z., & Wang, L.
Venue
Genome Biology
Published
2022-09-30
Volume
23
Issue
1
ISSN
1474-760X
Cited by
21
References
4
Language
en
Funders
  • American Cancer Society (RSG-22-039-01-DMC)
  • National Institute of General Medical Sciences (R35GM146979)
  • Lynn Sage Cancer Research Foundation

About these checks

Registry, retraction, Cites and statistics results are computed, not judged, with one exception: a printed reference that no index lists is read once by a model before it counts as a citation error. Claims are extracted by a model and kept only when their quote appears verbatim in the text; each cited source is then checked, with a model’s help, for whether it says what the claim relies on. Those verdicts can be wrong — read the claim’s quote and the cited source before relying on one.

Statistics and arithmetic are recomputed, not judged.

Confidence bands are shown only for fields calibrated on our annotated test set. None is calibrated yet, so no band is shown.

What counts as a claim ›How we measure confidence ›How we check this ›

Are you an author, or do you see a problem with this page? Request a review

How to cite

Cite CoChat for the checks on this page, and the paper for its own findings.

This page
CoChat. (2026). Citation check: MBD5 and MBD6 stabilize the BAP1 complex and promote BAP1-dependent cancer. https://app.cochat.ai/papers/10.1186/s13059-022-02776-x
The paper
Tsuboyama, N., Szczepanski, A. P., Zhao, Z., & Wang, L. (2022). MBD5 and MBD6 stabilize the BAP1 complex and promote BAP1-dependent cancer. Genome Biology. https://doi.org/10.1186/s13059-022-02776-x