

The DOI matches its Crossref record; 21 of the 21 references it cites were found in a registry or an index.
Peak calling by Sparse Enrichment Analysis for CUT&RUN chromatin profiling
Open accessAbstract
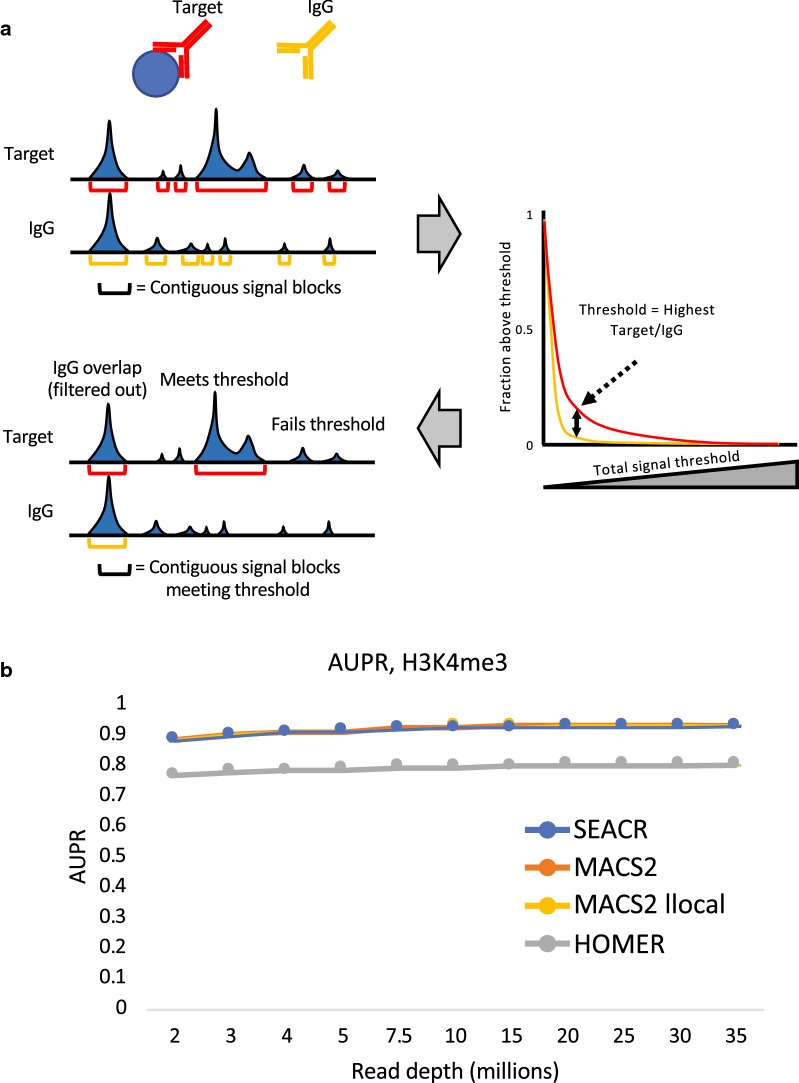
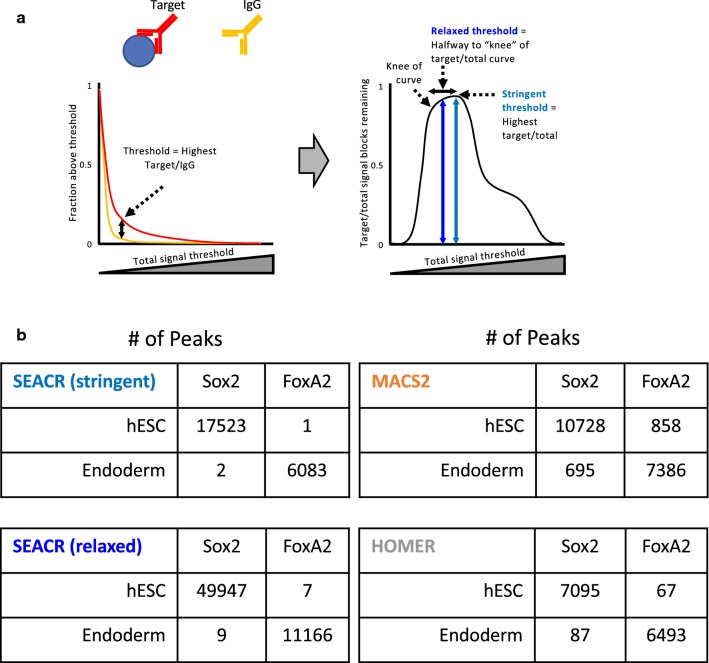
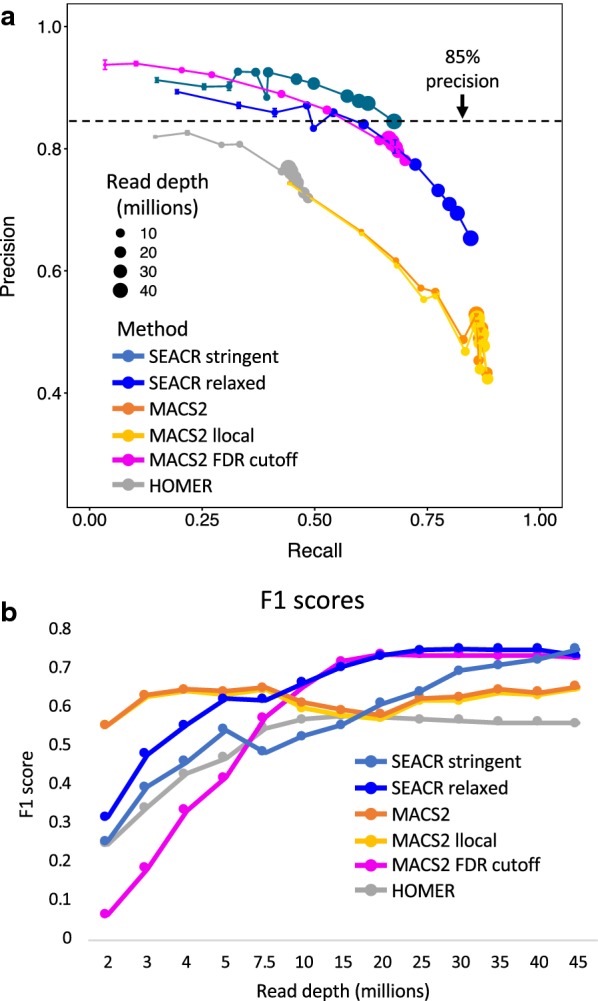
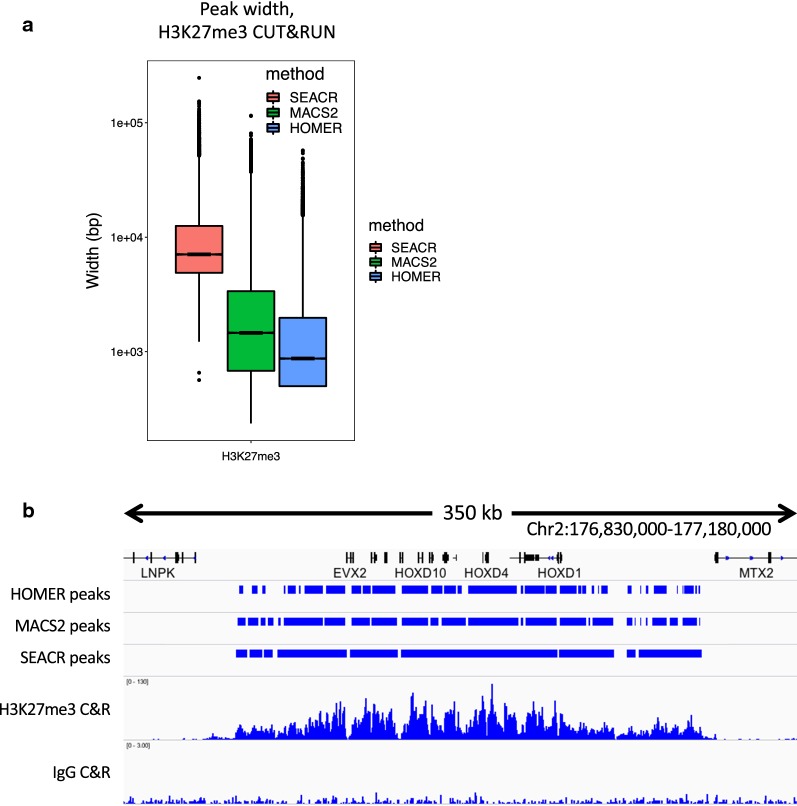
BACKGROUND: CUT&RUN is an efficient epigenome profiling method that identifies sites of DNA binding protein enrichment genome-wide with high signal to noise and low sequencing requirements. Currently, the analysis of CUT&RUN data is complicated by its exceptionally low background, which renders programs designed for analysis of ChIP-seq data vulnerable to oversensitivity in identifying sites of protein binding. RESULTS: Here we introduce Sparse Enrichment Analysis for CUT&RUN (SEACR), an analysis strategy that uses the global distribution of background signal to calibrate a simple threshold for peak calling. SEACR discriminates between true and false-positive peaks with near-perfect specificity from "gold standard" CUT&RUN datasets and efficiently identifies enriched regions for several different protein targets. We also introduce a web server ( http://seacr.fredhutch.org ) for plug-and-play analysis with SEACR that facilitates maximum accessibility across users of all skill levels. CONCLUSIONS: SEACR is a highly selective peak caller that definitively validates the accuracy of CUT&RUN for datasets with known true negatives. Its ease of use and performance in comparison with existing peak calling strategies make it an ideal choice for analyzing CUT&RUN data.
Overview
The claims and statistics of this paper haven’t been checked yet.
Run the check — free, no account needed. It reads the open-access text and checks the sources it cites.
Integrity signals
Registry
Cites
Statistics
Figures
Verification
Claims the paper makes
The claims and statistics of this paper haven’t been checked yet.
Run the check — free, no account needed. It reads the open-access text and checks the sources it cites.
Claims other papers make about this one
Each is checked against this paper’s own text: does it say what the citing paper says it does?
The cited source says what the claim attributes to it.
In the citing paper
“peaks were called using SEACR (94) with a peak threshold of 0.05 using spike in normalization performed using the Escherichia coli genome K12.”
From Synergy between regulatory elements can render cohesin dispensable for distal enhancer function (2026) · cites this paper as [94]
Self-check
Percentages, sums and reported differences re-computed from the paper’s own numbers.
The self-check needs the paper’s full text.
Citations
Cites
BEDTools: a flexible suite of utilities for comparing genomic features
Quinlan, A. R., & Hall, I. M. (2010) · Bioinformatics · doi:10.1093/bioinformatics/btq033 · Cited by 27,437
Model-based Analysis of ChIP-Seq (MACS)
Zhang, Y., Liu, T., Meyer, C. A., Eeckhoute, J., Johnson, D. S., Bernstein, B. E., Nusbaum, C., Myers, R. M., Brown, M., Li, W., et al. (2008) · Genome Biology · doi:10.1186/gb-2008-9-9-r137 · Cited by 18,386
An integrated encyclopedia of DNA elements in the human genome
The ENCODE Project Consortium (2012) · Nature · doi:10.1038/nature11247 · Cited by 18,072
Heinz, S., Benner, C., Spann, N., Bertolino, E., Lin, Y. C., Laslo, P., Cheng, J. X., Murre, C., Singh, H., & Glass, C. K. (2010) · Molecular Cell · doi:10.1016/j.molcel.2010.05.004 · Cited by 13,382
High-Resolution Profiling of Histone Methylations in the Human Genome
Barski, A., Cuddapah, S., Cui, K., Roh, T.-Y., Schones, D. E., Wang, Z., Wei, G., Chepelev, I., & Zhao, K. (2007) · Cell · doi:10.1016/j.cell.2007.05.009 · Cited by 6,845
Genome-Wide Mapping of in Vivo Protein-DNA Interactions
Johnson, D. S., Mortazavi, A., Myers, R. M., & Wold, B. (2007) · Science · doi:10.1126/science.1141319 · Cited by 2,927
CUT&Tag for efficient epigenomic profiling of small samples and single cells
Kaya-Okur, H. S., Wu, S. J., Codomo, C. A., Pledger, E. S., Bryson, T. D., Henikoff, J. G., Ahmad, K., & Henikoff, S. (2019) · Nature Communications · doi:10.1038/s41467-019-09982-5 · Cited by 2,187
Self-citationAn efficient targeted nuclease strategy for high-resolution mapping of DNA binding sites
Skene, P. J., & Henikoff, S. (2017) · eLife · doi:10.7554/elife.21856 · Cited by 1,737
Self-citationRobertson, G., Hirst, M., Bainbridge, M., Bilenky, M., Zhao, Y., Zeng, T., Euskirchen, G., Bernier, B., Varhol, R., Delaney, A., et al. (2007) · Nature Methods · doi:10.1038/nmeth1068 · Cited by 1,454
Targeted in situ genome-wide profiling with high efficiency for low cell numbers
Skene, P. J., Henikoff, J. G., & Henikoff, S. (2018) · Nature Protocols · doi:10.1038/nprot.2018.015 · Cited by 803
Self-citation
Cited by
Sorted by citations
Items 501–567 of 567
Additional file 1 of Dynamic chromatin regulatory programs during embryogenesis of hexaploid wheat
Zhao, L., Yang, Y., Chen, J., Lin, X., Zhang, H., Wang, H., Wang, H., Bie, X., Jiang, J., Feng, X., et al. (2023) · Figshare · doi:10.6084/m9.figshare.22611773
Additional file 1 of GoPeaks: histone modification peak calling for CUT&Tag
Yashar, W. M., Kong, G., VanCampen, J., Curtiss, B. M., Coleman, D. J., Carbone, L., Yardimci, G. G., Maxson, J. E., & Braun, T. P. (2022) · Figshare · doi:10.6084/m9.figshare.20226874
Boyd, J., Rodriguez, P., Schjerven, H., & Frietze, S. E. (2021) · Figshare · doi:10.6084/m9.figshare.16650584
Wu, X., Chen, M., Fan, R., Wang, H., Ma, R., Tang, X., Wang, H., Wei, W., Wong, J., Xu, G., et al. (2025) · bioRxiv (Cold Spring Harbor Laboratory) · doi:10.64898/2025.12.26.696560
Fan, X., Su, D., Lin, Z., Luo, L. G., Deng, E., Huang, Q., Xu, W., Guo, Z., & Zuo, Z. (2026) · Research Square · doi:10.21203/rs.3.rs-8125184/v1
Primate lineage specification requires suppression of Alu hypereditingPreprint
Park, E. J., Cui, Y., Levin-Ferreyra, F., Soriano, V. L., Wu, H., Lupión-Garcia, N., Sands, C. M., Pessina, P., Guerra, M. C., Botas, J., et al. (2026) · bioRxiv (Cold Spring Harbor Laboratory) · doi:10.64898/2026.01.14.699349
An AIB1 isoform rewires glucocorticoid receptor signaling to promote TNBC progression
Kiliti, A. J., Sharif, G. M., McNamara, M. E., Rahhal, R., Prewitt, S., Schmidt, M., Wu, C., Ma, J.-F., Glasgow, E., Wellstein, A., et al. (2026) · iScience · doi:10.1016/j.isci.2026.114768
Romero, M. A., Chien, P., Nicoletti, C., Liliom, H. L., Cox, G., Skuratovsky, E., Saleh, K. K., Gibbs, D., Gane, L., Hoang, D.-H., et al. (2026) · bioRxiv (Cold Spring Harbor Laboratory) · doi:10.64898/2026.01.23.701436
An H4K20me3-CTCF switch at stable TAD boundaries enforces reversible cell state transitionsPreprint
Atai, K., Mitra, M., Bohn, E., Hu, R., Corvalan, A. Z., Jelínek, D., Voisin, L., Ambrus, A., Sarathy, K., Sparks, W. M., et al. (2026) · bioRxiv (Cold Spring Harbor Laboratory) · doi:10.64898/2026.01.29.702647
BRD4 represses developmental and neuronal genes through interaction with PRC1.6Preprint
Boulet, F., Patel, M., Zanjani, Z. S., Andrés-Sánchez, N., Ijaz, A., Pal, D., Dubey, P., Murray, A., Nižetić, D., LeClaire, M. D., et al. (2026) · bioRxiv (Cold Spring Harbor Laboratory) · doi:10.64898/2026.01.31.702994
A transcriptional code controlling fluid shear stress-induced gene expressionPreprint
Fleisinger, L., Bruche, S., Lim, H., Rataj, A., Rodriguez‐Caro, H., Genovese, A. M. R., Vinayachandran, V., Nornes, S., Szumska, D., Gupta, D., et al. (2026) · bioRxiv (Cold Spring Harbor Laboratory) · doi:10.64898/2026.02.04.703710
MotifPeeker: benchmarking epigenomic profiling methods using motifs
Dash, H., Roberts, T., Weinert, M., & Skene, N. (2026) · Bioinformatics Advances · doi:10.1093/bioadv/vbag023
Mechanism of circZNF827-mediated transcriptional repression during neuronal differentiationPreprint
Zaporozhchenko, I. A., Hollensen, A. K., & Damgaard, C. K. (2026) · bioRxiv (Cold Spring Harbor Laboratory) · doi:10.64898/2026.02.17.706266
Zhou, M., Wang, K., Jin, Y., Liu, J., Xue, Y., Wang, Y., Jia, X., Liu, H., Wang, P., Li, Z., et al. (2026) · Journal of Orthopaedic Translation · doi:10.1016/j.jot.2026.101055
Kars, G., Becker, P. B., & Apostolou, Z. (2026) · Nucleic Acids Research · doi:10.1093/nar/gkag178
Berthelette, A., Newell, K., Phan, Q. M., Taniuchi, I., Kang, J., & Frascoli, M. (2026) · bioRxiv (Cold Spring Harbor Laboratory) · doi:10.64898/2026.03.02.708762
KMT2C and KMT2D amplify GRHL2-driven enhancer activationPreprint
Boileau, R. M., Chen, K. X., & Blelloch, R. H. (2026) · bioRxiv (Cold Spring Harbor Laboratory) · doi:10.64898/2026.03.10.710694
Cheng, T., Liu, X., Dong, Y., Tian, Y.-M., Xing, Y.-Y., Chen, C.-Y., Liu, C., Li, Y.-F., Huang, Y., Zhuo, D., et al. (2026) · eLife · doi:10.7554/elife.100200.2.sa0
Cheng, T., Liu, X., Dong, Y., Tian, Y.-M., Xing, Y.-Y., Chen, C.-Y., Liu, C., Li, Y.-F., Huang, Y., Zhuo, D., et al. (2026) · eLife · doi:10.7554/elife.100200.2
Singh, N., Batz, Z. A., Advani, J., English, M. A., Maddala, R., Rao, P. V., & Swaroop, A. (2026) · bioRxiv (Cold Spring Harbor Laboratory) · doi:10.64898/2026.03.12.711121
Liao, Z., Zhang, Q., Shimada, K., Nozawa, K., Tang, S., Ikawa, M., Monsivais, D., & Matzuk, M. M. (2026) · Proceedings of the National Academy of Sciences · doi:10.1073/pnas.2600071123
Epigenetic characterization of cellular pliancy in breast cancer
Benhassoun, R. (2024) · theses.fr (ABES) · doi:10.70675/0b1d39b2za3d7z4b26zb4b0zaafa77d5068a
Roulé, T., & Akizu, N. (2026) · bioRxiv (Cold Spring Harbor Laboratory) · doi:10.64898/2026.04.16.718722
Mechanisms controlling the deposition and dynamics of histone variant H2BEPreprint
Sangree, A. K., Feierman, E. R., Perez‐Tremble, R., & Korb, E. (2026) · bioRxiv (Cold Spring Harbor Laboratory) · doi:10.64898/2026.04.20.719605
Evidence for coordinate CTCF and histone H3.3 activities in K27M diffuse midline gliomas
Klein, R. H., Yee, J. Q., & Knoepfler, P. S. (2026) · Acta Neuropathologica Communications · doi:10.1186/s40478-026-02290-2
Feng, H., Ling, F., Xi, Z., Li, R., Lv, X., Guo, J., Su, L., Zhou, J., Zheng, J., Xing, F., et al. (2026) · Cancer Research · doi:10.1158/0008-5472.can-25-2437
Yuan, C., Wang, J., Wang, Z., Mao, P., Dong, P., Dong, J., Guo, L., Liu, K., Cui, L., Li, J., et al. (2026) · Free Radical Biology and Medicine · doi:10.1016/j.freeradbiomed.2026.05.293
ChromCall: assigning chromatin status to defined genomic regions using epigenomic profiling data
Wang, B., Al-Jabri, M., Udayaraja, G. K., Droop, A., & Stead, L. F. (2026) · Bioinformatics · doi:10.1093/bioinformatics/btag336
Atg8 orchestrates stress-responsive chromatin programs across immunity and metabolismPreprint
Kelly, K., Ramesh, N. A., Ranganathan, S., Madan, A., Marschall, S., Unckless, R. L., & Rajan, A. (2026) · bioRxiv (Cold Spring Harbor Laboratory) · doi:10.64898/2026.05.22.727304
Graff, S., Stransky, S., Kraz, I., Duraivelan, K., Poppel, A. J., Chatoff, A. G., Snyder, N. W., Garforth, S., Shechter, D., Maianti, J. P., et al. (2026) · bioRxiv (Cold Spring Harbor Laboratory) · doi:10.64898/2026.05.29.728167
Murray, J. D., Ray, A., Kasomva, K., Steen, E. A., Stelloh, C. T., Pulakanti, K., Doerfler, P. A., Sarkar, N. D., Qiu, Q., Liu, Y., et al. (2026) · Cell Reports Methods · doi:10.1016/j.crmeth.2026.101499
Protocol for genomic mapping of chromatin targets using high-throughput CUT&RUN
Kotapalli, V., Iakova, P. A., Lu, Y., & Jain, A. K. (2026) · STAR Protocols · doi:10.1016/j.xpro.2026.104631
Ruiz‐Pérez, S., Du, Q., Biran, A., Groth, A., & Alcaraz, N. (2026) · bioRxiv (Cold Spring Harbor Laboratory) · doi:10.64898/2026.06.21.732899
DNA-damage dependent interaction of Orc6 to SMARCA1 in S-phase modulates chromatin remodeling
Liu, D., Mishra, M., Wang, Y., Oishi, H. Z., Mirza, A., Mohajir, I. F., Chetlangia, N., Sonalkar, J., Lin, Y.-C., Prasanth, K. V., et al. (2026) · Nucleic Acids Research · doi:10.1093/nar/gkag582
CUT&Tag Epigenomic Profiling of Biosynthetic Gene Clusters in Arabidopsis thaliana
Taylor, J., Reynolds, K., & Nützmann, H. (2026) · Methods in molecular biology · doi:10.1007/978-1-0716-5384-5_12
H4K16ac contributes to chromatin compartment reorganization during mitotic and meiotic transitions
Zhao, Y., Tripathy, B. K., Shvedunova, M., Arrigoni, L., Katarzyna, S., Seyfferth, J., Greene, J. A. M., & Akhtar, A. (2026) · Cell Reports · doi:10.1016/j.celrep.2026.117639
eLife Assessment: Impacts of DNA methylation on H2A.Z deposition and nucleosome stability
Zilberman, D. (2026) · eLife · doi:10.7554/elife.109762.3.sa0
Author response: Impacts of DNA methylation on H2A.Z deposition and nucleosome stability
Shih, R. M., Arimura, Y., Konishi, H., & Funabiki, H. (2026) · eLife · doi:10.7554/elife.109762.3.sa4
CDK4/6 inhibition induces a senescence-associated secretory phenotype via delayed NF-κB activation
Yeung, J. L.-H., Rendleman, J., Westcott, L. A., Ou, A., Pressler, M., Pagane, N., Duba, I., Hosuru, R., Tumenbayar, B., & Risca, V. I. (2026) · Life Science Alliance · doi:10.26508/lsa.202603790
MEN1 deficiency creates a selenite-dependent switch in ferroptosisPreprint
Low, R. R. J., Parnandi, N., Idilli, A. I., Gjelaj, E., Subtil, F. T., Segura‐Bayona, S., MacRae, J. I., & Boulton, S. J. (2026) · bioRxiv (Cold Spring Harbor Laboratory) · doi:10.64898/2026.07.16.738891
Li, D., Wuerzberger‐Davis, S. M., Chen, Y., Phan, F. P., Yu, M., Lisiero, D. N., Aguilar, C. C., Cleven, T., Tejera, M. M., Khatri, P., et al. (2026) · The EMBO Journal · doi:10.1038/s44318-026-00875-0
TRF2 couples muscle stem cell identity to regenerative repair
Lee, J., Nakka, K. K., Calhoun, R. P., Hachmer, S., Gupta, A., Arezza, E., Megeney, L. A., Seale, P., Greenberg, R. A., Dilworth, F. J., et al. (2026) · Science Advances · doi:10.1126/sciadv.aei7316
Hartge, M. K., Hernández, N. P., Pavlik, T., Polakova, N., Schönauer, E., Huber, J., Striedner, Y., Mair, T., Tiemann‐Boege, I., Weissensteiner, M. H., et al. (2026) · bioRxiv (Cold Spring Harbor Laboratory) · doi:10.64898/2026.07.31.742039
Jones, S. G., Raun, N., Blackwood, C., Miandashti, N., Bleeker, S. C., Henn, A. L., & Kramer, J. M. (2026) · Genetics · doi:10.1093/genetics/iyag207
Silvane, L., Ζελένκα, Τ., Talada, D. P., Cismasiu, V. B., Islam, S., Singh, R. P., Ngove, Z., Chakraborty, S., Hall, M. S., Blauvelt, J. L., et al. (2026) · bioRxiv (Cold Spring Harbor Laboratory) · doi:10.64898/2026.08.03.742578
Sphingosine kinase 2 regulates adipocyte browning and whole-body metabolism
Brown, R. D. R., Weigel, C., Vijayan, Y., Tyc, K. M., Carter, C. R., Green, C. D., & Spiegel, S. (2026) · Science Advances · doi:10.1126/sciadv.aec7066
Cortes-Silva, N., Banerjee, S., Amarillo, K. D., Peddibhotla, S., Natividad, I. M., Chopard, B., Geyer, C. B., Young, J. M., Brahma, S., & Schroeder, C. M. (2026) · bioRxiv (Cold Spring Harbor Laboratory) · doi:10.64898/2026.08.21.746286
Wani, S. A., & Wasylishen, A. R. (2026) · Methods in molecular biology · doi:10.1007/978-1-0716-5072-1_8
Targeting of the oncogenic fusion EWSR1-FLI1 in Ewing sarcoma by CRISPR/dCas9 silencers
Taifour, S., Wong, C.-W., Wallis, C., Wang, E., Tie, A. W. J., Woodward, E., Waryah, C. B., Hosseinpour, M., Lam, D., Lister, R., et al. (2026) · Molecular Therapy · doi:10.1016/j.ymthe.2026.08.042
A Microglial Regulatory Program Linked to Neuropsychiatric DisordersPreprint
Tränkner, D., Johnson, A. P., Williams, M. E., & Rothenfluh, A. (2026) · bioRxiv (Cold Spring Harbor Laboratory) · doi:10.64898/2026.08.27.747643
Interferons and STAT1 dynamically modulate integrated stress response outcomes in CD8 T cellsPreprint
Philips, R. L., Yu, K., Liao, Y.-C., Jung, S., Jiang, K., Kanno, Y., Randazzo, D., Oakes, S. A., & O’Shea, J. J. (2026) · Research Square · doi:10.21203/rs.3.rs-10692330/v1
Rizk, J. G., Ghaibour, K. C., Souali‐Crespo, S., Calvano, E., Bilger, A., Jacobs, H., Messaddeq, N., Cai, Q., Grandgirard, E., Sahu, R., et al. (2026) · Science Advances · doi:10.1126/sciadv.aec8073
Qian, Q., Xu, Y., & Wei, L. (2026) · Acta Biochimica et Biophysica Sinica · doi:10.3724/abbs.2026165
3D chromatin remodeling during domestication defines novel targets for crop improvement
Huang, X., Peng, Y., Hu, X., Wang, Y., Zhang, Z., Huang, X., Luo, X., Zhang, S., Zhao, Z., Farmer, E. E., et al. (2026) · Cell · doi:10.1016/j.cell.2026.08.038
FFPE-CUTAC: A Single Assay, Multiple LayersPreprint
Niu, Y., Xu, Q., Mak, C. Y., Xu, Y., Parmar, A., Zevin, A., Khyzha, N., Paranal, R., Holland, E., Ahmad, K., et al. (2026) · bioRxiv (Cold Spring Harbor Laboratory) · doi:10.64898/2026.09.21.753320
Self-citationTargeting ZMYND8 unleashes IL-2 signalling to override T cell exhaustion
Wang, Y., Shi, H., Chapman, N. M., Anil, K. C., Sun, R., Song, H., Meng, X., Sun, X., & Chi, H. (2026) · Nature · doi:10.1038/s41586-026-11059-5
Manzini, V., Nisio, E. D., Piana, A., Perticaroli, V., Asteriti, I. A., Polverino, F., Negri, R., & Licursi, V. (2026) · International Journal of Molecular Sciences · doi:10.3390/ijms27198774
Kita, K., Masayasu, S. E. G. A., Uchida, Y., Chiba, T., Matsushima, T., & Asahara, H. (2026) · STAR Protocols · doi:10.1016/j.xpro.2026.104889
Eghbali, A., Säflund, M., Askari, M., Abdi, M. M., Farrants, A. Ö., Yu, T., & Özata, D. M. (2026) · bioRxiv (Cold Spring Harbor Laboratory) · doi:10.64898/2026.10.07.757370
Characterization of an immunodeficiency-associated EZH2 variant
Santos, F. P. D. L., Beck, L., DeCurtis, E., Griffin, A. M., Balas, M. M., Marchioni, C. R., Kumanovics, A., Taylor, M. R. G., Jordan, K. R., Kirkpatrick, C. H., et al. (2026) · NAR Molecular Medicine · doi:10.1093/narmme/ugag045
黄伟伟, Yu, C., Wang, Y., Sun, N., Wang, L., Ren, J., Xu, Y., Guo, X., Li, X., Mao, Y., et al. (2026) · Nature Metabolism · doi:10.1038/s42255-026-01625-6
Epigenetic Analysis in Ewing Sarcoma
Urzì, O., Stelzer, T., Sims, J., & Tomazou, E. M. (2026) · Methods in molecular biology · doi:10.1007/978-1-0716-5587-0_28
Mahesh, A., Inayatullah, M., Terp, M. G., Zhang, Z., Mariasoosai, C., Larsen, M. R., Alves, C. M. L., Gammelgaard, O. L., Ditzel, H. J., & Tiwari, V. K. (2026) · The EMBO Journal · doi:10.1038/s44318-026-00933-7
Metadata
- Authors
- Meers, M. P., Tenenbaum, D., & Henikoff, S.
- Affiliations
- Fred Hutch Cancer Center (US)
- Howard Hughes Medical Institute (US)
- Corresponding author
- Henikoff, Steven
- Venue
- Epigenetics & Chromatin
- Published
- 2019-07-12
- Volume
- 12
- Issue
- 1
- Pages
- 42-42
- ISSN
- 1756-8935 (ISSN-L)
- PMC
- PMC6624997
- OpenAlex
- W2958184371
- Cited by
- 556
- References
- 21
- Citations by year
- 2026: 86 · 2025: 123 · 2024: 126 · 2023: 95 · 2022: 65 · 2021: 44 · 2020: 16
- FWCI
- 10.34
- Type
- journal article
- Language
- en
- Open access
- gold
- doi.org
- Locations
- Epigenetics & Chromatin (publishedVersion, cc-by)
- PubMed Central (publishedVersion, cc-by)
- PubMed (publishedVersion)
- DOAJ (DOAJ: Directory of Open Access Journals) (submittedVersion, cc-by-sa)
- Funders
- Howard Hughes Medical Institute (Henikoff)
- National Human Genome Research Institute (1R01HG010492)
- Topics
- Life Sciences › Biochemistry, Genetics and Molecular Biology › Molecular Biology › Genomics and Chromatin Dynamics
- Life Sciences › Biochemistry, Genetics and Molecular Biology › Molecular Biology › Epigenetics and DNA Methylation
- Life Sciences › Biochemistry, Genetics and Molecular Biology › Molecular Biology › Chromatin Remodeling and Cancer
- Keywords
- peak calling, CUT&RUN, chromatin profiling, protein-DNA binding sites, epigenetic profiling, web server
- MeSH terms
- Algorithms, Animals, Binding Sites, Chromatin, DNA-Binding Proteins, Humans, Protein Binding, Genome, Sequence Analysis, DNA, Epigenesis, Genetic, Chromatin Immunoprecipitation, Epigenomics
About these checks
Registry, retraction, Cites and statistics results are computed, not judged, with one exception: a printed reference that no index lists is read once by a model before it counts as a citation error. Claims are extracted by a model and kept only when their quote appears verbatim in the text; each cited source is then checked, with a model’s help, for whether it says what the claim relies on. Those verdicts can be wrong — read the claim’s quote and the cited source before relying on one.
Statistics and arithmetic are recomputed, not judged.
Confidence bands are shown only for fields calibrated on our annotated test set. None is calibrated yet, so no band is shown.
What counts as a claim ›How we measure confidence ›How we check this ›
Are you an author, or do you see a problem with this page? Request a review
