

The DOI matches its Crossref record; 88 of the 89 references it cites were found in a registry or an index, and 1 are not checked yet.
A bioinformatic framework for immune repertoire diversity profiling enables detection of immunological status
Open accessAbstract
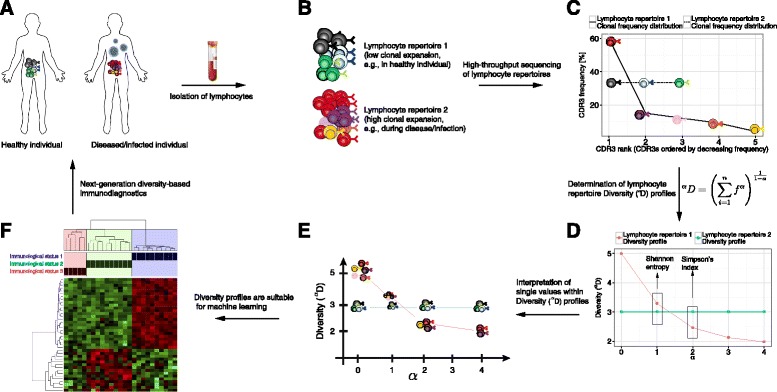
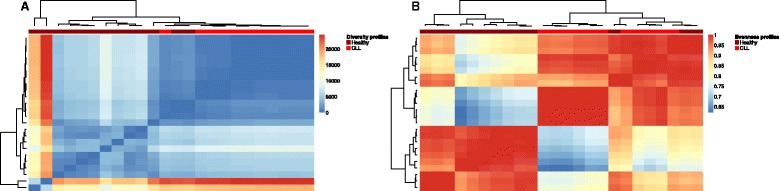
BACKGROUND: Lymphocyte receptor repertoires are continually shaped throughout the lifetime of an individual in response to environmental and pathogenic exposure. Thus, they may serve as a fingerprint of an individual's ongoing immunological status (e.g., healthy, infected, vaccinated), with far-reaching implications for immunodiagnostics applications. The advent of high-throughput immune repertoire sequencing now enables the interrogation of immune repertoire diversity in an unprecedented and quantitative manner. However, steadily increasing sequencing depth has revealed that immune repertoires vary greatly among individuals in their composition; correspondingly, it has been reported that there are few shared sequences indicative of immunological status ('public clones'). Disconcertingly, this means that the wealth of information gained from repertoire sequencing remains largely unused for determining the current status of immune responses, thereby hampering the implementation of immune-repertoire-based diagnostics. METHODS: Here, we introduce a bioinformatics repertoire-profiling framework that possesses the advantage of capturing the diversity and distribution of entire immune repertoires, as opposed to singular public clones. The framework relies on Hill-based diversity profiles composed of a continuum of single diversity indices, which enable the quantification of the extent of immunological information contained in immune repertoires. RESULTS: We coupled diversity profiles with unsupervised (hierarchical clustering) and supervised (support vector machine and feature selection) machine learning approaches in order to correlate patients' immunological statuses with their B- and T-cell repertoire data. We could predict with high accuracy (greater than or equal to 80 %) a wide range of immunological statuses such as healthy, transplantation recipient, and lymphoid cancer, suggesting as a proof of principle that diversity profiling can recover a large amount of immunodiagnostic fingerprints from immune repertoire data. Our framework is highly scalable as it easily allowed for the analysis of 1000 simulated immune repertoires; this exceeds the size of published immune repertoire datasets by one to two orders of magnitude. CONCLUSIONS: Our framework offers the possibility to advance immune-repertoire-based fingerprinting, which may in the future enable a systems immunogenomics approach for vaccine profiling and the accurate and early detection of disease and infection.
Overview
The claims and statistics of this paper haven’t been checked yet.
Run the check — free, no account needed. It reads the open-access text and checks the sources it cites.
Integrity signals
Registry
Cites
Statistics
Figures
Verification
Claims the paper makes
The claims and statistics of this paper haven’t been checked yet.
Run the check — free, no account needed. It reads the open-access text and checks the sources it cites.
Claims other papers make about this one
Each is checked against this paper’s own text: does it say what the citing paper says it does?
In the citing paper
“It was demonstrated that statistical classifiers can identify immune profiles of patients with chronic lymphocytic leukemia [220], multiple sclerosis [221] or influenza [222] from NGS data alone.”
From Computational approaches to therapeutic antibody design: established methods and emerging trends (2020) · cites this paper as [220]
Self-check
Percentages, sums and reported differences re-computed from the paper’s own numbers.
The self-check needs the paper’s full text.
Citations
Cites
R: A Language and Environment for Statistical Computing
R Core Team (2000) · doi:10.32614/r.manuals · Cited by 355,893
A Mathematical Theory of Communication
Shannon, C. E. (1948) · Bell System Technical Journal · doi:10.1002/j.1538-7305.1948.tb01338.x · Cited by 88,486
A Mathematical Theory of Communication
Shannon, C. E. (1948) · The MIT Press eBooks · doi:10.1002/j.1538-7305.1948.tb00917.x · Cited by 50,387
A mathematical theory of communication
Hockett, C. F., Shannon, C., & Weaver, W. (1948) · MOCO · doi:10.1145/584091.584093 · Cited by 30,543
Simpson, E. (1949) · Nature · doi:10.1038/163688a0 · Cited by 14,809
Gotelli, N., & Colwell, R. K. (2001) · Ecology Letters · doi:10.1046/j.1461-0248.2001.00230.x · Cited by 6,529
Diversity and Evenness: A Unifying Notation and Its Consequences
Hill, M. (1973) · Ecology · doi:10.2307/1934352 · Cited by 6,486
Jost, L. (2006) · Oikos · doi:10.1111/j.2006.0030-1299.14714.x · Cited by 4,669
On Measures of Entropy and Information
Rényi, A. (1961) · Project Euclid (Cornell University) · Cited by 4,031
Cellular and Molecular Immunology
Abbas, A. K., Lichtman, A. H., & Pillai, S. S. (1994) · Cited by 3,571
Research works printed but not linked: 4
- Janeway C, Shlomchik MJ, Walport M. Immunobiology. 6th ed. New York: Garland Science; 2004.
- Evert S, Baroni M. zipfR: Word frequency distributions in R. In: Proceedings of the 45th Annual Meeting of the Association for Computational Linguistics, Posters and Demonstrations Sessions. Prague, Czech Republic: Association for Computational Linguistics; 2007. p. 29–32.
- de Vries A, Ripley BD. Ggdendro: tools for extracting dendrogram and tree diagram plot data for use with ggplot. 2013.
- Galili T. Dendextend: extending R’s dendrogram functionality. 2014.
Cited by
Sorted by citations
Items 101–187 of 187
Rawat, P., Shapiro, M. R., Peters, L. D., Widrich, M., Mayer-Blackwell, K., Motwani, K., Pavlović, M., al Hajj, G., Posgai, A. L., Kanduri, C., et al. (2026) · Science Advances · doi:10.1126/sciadv.adx7448 · Cited by 21
IgM Antibody Repertoire Fingerprints in Mice Are Personalized but Robust to Viral Infection Status
Yermanos, A., Kräutler, N. J., Pedrioli, A., Menzel, U., Greiff, V., Stadler, T., Oxenius, A., & Reddy, S. T. (2020) · Frontiers in Cellular and Infection Microbiology · doi:10.3389/fcimb.2020.00254 · Cited by 10
Unraveling the Transcriptomic Signatures of Homologous Recombination Deficiency in Ovarian Cancers
Lee, J.-J., Kang, H. J., Kim, S. S., Charton, C., Kim, J., & Lee, J. (2022) · Advanced Biology · doi:10.1002/adbi.202200060 · Cited by 10
Profiling Virus-Specific Tcf1+ T Cell Repertoires During Acute and Chronic Viral Infection
Yermanos, A., Sandu, I., Pedrioli, A., Borsa, M., Wagen, F., Oetiker, N., Welten, S. P. M., Pallmer, K., Reddy, S. T., & Oxenius, A. (2020) · Frontiers in Immunology · doi:10.3389/fimmu.2020.00986 · Cited by 10
Individualized VDJ recombination predisposes the available Ig sequence spacePreprint
Slabodkin, A., Chernigovskaya, M., Mikocziova, I., Akbar, R., Scheffer, L., Pavlović, M., Bashour, H., Snapkov, I., Mehta, B. B., Weber, C. R., et al. (2021) · bioRxiv (Cold Spring Harbor Laboratory) · doi:10.1101/2021.04.19.440409 · Cited by 11
Rawat, P., Shapiro, M. R., Peters, L. D., Widrich, M., Mayer-Blackwell, K., Motwani, K., Pavlović, M., Hajj, G. S. A., Posgai, A. L., Kanduri, C., et al. (2024) · medRxiv · doi:10.1101/2024.12.10.24318751 · Cited by 10
Cullen, J. N., Martin, J., Vilella, A. J., Treeful, A. E., Sargan, D. R., Bradley, A., & Friedenberg, S. G. (2022) · PLoS ONE · doi:10.1371/journal.pone.0270710 · Cited by 9
Khavrutskii, I. V., Chaudhury, S., Stronsky, S. M., Lee, D. W., Benko, J. G., Wallqvist, A., Bavari, S., & Cooper, C. L. (2017) · Frontiers in Immunology · doi:10.3389/fimmu.2017.00910 · Cited by 9
A Precise Bare Simulation Approach to the Minimization of Some Distances. I. Foundations
Broniatowski, M., & Stummer, W. (2022) · IEEE Transactions on Information Theory · doi:10.1109/tit.2022.3215496 · Cited by 9
An Analysis of the Effects of Spaceflight and Vaccination on Antibody Repertoire Diversity
Rettig, T. A., Tan, J. B. C., Nishiyama, N. C., Chapes, S. K., & Pecaut, M. J. (2021) · ImmunoHorizons · doi:10.4049/immunohorizons.2100056 · Cited by 9
Høye, E., Dagenborg, V. J., Torgunrud, A., Lund‐Andersen, C., Fretland, Å. A., Lorenz, S., Edwin, B., Hovig, E. J., Fromm, B., Inderberg, E. M., et al. (2022) · GigaScience · doi:10.1093/gigascience/giad032 · Cited by 7
Pavlova, A. V., Zvyagin, I. V., & Shugay, M. (2024) · Frontiers in Immunology · doi:10.3389/fimmu.2024.1321603 · Cited by 8
Ree, A. H., Høye, E., Esbensen, Y., Beitnes, A.-C. R., Negård, A., Bernklev, L., Tetlie, L. K., Fretland, Å. A., Hamre, H. M., Kersten, C., et al. (2024) · OncoImmunology · doi:10.1080/2162402x.2024.2372886 · Cited by 7
AIRRscape: An interactive tool for exploring B-cell receptor repertoires and antibody responses
Waltari, E., Nafees, S., Wong, J., McCutcheon, K. M., & Pak, J. E. (2022) · PLoS Computational Biology · doi:10.1371/journal.pcbi.1010052 · Cited by 7
Frimpong, A., Ofori, M. F., Degoot, A., Kusi, K. A., Buri, G., Quartey, J., Baafour, E. K., Nguyen, N., & Ndifon, W. O. (2022) · Frontiers in Immunology · doi:10.3389/fimmu.2022.971392 · Cited by 7
Rubio, T., Chernigovskaya, M., Marquez, S., Martí, C., Izquierdo‐Altarejos, P., Urios, A., Montoliu, C., Felipo, V., Conesa, A., Greiff, V., et al. (2022) · ImmunoInformatics · doi:10.1016/j.immuno.2022.100012 · Cited by 6
Choudhury, J., & Ashraf, F. B. (2022) · JMIR Bioinformatics and Biotechnology · doi:10.2196/30890 · Cited by 8
Reactivity Graph Yields Interpretable IgM Repertoire Signatures as Potential Tumor Biomarkers
Ferdinandov, D., Kostov, V., Hadzhieva, M., Shivarov, V. S., Petrov, P. V., Bussarsky, A., & Pashov, A. D. (2023) · International Journal of Molecular Sciences · doi:10.3390/ijms24032597 · Cited by 6
The prevalence of IgG antibodies against milk and milk antigens in patients with multiple sclerosis
Chunder, R., Heider, T., & Küerten, S. (2023) · Frontiers in Immunology · doi:10.3389/fimmu.2023.1202006 · Cited by 8
Yermanos, A., Dounas, A., Greiff, V., Stadler, T., Oxenius, A., & Reddy, S. T. (2020) · Immunogenetics · doi:10.1007/s00251-020-01164-8 · Cited by 7
Alon, U. S., Mokryn, O., & Hershberg, U. (2021) · Frontiers in Immunology · doi:10.3389/fimmu.2021.642673 · Cited by 6
Huang, C., Chang, Y., Lin, C., Wang, W., Kuan, H.-C., Hsieh, Y., Wang, Y., Yang, C., Chiu, J.-Y., Tsai, S., et al. (2017) · Frontiers in Immunology · doi:10.3389/fimmu.2017.01726 · Cited by 6
Kanduri, C., Scheffer, L., Pavlović, M., Rand, K. D., Chernigovskaya, M., Pirvandy, O., Yaari, G., Greiff, V., & Sandve, G. K. (2022) · GigaScience · doi:10.1093/gigascience/giad074 · Cited by 5
Campian, J. L., Le, S. B., Ghiaseddin, A. P., Butt, O. H., Manektalia, H., Chen, D., Xu, Y., Liu, J., Rahman, M., Thai, N., et al. (2026) · Nature Communications · doi:10.1038/s41467-026-69522-w · Cited by 5
Lu, B., Zhang, Y., Wang, J., Yang, D., Liu, M., Ma, L., Yi, W., Liang, Y., Xu, Y., Fan, H., et al. (2024) · Mucosal Immunology · doi:10.1016/j.mucimm.2024.07.005 · Cited by 4
Annotation of gene loci and analysis of expression diversity in sheep immunoglobulin
Wu, M., Chen, F., Tang, X., Li, J., Zhao, H., & Zhang, Y. (2025) · Frontiers in Immunology · doi:10.3389/fimmu.2025.1643380 · Cited by 4
Systematic evaluation of B-cell clonal family inference approaches
Balashova, D., van Schaik, B. D. C., Stratigopoulou, M., Guikema, J. E. J., Caniels, T. G., Claireaux, M. A. F., van Gils, M. J., Musters, A., Anang, D. C., de Vries, N., et al. (2024) · BMC Immunology · doi:10.1186/s12865-024-00600-8 · Cited by 4
Struggle within: evolution and ecology of somatic cell populations
Świątczak, B. (2021) · Cellular and Molecular Life Sciences · doi:10.1007/s00018-021-03931-6 · Cited by 4
Csepregi, L., Hoehn, K. B., Neumeier, D., Taft, J. M., Friedensohn, S., Weber, C. R., Kummer, A., Sesterhenn, F., Correia, B. E., & Reddy, S. T. (2024) · eLife · doi:10.7554/elife.92718 · Cited by 7
Decoding Immuno-Competence: A Novel Analysis of Complete Blood Cell Count Data in COVID-19 Outcomes
Kempaiah, P. M., Libertin, C. R., Chitale, R. A., Naeyma, I., Pleqi, V., Sheele, J. M., Iandiorio, M. J., Hoogesteijn, A. L., Caulfield, T. R., & Rivas, A. L. (2024) · Biomedicines · doi:10.3390/biomedicines12040871 · Cited by 5
The expanding role of systems immunology in decoding the T cell receptor repertoire
Venturi, V., & Thomas, P. G. (2018) · Current Opinion in Systems Biology · doi:10.1016/j.coisb.2018.09.005 · Cited by 4
Yadav, A. J., Bhagat, K., Sharma, A., & Padhi, A. K. (2025) · Advances in protein chemistry and structural biology · doi:10.1016/bs.apcsb.2024.10.011 · Cited by 3
DIS3 licenses B cells for plasma cell differentiation in humans
Miglierina, E., Bouder, J., Ordanoska, D., Pineau, M., Léonard, S., Schavgoulidze, A., Quéré, G., Goff, M. L., Bouchet, M., Genebrier, S., et al. (2025) · Cellular and Molecular Immunology · doi:10.1038/s41423-025-01369-5 · Cited by 3
Shared bias in H chain V-J pairing in naive and memory B cells
Levi, R., Dvorkin, S., & Louzoun, Y. (2023) · Frontiers in Immunology · doi:10.3389/fimmu.2023.1166116 · Cited by 3
Cracking the code of adaptive immunity: The role of computational tools
Vegesana, K., & Thomas, P. G. (2024) · Cell Systems · doi:10.1016/j.cels.2024.11.009 · Cited by 3
Kremlyakova, Y., Vlasova, E., Luppov, D. V., & Shugay, M. (2025) · Journal of Molecular Biology · doi:10.1016/j.jmb.2025.169205 · Cited by 3
Heather, J. M., Kim, D. W., Sepulveda, S. M., Seventer, E. E. V., Fish, M. G., Corcoran, R. B., Hacohen, N., Hong, T. S., & Cobbold, M. (2025) · Clinical & Experimental Immunology · doi:10.1093/cei/uxaf040 · Cited by 4
Dynamic kernel matching for non-conforming data: A case study of T cell receptor datasets
Ostmeyer, J., Cowell, L. G., & Christley, S. (2023) · PLoS ONE · doi:10.1371/journal.pone.0265313 · Cited by 4
Zhu, Y., Tang, H., Xie, W., Chen, S., Zeng, H., Lan, C., Guan, J., Ma, C., Yang, X., Wang, Q., et al. (2024) · Science Advances · doi:10.1126/sciadv.adj5640 · Cited by 3
Characteristics of T-cell receptor repertoire of stem cell-like memory CD4+ T cells
Wang, S., Wang, L., Liu, Y., Zhu, Y., & Liu, Y. (2021) · PeerJ · doi:10.7717/peerj.11987 · Cited by 3
Kedmi, M., Neuman, H., Bitansky, G., Nagar, M., Scheinert‐Shenhav, G., Barshack, I., Schiby, G., Tabibian‐Keissar, H., Avigdor, A., & Mehr, R. (2022) · International Journal of Laboratory Hematology · doi:10.1111/ijlh.13906 · Cited by 3
Immunological Profiling in Knee Osteoarthritis: Treg Dysfunction as Key Driver of PainPreprint
Binvignat, M., Dubois, J., Salvador, M. M., Stys, P., Pitoiset, F., Roux, A., Barbié, M., Hässler, S., Lorenzon, R., Ribet, C., et al. (2024) · bioRxiv (Cold Spring Harbor Laboratory) · doi:10.1101/2024.10.12.618016 · Cited by 3
Ying, T., Wen, Y., & Dimitrov, D. S. (2017) · Emerging Microbes & Infections · doi:10.1038/emi.2017.22 · Cited by 2
Odd Distance Anchors for Rapid Clustering
Ashlock, D., Chang, H., & Stoodley, M. (2020) · IEEE Conference on Computational Intelligence in Bioinformatics and Computational Biology (CIBCB) · doi:10.1109/cibcb48159.2020.9277719 · Cited by 2
Comparison of T-cell receptor diversity of people with myalgic encephalomyelitis versus controls
Dibble, J. J., Ferneyhough, B., Roddis, M., Millington, S., Fischer, M. D., Parkinson, N., & Ponting, C. P. (2024) · BMC Research Notes · doi:10.1186/s13104-023-06616-4 · Cited by 2
Predictability of antigen binding based on short motifs in the antibody CDRH3
Scheffer, L., Reber, E. E., Mehta, B. B., Pavlović, M., Chernigovskaya, M., Richardson, E., Akbar, R., Lund‐Johansen, F., Greiff, V., Haff, I. H., et al. (2024) · Briefings in Bioinformatics · doi:10.1093/bib/bbae537 · Cited by 2
Systematic benchmarking of mass spectrometry-based antibody sequencing reveals methodological biases
Chernigovskaya, M., Quý, K. L., Stensland, M., Singh, S. K., Nelson, R., Yilmaz, M., Kalogeropoulos, K., Sinitcyn, P. G., Patel, A. D., Castellana, N. E., et al. (2025) · Cell Systems · doi:10.1016/j.cels.2025.101449 · Cited by 2
Gong, Z., Xu, X., Cao, Y., Feng, Y., Liu, J., Yang, J., Wang, W., Gong, H., Li, ., Chen, L., et al. (2025) · Translational Cancer Research · doi:10.21037/tcr-24-1746 · Cited by 2
Different Species of Bats: Genomics, Transcriptome, and Immune Repertoire
Wang, H., Zhou, H., & Yao, X. (2025) · Current Issues in Molecular Biology · doi:10.3390/cimb47040252 · Cited by 2
Wu, T.-H., Liao, H., Li, T., Tsai, H., Lin, N., Chen, C., Tsai, S., Huang, T.-H., Tsai, C., & Yu, C. (2022) · Journal of Clinical Medicine · doi:10.3390/jcm11112980 · Cited by 2
Vujović, M., Marcatili, P., Chain, B., Kaplinsky, J., & Andresen, T. L. (2021) · bioRxiv (Cold Spring Harbor Laboratory) · doi:10.1101/2021.01.11.417444 · Cited by 2
Neuter, N. D., Bartholomeus, E., Elias, G., Keersmaekers, N., Suls, A., Jansens, H., Smits, E., Hens, N., Beutels, P.-H., Damme, P. V., et al. (2018) · immuneACCESS · doi:10.21417/b7r91w · Cited by 2
Computational Convergence of Adaptive Immunity and Artificial IntelligencePreprint
Reddy, S. T. (2026) · bioRxiv (Cold Spring Harbor Laboratory) · doi:10.64898/2026.02.03.703525 · Cited by 3
Elster, C., Ommer-Bläsius, M., Lang, A., Vajen, T., Pfeiler, S., Feige, M., Pang, T. Y., Böttenberg, M., Verheyen, S., Quý, K. L., et al. (2023) · Frontiers in Cardiovascular Medicine · doi:10.3389/fcvm.2023.1221620 · Cited by 1
IMperm: a fast and comprehensive IMmune Paired-End Reads Merger for sequencing data
Zhang, W., Ju, J., Zhou, Y., Xiong, T., Wang, M., Li, C., Lu, S., Lu, Z., Lin, L., Liu, X., et al. (2023) · Briefings in Bioinformatics · doi:10.1093/bib/bbad080 · Cited by 1
Identification of TCR repertoire patterns linked with anti-cancer immunotherapy
Vandoren, R., Gielis, S., Laukens, K., & Meysman, P. (2023) · Methods in cell biology · doi:10.1016/bs.mcb.2023.05.001 · Cited by 1
In Silico Methods for Studying T Cell Biology
Grzesik, K., Eng, K. H., Crauste, F., & Battaglia, S. (2018) · International review of cytology · doi:10.1016/bs.ircmb.2018.07.005 · Cited by 1
Systems immunology of human humoral immunity
Or‐Guil, M., & Boyd, S. D. (2018) · Current Opinion in Systems Biology · doi:10.1016/j.coisb.2018.11.002 · Cited by 1
Faliti, C. E., Ghimire, M., Vega, M. G., Watermeier, R. C., Callahan, A. R., Burke, J., Posadas, O., Mishra, A. K., Khurana, S., Greiff, V., et al. (2026) · medRxiv · doi:10.64898/2026.05.18.26353148 · Cited by 1
Nazarov, V. I., & Klyshinsky, E. S. (2017) · Keldysh Institute Preprints · doi:10.20948/prepr-2017-108
Identifying the best metrics to find the best quality clusters of genes from gene expression data
Rayon, R. R., Choudhury, J., Islam, M. T., Roshni, T. R., Ashraf, F. B., Ajwad, R., & Mottalib, M. A. (2019) · International Conference on Bioinformatics Research and Applications (ICBRA) · doi:10.1145/3383783.3383787
Mouse-specific but infection-unspecific IgM repertoire fingerprint following viral infectionPreprint
Yermanos, A., Kräutler, N. J., Pedrioli, A., Menzel, U., Greiff, V., Stadler, T., Oxenius, A., & Reddy, S. T. (2020) · bioRxiv (Cold Spring Harbor Laboratory) · doi:10.1101/2020.03.20.000471
Intrathymic differentiation of natural antibody-producing plasma cells in human neonates
CORDERO, H. J., King, R., Dogra, P., Dufeu, C., See, S., Chong, A., Uhlemann, A., Ho, S., Kalfa, D., Bacha, E., et al. (2021) · immuneACCESS · doi:10.21417/hc2021nc
Computational Analysis of B‐Cell Receptor (BCR) Immune Repertoires with Abalign
Wei, J., Li, J., Zong, F., Xiao, Z. J., & Cao, Y. (2024) · Current Protocols · doi:10.1002/cpz1.1002
Heather, J. M., Kim, D. W., Sepulveda, S. M., Seventer, E. E. V., Fish, M. G., Corcoran, R. B., Hacohen, N., Hong, T. S., & Cobbold, M. (2024) · bioRxiv (Cold Spring Harbor Laboratory) · doi:10.1101/2024.06.22.600048
Connecting instance and model sparsity in multiple instance learning
Riccardi, E., Minotto, T., Haff, I. H., & Sandve, G. K. (2025) · Machine Learning with Applications · doi:10.1016/j.mlwa.2025.100679
Huang, Y.-H., Lai, S.-K., Yang, Y.-H., Chang, J.-L., Chiu, I.-H., Chen, S.-C., Lee, P.-S., Lin, C.-H., Chiu, W.-Y., Wu, W.-C., et al. (2025) · medRxiv · doi:10.1101/2025.11.27.25341185
Explore antibody repertoire in the era of AI
Zhang, Y., Wang, H., Liu, C., & Meng, F. (2025) · Acta Biochimica et Biophysica Sinica · doi:10.3724/abbs.2025230
Dibble, J. J., Ferneyhough, B., Roddis, M., Millington, S., Fischer, M. D., Parkinson, N., & Ponting, C. (2024) · Figshare · doi:10.6084/m9.figshare.26661209
Dibble, J. J., Ferneyhough, B., Roddis, M., Millington, S., Fischer, M. D., Parkinson, N., & Ponting, C. (2024) · Figshare · doi:10.6084/m9.figshare.24946736
Dibble, J. J., Ferneyhough, B., Roddis, M., Millington, S., Fischer, M. D., Parkinson, N., & Ponting, C. (2024) · Figshare · doi:10.6084/m9.figshare.26661203
Dibble, J. J., Ferneyhough, B., Roddis, M., Millington, S., Fischer, M. D., Parkinson, N., & Ponting, C. P. (2024) · Figshare · doi:10.6084/m9.figshare.26661206
Additional file 2 of Systematic evaluation of B-cell clonal family inference approaches
Balashova, D., van Schaik, B. D. C., Stratigopoulou, M., Guikema, J. E. J., Caniels, T. G., Claireaux, M. A. F., van Gils, M. J., Musters, A., Anang, D. C., de Vries, N., et al. (2024) · UvA-DARE (University of Amsterdam) · doi:10.6084/m9.figshare.25195097
Dibble, J. J., Ferneyhough, B., Roddis, M., Millington, S., Fischer, M. D., Parkinson, N., & Ponting, C. (2024) · Figshare · doi:10.6084/m9.figshare.24946357
Additional file 1 of Systematic evaluation of B-cell clonal family inference approaches
Balashova, D., van Schaik, B. D. C., Stratigopoulou, M., Guikema, J. E. J., Caniels, T. G., Claireaux, M. A. F., van Gils, M. J., Musters, A., Anang, D. C., de Vries, N., et al. (2024) · Figshare · doi:10.6084/m9.figshare.25194818
Decoding adaptive immunity: advanced strategies in T and B cell repertoire analysis
Yu, X., Peng, N., Pan, W., Xie, S., Tang, C., Wang, X., Liu, H., Shi, Y., He, Y., Wu, W., et al. (2026) · Journal of Translational Medicine · doi:10.1186/s12967-026-07753-7
TET2 -mutant clonal hematopoiesis prevents T-cell exhaustion and suppresses cancer metastasisPreprint
Le, A. N. T., Fujisawa, M., Campo, G., Nguyen, Y. T. M., Nguyen, T. B., Suma, S., Suehara, Y., Miura, F., Araki, H., Makishima, K., et al. (2026) · bioRxiv (Cold Spring Harbor Laboratory) · doi:10.64898/2026.03.05.709727
immunoPETE: A DNA-based integrated B-cell and T-cell receptor profiling platformPreprint
Zhao, H., Mirebrahim, H., Telman, D., Dannebaum, R., McNamara, S., Tabari, E. S., Lin, H., Rubelt, F., Berka, J., Luong, K., et al. (2026) · bioRxiv (Cold Spring Harbor Laboratory) · doi:10.64898/2026.03.17.712532
Ju, H., Kong, D., Tao, Y., & Wang, F. (2026) · IEEE Transactions on Computational Biology and Bioinformatics · doi:10.1109/tcbbio.2026.3677212
The imprint of autoimmunity in the T-cell receptor repertoire
Mhanna, V. (2021) · theses.fr (ABES) · doi:10.70675/0f2c7368z6ea8z46d1zaee0zdc2aa559b7a2
Multi-omics integration and systems immunology application in rheumatology
Binvignat, M. (2024) · theses.fr (ABES) · doi:10.70675/b0d00dc7zeee1z4078zbeabz41e8b13cc551
Granzyme B-expressing regulatory B cells share the same origin as conventional blood B cells
Genebrier, S., Sailliet, N., Trinca, S. B. S., Mai, H. L., Dupuy, A., Cornic, M., Danger, R., Giral, M., Tarte, K., Brouard, S., et al. (2026) · Biochemistry and Biophysics Reports · doi:10.1016/j.bbrep.2026.102594
Magoulopoulou, A., Chatzinikolaou, M. P., Metousis, A., Hu, T., Yu, H., Zerdes, I., Wang, K., Foukakis, T., Long, M., Leandersson, K., et al. (2026) · EBioMedicine · doi:10.1016/j.ebiom.2026.106264
A systematic evaluation of network subsampling methods for T-cell receptor repertoire network
Wu, H., Le, T., Yang, H., Le, P., Oh, D. Y., & Zhang, L. (2026) · Statistics Innovation · doi:10.48130/stati-0026-0005
What Do Generative Models Learn About Adaptive Immune Receptor Repertoires? A Benchmark StudyPreprint
Würtzen, C., Mamica, M., Kanduri, C., Pavlović, M., Greiff, V., Peters, B., & Sandve, G. K. (2026) · bioRxiv (Cold Spring Harbor Laboratory) · doi:10.64898/2026.07.10.737788
A single-cell atlas of multiple myeloma defines malignant archetypes and proliferative states
Zada, M., Kurilovich, A., Shapira, N., Wang, S.-Y., Sharet-Eshed, R., Kfir‐Erenfeld, S., Schlossberg, M., Zorde, E., Asherie, N., Gur, C., et al. (2026) · Nature Genetics · doi:10.1038/s41588-026-02725-5
Genebrier, S., Trinca, S. B. S., Dézé, O., Cornic, M., Pineau, M., Tarte, K., & Cogné, M. (2026) · iScience · doi:10.1016/j.isci.2026.117564
Metadata
- Authors
- Greiff, V., Bhat, P., Cook, S. C., Menzel, U., Kang, W., & Reddy, S. T.
- Affiliations
- ETH Zurich (CH)
- Corresponding author
- Reddy, Sai T.
- Venue
- Genome Medicine
- Published
- 2015-05-28
- Volume
- 7
- Issue
- 1
- Pages
- 49-49
- ISSN
- 1756-994X (ISSN-L)
- PMC
- PMC4489130
- OpenAlex
- W1483854882
- Cited by
- 181
- References
- 89
- Citations by year
- 2026: 14 · 2025: 14 · 2024: 25 · 2023: 11 · 2022: 23 · 2021: 15 · 2020: 21 · 2019: 15 · 2018: 18 · 2017: 13 · 2016: 8 · 2015: 3
- FWCI
- 7.07
- Type
- journal article
- Language
- en
- Open access
- gold
- doi.org
- Locations
- Genome Medicine (publishedVersion, cc-by)
- Europe PMC (PubMed Central) (publishedVersion, cc-by)
- PubMed Central (publishedVersion, cc-by)
- PubMed (publishedVersion)
- Repository for Publications and Research Data (ETH Zurich) (submittedVersion, cc-by)
- ETH Zürich Research Collection (cc-by)
- Funders
- National Science Foundation
- Schweizerischer Nationalfonds zur Förderung der Wissenschaftlichen Forschung
- Eidgenössische Technische Hochschule Zürich
- SystemsX.ch
- Topics
- Life Sciences › Immunology and Microbiology › Immunology › T-cell and B-cell Immunology
- Life Sciences › Biochemistry, Genetics and Molecular Biology › Molecular Biology › vaccines and immunoinformatics approaches
- Physical Sciences › Computer Science › Artificial Intelligence › Artificial Immune Systems Applications
- Keywords
- immune repertoire diversity, immune status, immunodiagnosis, B cell receptor repertoire, T cell receptor repertoire, disease detection
About these checks
Registry, retraction, Cites and statistics results are computed, not judged, with one exception: a printed reference that no index lists is read once by a model before it counts as a citation error. Claims are extracted by a model and kept only when their quote appears verbatim in the text; each cited source is then checked, with a model’s help, for whether it says what the claim relies on. Those verdicts can be wrong — read the claim’s quote and the cited source before relying on one.
Statistics and arithmetic are recomputed, not judged.
Confidence bands are shown only for fields calibrated on our annotated test set. None is calibrated yet, so no band is shown.
What counts as a claim ›How we measure confidence ›How we check this ›
Are you an author, or do you see a problem with this page? Request a review
