Cited by 105T-cell and B-cell ImmunologySingle-cell and spatial transcriptomicsCancer Immunotherapy and Biomarkers

The DOI matches its Crossref record; 62 of the 64 references it cites were found in a registry or an index.

Discovery of CD80 and CD86 as recent activation markers on regulatory T cells by protein-RNA single-cell analysis

Open access

Published version of a preprint

Abstract

Abstract Background Traditionally, the transcriptomic and proteomic characterisation of CD4 + T cells at the single-cell level has been performed by two largely exclusive types of technologies: single-cell RNA sequencing (scRNA-seq) and antibody-based cytometry. Here, we present a multi-omics approach allowing the simultaneous targeted quantification of mRNA and protein expression in single cells and investigate its performance to dissect the heterogeneity of human immune cell populations. Methods We have quantified the single-cell expression of 397 genes at the mRNA level and up to 68 proteins using oligo-conjugated antibodies (AbSeq) in 43,656 primary CD4 + T cells isolated from the blood and 31,907 CD45 + cells isolated from the blood and matched duodenal biopsies. We explored the sensitivity of this targeted scRNA-seq approach to dissect the heterogeneity of human immune cell populations and identify trajectories of functional T cell differentiation. Results We provide a high-resolution map of human primary CD4 + T cells and identify precise trajectories of Th1, Th17 and regulatory T cell (Treg) differentiation in the blood and tissue. The sensitivity provided by this multi-omics approach identified the expression of the B7 molecules CD80 and CD86 on the surface of CD4 + Tregs, and we further demonstrated that B7 expression has the potential to identify recently activated T cells in circulation. Moreover, we identified a rare subset of CCR9 + T cells in the blood with tissue-homing properties and expression of several immune checkpoint molecules, suggestive of a regulatory function. Conclusions The transcriptomic and proteomic hybrid technology described in this study provides a cost-effective solution to dissect the heterogeneity of immune cell populations at extremely high resolution. Unexpectedly, CD80 and CD86, normally expressed on antigen-presenting cells, were detected on a subset of activated Tregs, indicating a role for these co-stimulatory molecules in regulating the dynamics of CD4 + T cell responses.

Overview

The claims and statistics of this paper haven’t been checked yet.

Run the check — free, no account needed. It reads the open-access text and checks the sources it cites.

A few free checks a day · papers already verified open instantly · results are public

Integrity signals

Registry

Crossref · 10.1186/s13073-020-00756-z

Cites

62 of 62 references verified0 citation errors · 0 not checkable

Statistics

Figures

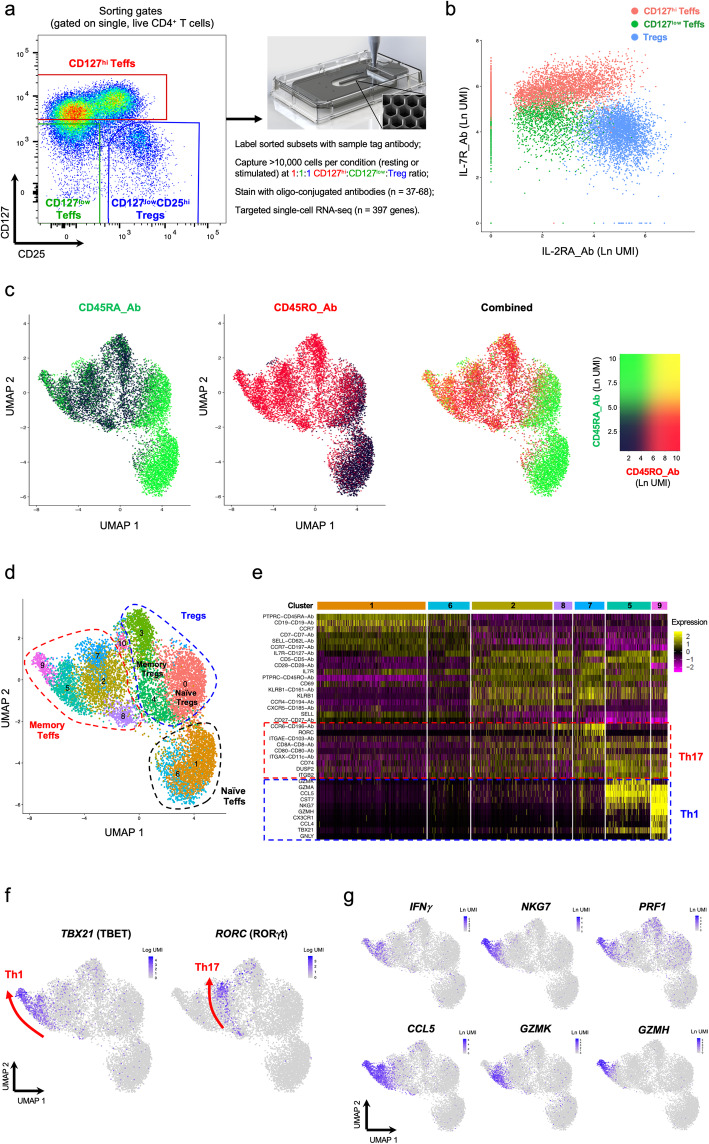
Fig. 1 Combined single-cell transcriptional and proteomics immunophenotyping provides a high-resolution map of human primary CD4+ T cells in the blood. a Summary of the experimental workflow. FACS plot depicting the sorting strategy for the isolation of the three assessed CD4+ T cell populations. b Two-dimensional plot depicting the expression of IL-7R and IL-2RA at the protein level using oligo-conjugated antibodies (AbSeq). Cells are coloured according to their respective sorting gate, as assessed using oligo-conjugated sample-tagging antibodies. c Uniform Manifold Approximation Projection (UMAP) plot depicting the clustering of all captured CD4+ single cells using the combined proteomics and transcriptomics data. Expression levels of the CD45RA (black to green) and CD45RO (black to red) isoforms obtained using the AbSeq technology are depicted in the plot. d UMAP plot depicting the clustering of resting primary CD4+ T cells (n = 9708) isolated from the blood of a systemic lupus erythematosus (SLE) patient. Dashed lines delineate the naive Teff (black), memory Teff (red), and Treg (blue) clusters, annotated manually based on their respective protein and mRNA expression profiles. e Heatmap displaying the top 10 differentially expressed genes in each resting CD4+ Teff cluster. f UMAP plots depicting the expression of the CD4+ T cell lineage-defining transcription factors TBET (Th1) and RORγt (Th17) in resting CD4+ T cells. Arrows recapitulate the identified axis of Th1 and Th17 differentiation and are supported both on the gradient of expression of the respective lineage-restricted transcription factors (TBET and RORγt, respectively) and on the developmental trajectories identified by the pseudotime analysis depicted in Fig. 3. g Expression of the effector-type cytokine transcripts IFNG, NKG7, PRF1, CCL5, GZMH and GZMK in resting CD4+ T cells
Fig. 1 Combined single-cell transcriptional and proteomics immunophenotyping provides a high-resolution map of human primary CD4+ T cells in the blood. a Summary of the experimental workflow. FACS plot depicting the sorting strategy for the isolation of the three assessed CD4+ T cell populations. b Two-dimensional plot depicting the expression of IL-7R and IL-2RA at the protein level using oligo-conjugated antibodies (AbSeq). Cells are coloured according to their respective sorting gate, as assessed using oligo-conjugated sample-tagging antibodies. c Uniform Manifold Approximation Projection (UMAP) plot depicting the clustering of all captured CD4+ single cells using the combined proteomics and transcriptomics data. Expression levels of the CD45RA (black to green) and CD45RO (black to red) isoforms obtained using the AbSeq technology are depicted in the plot. d UMAP plot depicting the clustering of resting primary CD4+ T cells (n = 9708) isolated from the blood of a systemic lupus erythematosus (SLE) patient. Dashed lines delineate the naive Teff (black), memory Teff (red), and Treg (blue) clusters, annotated manually based on their respective protein and mRNA expression profiles. e Heatmap displaying the top 10 differentially expressed genes in each resting CD4+ Teff cluster. f UMAP plots depicting the expression of the CD4+ T cell lineage-defining transcription factors TBET (Th1) and RORγt (Th17) in resting CD4+ T cells. Arrows recapitulate the identified axis of Th1 and Th17 differentiation and are supported both on the gradient of expression of the respective lineage-restricted transcription factors (TBET and RORγt, respectively) and on the developmental trajectories identified by the pseudotime analysis depicted in Fig. 3. g Expression of the effector-type cytokine transcripts IFNG, NKG7, PRF1, CCL5, GZMH and GZMK in resting CD4+ T cellsCC BY · PubMed Central
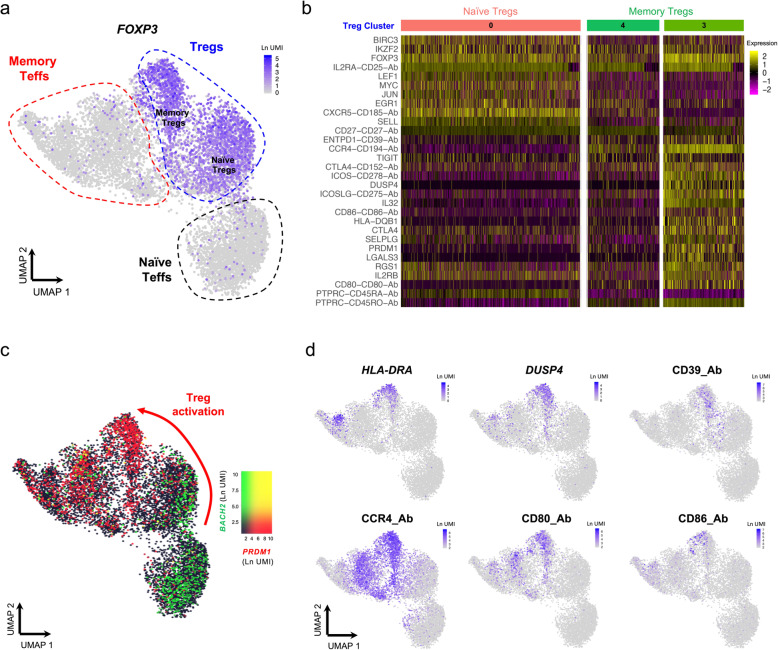
Fig. 2 Integrated single-cell targeted multi-omics approach identifies a trajectory of human CD4+ regulatory T cell (Treg) activation. a UMAP plot depicting the expression of the canonical Treg transcription factor FOXP3 in the identified resting CD4+ T cell clusters. Naive and memory Treg clusters are annotated as shown in Fig. 1c. b Heatmap displaying the top 10 differentially expressed genes within the three identified resting Treg clusters, depicted in Fig. 1d. c UMAP plot depicting the overlaid expression of the CD4+ T cell transcription factors BACH2 (black to green) and PRDM1 (encoding BLIMP-1; black to red). d Illustrative examples of the expression of highly differentially expressed genes within the cluster of activated Tregs (cluster 3), including HLA-DRA and DUSP4 at the mRNA level and CD39, CCR4, CD80 and CD86 at the protein level
Fig. 2 Integrated single-cell targeted multi-omics approach identifies a trajectory of human CD4+ regulatory T cell (Treg) activation. a UMAP plot depicting the expression of the canonical Treg transcription factor FOXP3 in the identified resting CD4+ T cell clusters. Naive and memory Treg clusters are annotated as shown in Fig. 1c. b Heatmap displaying the top 10 differentially expressed genes within the three identified resting Treg clusters, depicted in Fig. 1d. c UMAP plot depicting the overlaid expression of the CD4+ T cell transcription factors BACH2 (black to green) and PRDM1 (encoding BLIMP-1; black to red). d Illustrative examples of the expression of highly differentially expressed genes within the cluster of activated Tregs (cluster 3), including HLA-DRA and DUSP4 at the mRNA level and CD39, CCR4, CD80 and CD86 at the protein levelCC BY · PubMed Central
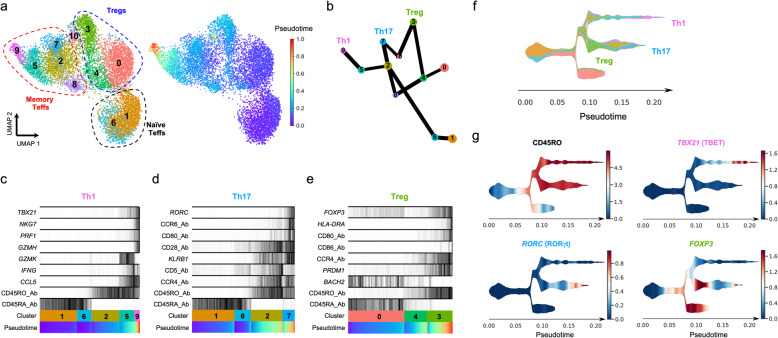
Fig. 3 Pseudotime analysis reveals distinct trajectories of CD4+ T cell differentiation in vivo. a UMAP plots depicting the inferred diffusion pseudotime of each single cell in the identified T cell clusters. b Graph reconstructing the developmental trajectories between the identified T cell clusters. Edge weights represent confidence in the presence of connections between clusters. The analysis was performed in the combined transcriptional and proteomics data using the partition-based graph abstraction (PAGA) method. c–e Reconstructed PAGA paths for the differentiation of the identified Th1 (c), Th17 (d) and Treg (e) lineages. Expression of the lineage-specific transcription factors and selected differentially expressed genes is depicted for each trajectory. f Schematic representation of the identified lineage differentiation trajectories using the single-cell trajectories reconstruction (STREAM) method. Colour code corresponds to the cluster assignment depicted in a. g Expression of the memory-associated CD45RO isoform and the lineage-specific transcription factors TBX21 (encoding TBET), RORC (encoding RORγt) and FOXP3 is depicted along the identified developmental branches
Fig. 3 Pseudotime analysis reveals distinct trajectories of CD4+ T cell differentiation in vivo. a UMAP plots depicting the inferred diffusion pseudotime of each single cell in the identified T cell clusters. b Graph reconstructing the developmental trajectories between the identified T cell clusters. Edge weights represent confidence in the presence of connections between clusters. The analysis was performed in the combined transcriptional and proteomics data using the partition-based graph abstraction (PAGA) method. c–e Reconstructed PAGA paths for the differentiation of the identified Th1 (c), Th17 (d) and Treg (e) lineages. Expression of the lineage-specific transcription factors and selected differentially expressed genes is depicted for each trajectory. f Schematic representation of the identified lineage differentiation trajectories using the single-cell trajectories reconstruction (STREAM) method. Colour code corresponds to the cluster assignment depicted in a. g Expression of the memory-associated CD45RO isoform and the lineage-specific transcription factors TBX21 (encoding TBET), RORC (encoding RORγt) and FOXP3 is depicted along the identified developmental branchesCC BY · PubMed Central
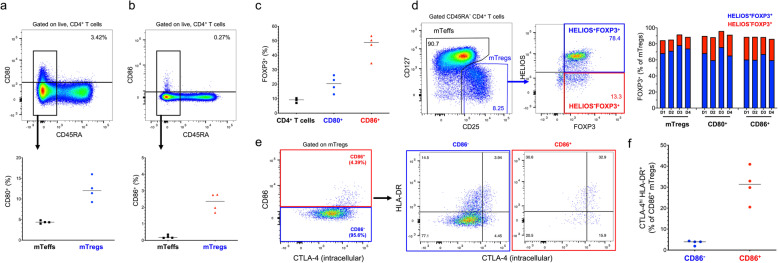
Fig. 4 Surface expression of the co-stimulatory molecules CD80 and CD86 marks a subset of activated Tregs in vivo. a, b Expression of the B7 molecules CD80 (a) and CD86 (b) was assessed ex vivo by flow cytometry in CD4+ T cells from four healthy donors. Scatter plots depict the frequency (median) of CD80+ and CD86+ T cells within the CD45RA− Teff (mTeffs; black) and CD45RA− CD127lowCD25+ Treg (mTregs; blue) populations. c Scatter plot depicts the frequency (median) of FOXP3+ cells within total (black), CD80+ and CD86+ CD4+ T cells. d Gating strategy for the delineation of the Treg subsets according to the intracellular expression of the canonical Treg transcription factors FOXP3 and HELIOS. Scatter plot depicts the frequency of HELIOS+FOXP3+ (blue) and HELIOS−FOXP3+ (red) subsets in each of the four donors within total mTregs, CD80+ mTregs and CD86+ mTregs. e Co-expression of CD86 and the CD4+ T cell activation markers CTLA-4 and HLA-DR was assessed by flow cytometry in CD86+ (red) and CD86− (blue) mTregs. f Scatter plots depict the frequency (median) of CTLA-4hi HLA-DR+ cells within CD86+ and CD86− mTregs. Expression of CTLA-4 was assessed by intracellular immunostaining
Fig. 4 Surface expression of the co-stimulatory molecules CD80 and CD86 marks a subset of activated Tregs in vivo. a, b Expression of the B7 molecules CD80 (a) and CD86 (b) was assessed ex vivo by flow cytometry in CD4+ T cells from four healthy donors. Scatter plots depict the frequency (median) of CD80+ and CD86+ T cells within the CD45RA− Teff (mTeffs; black) and CD45RA− CD127lowCD25+ Treg (mTregs; blue) populations. c Scatter plot depicts the frequency (median) of FOXP3+ cells within total (black), CD80+ and CD86+ CD4+ T cells. d Gating strategy for the delineation of the Treg subsets according to the intracellular expression of the canonical Treg transcription factors FOXP3 and HELIOS. Scatter plot depicts the frequency of HELIOS+FOXP3+ (blue) and HELIOS−FOXP3+ (red) subsets in each of the four donors within total mTregs, CD80+ mTregs and CD86+ mTregs. e Co-expression of CD86 and the CD4+ T cell activation markers CTLA-4 and HLA-DR was assessed by flow cytometry in CD86+ (red) and CD86− (blue) mTregs. f Scatter plots depict the frequency (median) of CTLA-4hi HLA-DR+ cells within CD86+ and CD86− mTregs. Expression of CTLA-4 was assessed by intracellular immunostainingCC BY · PubMed Central
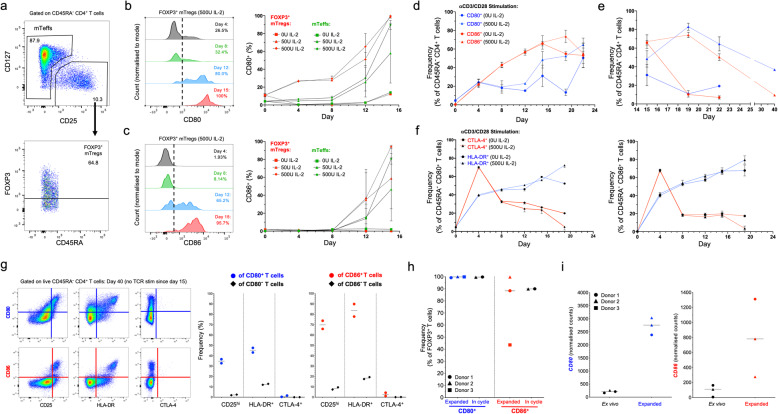
Fig. 5 Acquisition and maintenance of B7 molecule expression in CD4+ T cells in vitro is dependent on IL-2 signalling. a Gating strategy for the delineation of the mTeff and FOXP3+ mTreg populations. b, c Expression of CD80 (b) and CD86 (c) was assessed by flow cytometry in purified CD4+ T cells from two healthy donors incubated in vitro for up to 15 days in the presence of 0 U (square), 50 U (triangle) or 500 U (diamond) of IL-2. Single-parameter histograms represent the expression of CD80 and CD86 in mTreg incubated with 500 U IL-2 from a representative donor. Plots summarise the expression (median and 95% CI of the median) of the markers during the course of the experiment in FOXP3+ mTregs (red) and mTeffs (green). d Data shown depicts the frequency (median and 95% CI of the median) of CD80+ (blue) and CD86+ (red) cells within CD45RA− CD4+ mTeffs. Data was obtained following in vitro stimulation with αCD3/CD28 beads (one bead to three cells ratio) every four days for two weeks in the presence (500 U; solid line) or absence (dashed line) of IL-2. e Frequency of CD80+ (blue) and CD86+ (red) cells within mTeffs was also assessed up to day 40 in resting cells, which were no longer re-stimulated with αCD3/CD28 after day 15. f Plots depict the frequency of membrane-bound CTLA-4+ (red) and HLA-DR+ (blue) within CD80+ and CD86+ mTeffs during the course of the experiment. g Immunophenotypic characterisation of the activation markers CD25, HLA-DR and CTLA-4 on B7+ mTeffs at day 40. Plots depict the frequency (median) of cells expressing these markers within CD80+ and CD80− mTeffs (blue; left panel) and CD86+ and CD86− (red; right panel) mTeffs, respectively. h Frequency (median) of CD80+ (blue) and CD86+ (red) cells in flow-sorted CD127lowCD25hi Tregs from three healthy donors, activated in vitro under specific Treg expansion conditions. B7 molecule expression was assessed by flow cytometry in the FOXP3+ T cells. For two of the donors, B7 molecule expression was also assessed for cells in the cycle, harvested in the middle of an expansion cycle (eight days after αCD3/CD28 restimulation). Tregs were expanded for between three (D3; square) and six (D1 and D2; circle and triangle, respectively) rounds of re-stimulation. i Expression of CD80 and CD86 was also determined at the mRNA level (NanoString) on the sorted Tregs ex vivo or following in vitro expansion
Fig. 5 Acquisition and maintenance of B7 molecule expression in CD4+ T cells in vitro is dependent on IL-2 signalling. a Gating strategy for the delineation of the mTeff and FOXP3+ mTreg populations. b, c Expression of CD80 (b) and CD86 (c) was assessed by flow cytometry in purified CD4+ T cells from two healthy donors incubated in vitro for up to 15 days in the presence of 0 U (square), 50 U (triangle) or 500 U (diamond) of IL-2. Single-parameter histograms represent the expression of CD80 and CD86 in mTreg incubated with 500 U IL-2 from a representative donor. Plots summarise the expression (median and 95% CI of the median) of the markers during the course of the experiment in FOXP3+ mTregs (red) and mTeffs (green). d Data shown depicts the frequency (median and 95% CI of the median) of CD80+ (blue) and CD86+ (red) cells within CD45RA− CD4+ mTeffs. Data was obtained following in vitro stimulation with αCD3/CD28 beads (one bead to three cells ratio) every four days for two weeks in the presence (500 U; solid line) or absence (dashed line) of IL-2. e Frequency of CD80+ (blue) and CD86+ (red) cells within mTeffs was also assessed up to day 40 in resting cells, which were no longer re-stimulated with αCD3/CD28 after day 15. f Plots depict the frequency of membrane-bound CTLA-4+ (red) and HLA-DR+ (blue) within CD80+ and CD86+ mTeffs during the course of the experiment. g Immunophenotypic characterisation of the activation markers CD25, HLA-DR and CTLA-4 on B7+ mTeffs at day 40. Plots depict the frequency (median) of cells expressing these markers within CD80+ and CD80− mTeffs (blue; left panel) and CD86+ and CD86− (red; right panel) mTeffs, respectively. h Frequency (median) of CD80+ (blue) and CD86+ (red) cells in flow-sorted CD127lowCD25hi Tregs from three healthy donors, activated in vitro under specific Treg expansion conditions. B7 molecule expression was assessed by flow cytometry in the FOXP3+ T cells. For two of the donors, B7 molecule expression was also assessed for cells in the cycle, harvested in the middle of an expansion cycle (eight days after αCD3/CD28 restimulation). Tregs were expanded for between three (D3; square) and six (D1 and D2; circle and triangle, respectively) rounds of re-stimulation. i Expression of CD80 and CD86 was also determined at the mRNA level (NanoString) on the sorted Tregs ex vivo or following in vitro expansionCC BY · PubMed Central
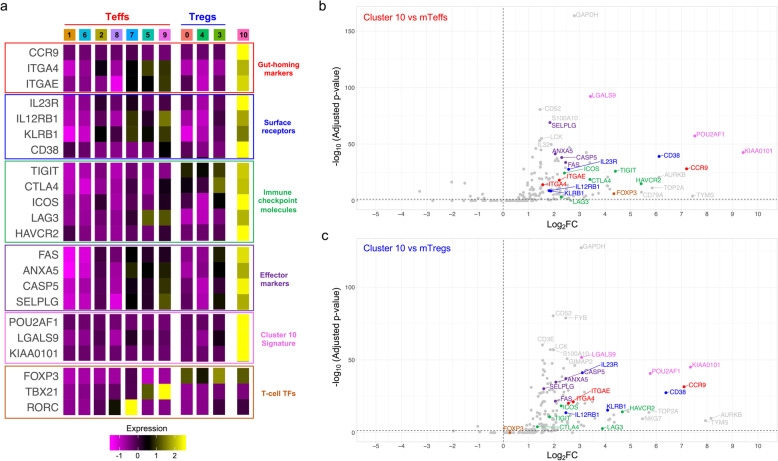
Fig. 6 Characterisation of a rare subset of circulating CCR9+ T cells with putative immunomodulatory properties. a Heatmap depicts the average scaled expression in each identified T cell cluster of selected differentially expressed genes in cluster 10. Markers are grouped according to their functional annotation into gut-homing markers (red), surface receptor (blue), immune checkpoint molecules (green), T cell effector markers (purple), cluster 10 signature genes (pink) and T cell transcription factors (TFs; orange). b, c Volcano plots depict the differential expression of the assessed mRNA transcripts between cluster 10 and either the mTeff (b) or mTreg (c) clusters. Colour coding depicts the functional annotation assigned in a
Fig. 6 Characterisation of a rare subset of circulating CCR9+ T cells with putative immunomodulatory properties. a Heatmap depicts the average scaled expression in each identified T cell cluster of selected differentially expressed genes in cluster 10. Markers are grouped according to their functional annotation into gut-homing markers (red), surface receptor (blue), immune checkpoint molecules (green), T cell effector markers (purple), cluster 10 signature genes (pink) and T cell transcription factors (TFs; orange). b, c Volcano plots depict the differential expression of the assessed mRNA transcripts between cluster 10 and either the mTeff (b) or mTreg (c) clusters. Colour coding depicts the functional annotation assigned in aCC BY · PubMed Central
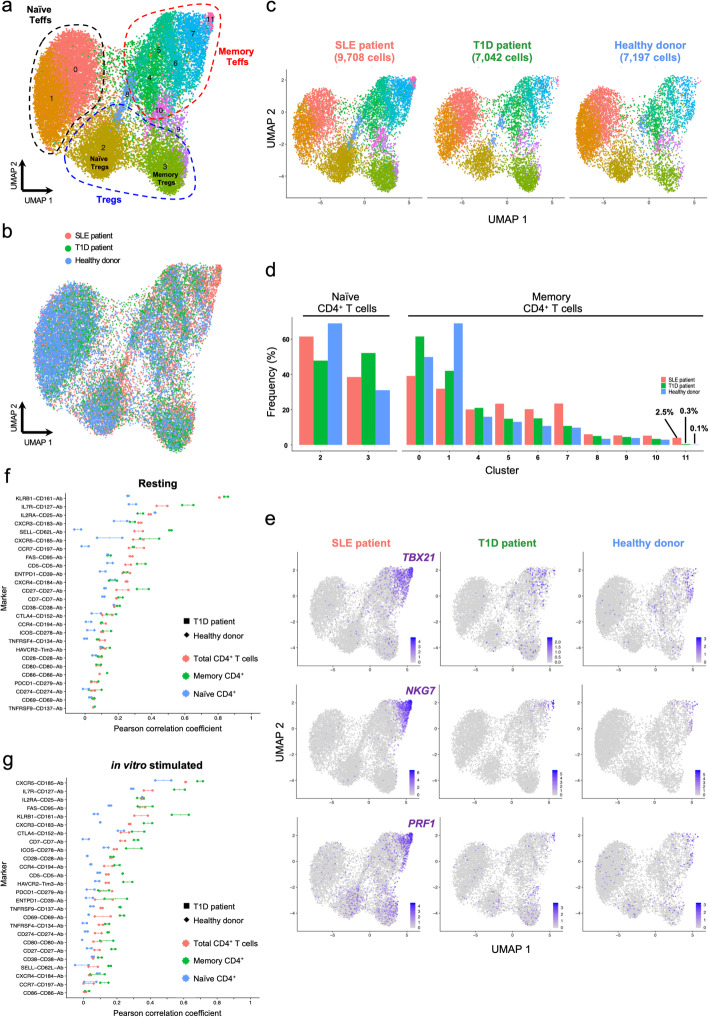
Fig. 7 Data from independent experiments can be robustly integrated. a UMAP plot depicting the clustering of resting primary CD4+ T cells from one systemic lupus erythematosus (SLE; n = 9708 cells) patient, one type 1 diabetes (T1D; n = 7042 cells) patient and one healthy donor (n = 7197 cells). Data were integrated from two independent experiments using the same CD4+ T cell FACS sorting strategy (described in Fig. 1a). b Alignment of the integrated targeted transcriptomics and proteomics data generated from the three assessed donors in two independent experiments. c UMAP plots depicting the donor-specific clustering of the CD4+ T cells. d Relative proportion of the identified CD4+ T cell clusters in each donor. Frequencies were normalised to either the annotated naive or memory compartments to ensure higher functional uniformity of the assessed T cell subsets and to avoid alterations associated with the declining frequency of naive cells with age. e UMAP plots depicting the relative expression of the canonical Th1 transcription factor TBX21 (encoding TBET) and the effector cytokines NKG7 and PRF1 on the three assessed donors. f, g Correlation (Pearson correlation coefficient) between mRNA and protein expression for 26 markers with concurrent mRNA and protein expression data in resting (f) and in vitro-stimulated (g) CD4+ T cells. The correlation was calculated in the total CD4+ T cells (red) or in the CD45RA− memory (green) or CD45RA+ naive (blue) T cell subsets separately. Individual-level correlation in the type 1 diabetes (T1D) patient (square) and healthy donor (diamond) and median correlation in both donors are displayed in the figure
Fig. 7 Data from independent experiments can be robustly integrated. a UMAP plot depicting the clustering of resting primary CD4+ T cells from one systemic lupus erythematosus (SLE; n = 9708 cells) patient, one type 1 diabetes (T1D; n = 7042 cells) patient and one healthy donor (n = 7197 cells). Data were integrated from two independent experiments using the same CD4+ T cell FACS sorting strategy (described in Fig. 1a). b Alignment of the integrated targeted transcriptomics and proteomics data generated from the three assessed donors in two independent experiments. c UMAP plots depicting the donor-specific clustering of the CD4+ T cells. d Relative proportion of the identified CD4+ T cell clusters in each donor. Frequencies were normalised to either the annotated naive or memory compartments to ensure higher functional uniformity of the assessed T cell subsets and to avoid alterations associated with the declining frequency of naive cells with age. e UMAP plots depicting the relative expression of the canonical Th1 transcription factor TBX21 (encoding TBET) and the effector cytokines NKG7 and PRF1 on the three assessed donors. f, g Correlation (Pearson correlation coefficient) between mRNA and protein expression for 26 markers with concurrent mRNA and protein expression data in resting (f) and in vitro-stimulated (g) CD4+ T cells. The correlation was calculated in the total CD4+ T cells (red) or in the CD45RA− memory (green) or CD45RA+ naive (blue) T cell subsets separately. Individual-level correlation in the type 1 diabetes (T1D) patient (square) and healthy donor (diamond) and median correlation in both donors are displayed in the figureCC BY · PubMed Central
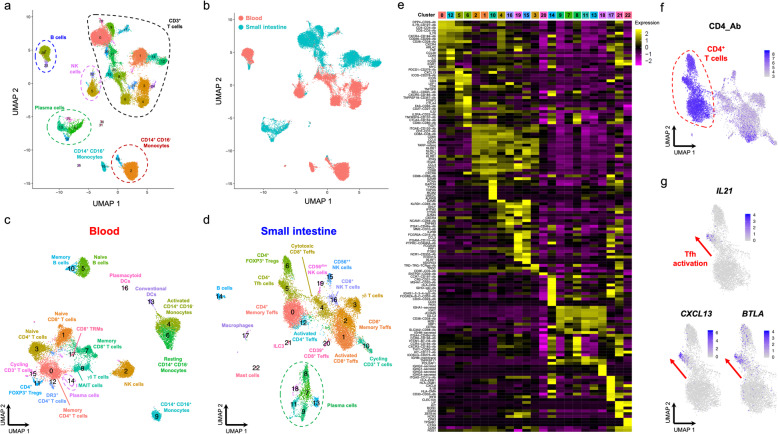
Fig. 8 Targeted scRNA-seq and proteomics approach delineates distinct functional subsets in a heterogeneous population of CD45+ immune cells isolated from blood and tissue. a UMAP plot depicting the clustering of the targeted scRNA-seq and transcriptional data of a heterogeneous population of total CD45+ cells (n = 31,907) isolated from blood and a paired duodenal biopsy from two coeliac disease (CD) patients with active disease. b Sample Tag information identifies samples isolated from the blood (red) or from the paired duodenal biopsy (teal). c, d UMAP plot depicting the clustering of the CD45+ cells isolated from the blood (c) or the paired duodenal biopsy (d). e Heatmap displaying the top 10 differentially expressed genes in each identified cluster from the CD45+ immune cells isolated from the duodenal biopsies. f UMAP plot depicting the expression of CD4 at the protein level (AbSeq) within the CD3+ T cells isolated from the small intestine. g Gradient of expression of the Tfh effector genes IL21, CXCL13 and BTLA in tissue-resident CD4+ T cells. DR3, death-receptor 3 (encoded by TNFRSF25); TRM, tissue-resident memory T cells; MAIT, mucosal-associated invariant T cells; ILC3, type 3 innate lymphoid cell
Fig. 8 Targeted scRNA-seq and proteomics approach delineates distinct functional subsets in a heterogeneous population of CD45+ immune cells isolated from blood and tissue. a UMAP plot depicting the clustering of the targeted scRNA-seq and transcriptional data of a heterogeneous population of total CD45+ cells (n = 31,907) isolated from blood and a paired duodenal biopsy from two coeliac disease (CD) patients with active disease. b Sample Tag information identifies samples isolated from the blood (red) or from the paired duodenal biopsy (teal). c, d UMAP plot depicting the clustering of the CD45+ cells isolated from the blood (c) or the paired duodenal biopsy (d). e Heatmap displaying the top 10 differentially expressed genes in each identified cluster from the CD45+ immune cells isolated from the duodenal biopsies. f UMAP plot depicting the expression of CD4 at the protein level (AbSeq) within the CD3+ T cells isolated from the small intestine. g Gradient of expression of the Tfh effector genes IL21, CXCL13 and BTLA in tissue-resident CD4+ T cells. DR3, death-receptor 3 (encoded by TNFRSF25); TRM, tissue-resident memory T cells; MAIT, mucosal-associated invariant T cells; ILC3, type 3 innate lymphoid cellCC BY · PubMed Central

Verification

Claims the paper makes

The claims and statistics of this paper haven’t been checked yet.

Run the check — free, no account needed. It reads the open-access text and checks the sources it cites.

A few free checks a day · papers already verified open instantly · results are public

Claims other papers make about this one

Each is checked against this paper’s own text: does it say what the citing paper says it does?

Self-check

Percentages, sums and reported differences re-computed from the paper’s own numbers.

The self-check needs the paper’s full text.

Citations

Cites

Show all 64 references

Research works printed but not linked: 1

  1. Trzupek D, Dunstan M, Cutler AJ, Lee M, Godfrey L, Jarvis L, et al. Discovery of CD80 and CD86 as recent activation markers on regulatory T cells by protein-RNA single-cell analysis. GEO data series: GSE150060. Gene Expression Omnibus. 2020. https://www.ncbi.nlm.nih.gov/geo/query/acc.cgi?acc=GSE150060. Accessed 12 June 2020.

Cited by

Sorted by citations

Items 101–104 of 104

Metadata

Authors
Trzupek, D., Dunstan, M., Cutler, A. J., Lee, M., Godfrey, L., Jarvis, L., Rainbow, D. B., Aschenbrenner, D., Jones, J. L., Uhlig, H. H., Wicker, L. S., Todd, J. A., & Ferreira, R. C.
Affiliations
  • Centre for Human Genetics (GB)
  • University of Cambridge (GB)
  • John Radcliffe Hospital (GB)
Corresponding author
  • Todd, John A.
  • Ferreira, Ricardo C.
Venue
Genome Medicine
Published
2020-06-24
Volume
12
Issue
1
Pages
55-55
ISSN
1756-994X (ISSN-L)
OpenAlex
W3035987524
Cited by
105
References
64
Citations by year
2026: 9 · 2025: 19 · 2024: 20 · 2023: 20 · 2022: 15 · 2021: 16 · 2020: 5
FWCI
4.90
Type
journal article
Language
en
Open access
Locations
  • Genome Medicine (publishedVersion, cc-by)
  • bioRxiv (Cold Spring Harbor Laboratory) (acceptedVersion, cc-by-nd)
  • PubMed Central (publishedVersion, cc-by)
  • PubMed (publishedVersion)
  • DOAJ (DOAJ: Directory of Open Access Journals) (submittedVersion, cc-by-sa)
  • Apollo (University of Cambridge) (submittedVersion, cc-by)
  • Apollo (cc-by)
  • Apollo
Funders
  • Wellcome Trust (107212/A/15/Z)
  • Juvenile Diabetes Research Foundation United States of America (1-SRA-2019-657-A-N, 4-SRA-2017-473-A-A, 4-2007-1003)
Topics
  • Life Sciences › Immunology and Microbiology › Immunology › T-cell and B-cell Immunology
  • Life Sciences › Biochemistry, Genetics and Molecular Biology › Molecular Biology › Single-cell and spatial transcriptomics
  • Health Sciences › Medicine › Oncology › Cancer Immunotherapy and Biomarkers
Keywords
CD80, CD86, regulatory T cells, B7 costimulatory molecules, T cell activation, CD4+ T cells, Th1 differentiation, Th17 cell differentiation, T cell differentiation trajectory, immune checkpoint molecules, duodenal biopsy, immune cell heterogeneity
MeSH terms
RNA-Seq, Adolescent, Adult, Female, Humans, Male, RNA, B7-1 Antigen, Proteome, T-Lymphocytes, Regulatory, Forkhead Transcription Factors, B7-2 Antigen, Single-Cell Analysis, Transcriptome

About these checks

Registry, retraction, Cites and statistics results are computed, not judged, with one exception: a printed reference that no index lists is read once by a model before it counts as a citation error. Claims are extracted by a model and kept only when their quote appears verbatim in the text; each cited source is then checked, with a model’s help, for whether it says what the claim relies on. Those verdicts can be wrong — read the claim’s quote and the cited source before relying on one.

Statistics and arithmetic are recomputed, not judged.

Confidence bands are shown only for fields calibrated on our annotated test set. None is calibrated yet, so no band is shown.

What counts as a claim ›How we measure confidence ›How we check this ›

Are you an author, or do you see a problem with this page? Request a review