

The DOI matches its Crossref record; 51 of the 51 references it cites were found in a registry or an index.
Characterization and clinical use of inflammatory cerebrospinal fluid protein markers in Alzheimer’s disease
Open accessAbstract
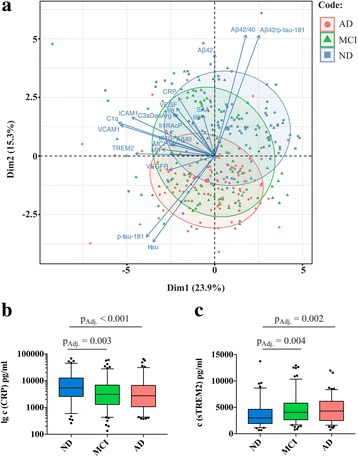
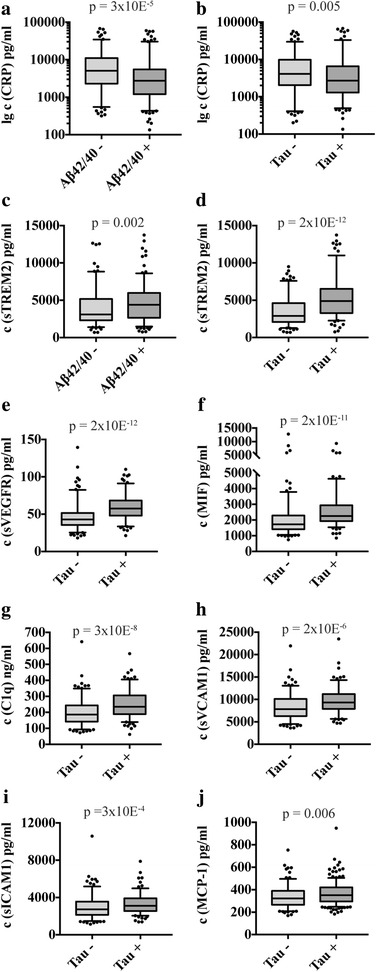
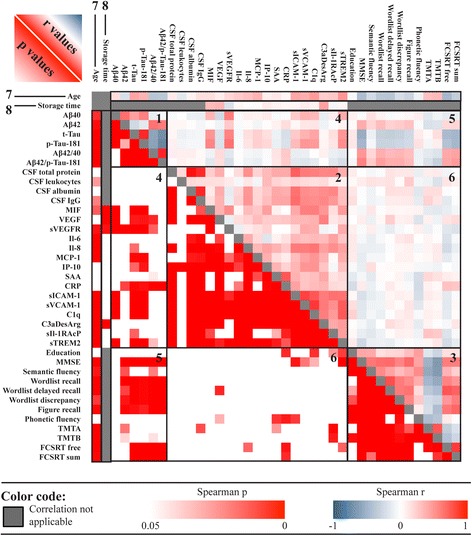
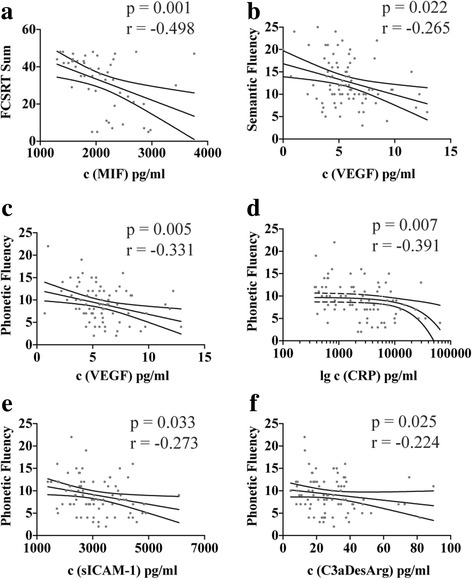
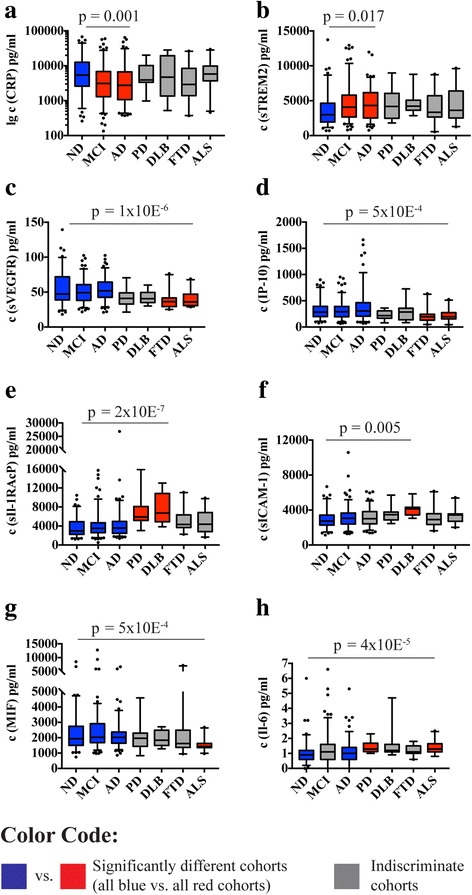
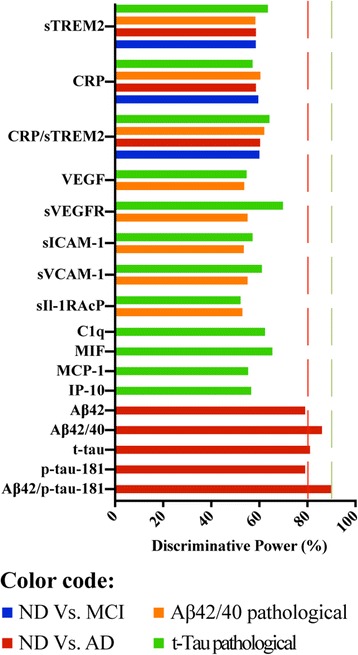
BACKGROUND: Neuroinflammation has gained increasing attention as a potential contributing factor in Alzheimer's disease (AD) pathology. A clinical cerebrospinal fluid biomarker capable of monitoring this process during the course of the disease has yet to emerge, chiefly owing to contradictory research findings. In this study, we sought to clarify the utility of inflammatory biomarkers in diagnostic procedures of AD in three steps: (1) to screen for proteins that are robustly detectable in cerebrospinal fluid; (2) based on this analysis, to explore any associations between the analytically robust markers and salient pathological features of AD; and (3) to determine the discriminative power of these markers in the clinical diagnosis of AD. METHODS: From a total of 46 proteins, 15 that were robustly detectable in cerebrospinal fluid were identified. A subsequent analysis of these markers in a cohort of 399 patients (nondemented subjects, patients with mild cognitive impairment [MCI], and patients with AD, supplemented by smaller cohorts of other diseases) was conducted. Fluid biomarker data were related to AD pathology and neuropsychological markers and adjusted for confounders such as age, sex, apolipoprotein E genotype, and biobank storage time. RESULTS: Cerebrospinal fluid levels of C-reactive protein and soluble TREM2 differed between nondemented subjects, patients with MCI, or patients with AD and were associated with amyloid and tau pathology. Several markers were associated with tau pathology only or with other neurodegenerative diseases. Correlations between neuropsychological performance and inflammatory markers were weak, but they were most prominent in AD and for the most challenging cognitive tests. All investigated covariates had significant influence, with varying effects across the markers. Still, none of the markers achieved discriminative power of more than 70% to distinguish between patient groups defined by clinical or neuropathological categories. CONCLUSIONS: Basic analytical considerations proved indispensable for this type of study because only one-third of the tested markers were robustly detectable in cerebrospinal fluid. Detectable inflammatory protein markers were associated in multiple ways with AD pathology. Yet, even significantly associated markers were not powerful enough in terms of effect strength, sensitivity, and specificity, and hence they were not suited for direct use in clinical diagnostic practice. Targets other than those most commonly considered in this field of research might provide results with better clinical applicability.
Overview
The claims and statistics of this paper haven’t been checked yet.
Run the check — free, no account needed. It reads the open-access text and checks the sources it cites.
Integrity signals
Registry
Cites
Statistics
Figures
Verification
Claims the paper makes
The claims and statistics of this paper haven’t been checked yet.
Run the check — free, no account needed. It reads the open-access text and checks the sources it cites.
Claims other papers make about this one
Each is checked against this paper’s own text: does it say what the citing paper says it does?
In the citing paper
“It is concluded that CSF levels of these markers correspond to the pathological activity in the brain only in the later stages with cognitive demand tasks in AD [55].”
From Recent Advancements in Pathogenesis, Diagnostics and Treatment of Alzheimer’s Disease (2020) · cites this paper as [55]
Self-check
Percentages, sums and reported differences re-computed from the paper’s own numbers.
The self-check needs the paper’s full text.
Citations
Cites
Folstein, M. F., Folstein, S. E., & McHugh, P. R. (1975) · Journal of Psychiatric Research · doi:10.1016/0022-3956(75)90026-6 · Cited by 88,282
Hirono, N., Mori, E., Ikejiri, Y., Imamura, T., Shimomura, T., Hashimoto, M., Yamashita, H., & Ikeda, M. (1997) · PubMed · Cited by 21,012
Kok, J. S., Berg, I. J., & Scherder, E. J. A. (2013) · Dementia and Geriatric Cognitive Disorders Extra · doi:10.1159/000353441 · Cited by 20,589
Older Adults' Reasons for Using Technology while Aging in Place
Peek, S. T. M., Luijkx, K. G., Rijnaard, M. D., Nieboer, M. E., van der Voort, C. S., Aarts, S., van Hoof, J., Vrijhoef, H. J., & Wouters, E. (2015) · Gerontology · doi:10.1159/000430949 · Cited by 19,852
Sensitivity and False Alarm Rate of a Fall Sensor in Long-Term Fall Detection in the Elderly
Kangas, M., Korpelainen, R., Vikman, I., Nyberg, L., & Jämsä, T. J. (2014) · Gerontology · doi:10.1159/000362720 · Cited by 19,007
McKhann, G. M., Knopman, D. S., Chertkow, H., Hyman, B. T., Jack, C. R., Kawas, C. H., Klunk, W. E., Koroshetz, W. J., Manly, J. J., Mayeux, R., et al. (2011) · Alzheimer's & Dementia · doi:10.1016/j.jalz.2011.03.005 · Cited by 18,657 · cited 1×
“The AD cohort included patients with “probable Alzheimer’s disease” according to National Institute on Aging-Alzheimer’s Association criteria, supported by at least an intermediate level of evidence for AD pathology by CSF analysis or imaging [18].”
MethodThe ASA Statement on p -Values: Context, Process, and Purpose
Wasserstein, R. L., & Lazar, N. A. (2016) · The American Statistician · doi:10.1080/00031305.2016.1154108 · Cited by 6,306 · cited 1×
“When discussing biomarker findings, it is of great importance to consider not only statistical significance but also the effect strength, sensitivity, and specificity of the biomarker candidates [9, 43].”
BackgroundOverdependence on degraded gist memory in Alzheimer's disease.
Gallo, D. A., Shahid, K. R., Olson, M. A., Solomon, T. M., Schacter, D. L., & Budson, A. E. (2006) · Neuropsychology · doi:10.1037/0894-4105.20.6.625 · Cited by 4,757
Moms, J. C., Heyman, A., Mohs, R. C., Hughes, J. P., van Belle, G., Fillenbaum, G., Mellits, E. D., & Clark, C. (1989) · Neurology · doi:10.1212/wnl.39.9.1159 · Cited by 4,130
Apolipoprotein E and Alzheimer disease: risk, mechanisms and therapy
Liu, C.-C., Kanekiyo, T., Xu, H., & Bu, G. (2013) · Nature Reviews Neurology · doi:10.1038/nrneurol.2012.263 · Cited by 3,459 · cited 1×
“CRP was also the only inflammatory marker significantly associated with the ApoE genotype, the most influential genetic AD risk factor [19].”
Background
Cited by
Sorted by citations
Recent Advancements in Pathogenesis, Diagnostics and Treatment of Alzheimer’s Disease
Khan, S., Barve, K. H., & Kumar, M. S. (2020) · Current Neuropharmacology · doi:10.2174/1570159x18666200528142429 · Cited by 820
Neuroinflammation in Alzheimer disease
Heneka, M. T., van der Flier, W. M., Jessen, F., Hoozemanns, J., Thal, D. R., Boche, D., Brosseron, F., Teunissen, C., Zetterberg, H., Jacobs, A. H., et al. (2025) · Nature Reviews Immunology · doi:10.1038/s41577-024-01104-7 · Cited by 638
“Quantitation of inflammatory mediators, such as cytokines in CSF, can be hampered by the sensitivity of detection technologies 33 , but novel ultra-sensitive immunoassays, including single-molecule array, proximity extension assay and nucleic acid-linked immuno-sandwich assay, or measurement of…”
Self-citationCurrent state of Alzheimer’s fluid biomarkers
Molinuevo, J. L., Ayton, S., Batrla, R., Bednar, M. M., Bittner, T., Cummings, J., Fagan, A. M., Hampel, H., Mielke, M. M., Mikulskis, A., et al. (2018) · Acta Neuropathologica · doi:10.1007/s00401-018-1932-x · Cited by 518
Glial activation and inflammation along the Alzheimer’s disease continuum
Nordengen, K., Kirsebom, B.-E., Henjum, K., Selnes, P., Gísladóttir, B., Wettergreen, M., Torsetnes, S. B., Grøntvedt, G. R., Waterloo, K. K., Aarsland, D., et al. (2019) · Journal of Neuroinflammation · doi:10.1186/s12974-019-1399-2 · Cited by 274
The role of TREM2 in Alzheimer's disease and other neurodegenerative disorders
Carmona, S., Zahs, K., Wu, E., Dakin, K., Bras, J., & Guerreiro, R. (2018) · The Lancet Neurology · doi:10.1016/s1474-4422(18)30232-1 · Cited by 244
Zhou, Y., Xu, J., Hou, Y., Leverenz, J. B., Kallianpur, A. R., Mehra, R., Liu, Y., Yu, H., Pieper, A. A., Jehi, L. E., et al. (2021) · Alzheimer s Research & Therapy · doi:10.1186/s13195-021-00850-3 · Cited by 165
The Role of Biomarkers in Alzheimer’s Disease Drug Development
Cummings, J. L. (2019) · Advances in experimental medicine and biology · doi:10.1007/978-3-030-05542-4_2 · Cited by 153
Blood-Based Biomarkers for Alzheimer’s Disease Diagnosis and Progression: An Overview
Varesi, A., Carrara, A., Pires, V. G., Floris, V., Pierella, E., Savioli, G., Prasad, S., Esposito, C., Ricevuti, G., Chirumbolo, S., et al. (2022) · Cells · doi:10.3390/cells11081367 · Cited by 150
A peripheral signature of Alzheimer’s disease featuring microbiota-gut-brain axis markers
Marizzoni, M., Mirabelli, P., Mombelli, E., Coppola, L., Festari, C., Lopizzo, N., Luongo, D., Mazzelli, M., Naviglio, D., Blouin, J.-L., et al. (2023) · Alzheimer's Research & Therapy · doi:10.1186/s13195-023-01218-5 · Cited by 121
“Results CI‑AD were characterized by (1) higher abundance of Clostridia_UCG-014 and decreased abundance of Moryella and Blautia (p < .04); (2) elevated levels of LPS (p < .03), upregulation of CAMs, Il1β, IL6, and TNFα, and down‑ regulation of IL10 (p < .05); (3) increased brain amyloid, plasma pTau‑181, and NfL (p < 0…”
BackgroundInfluentialStaging of Alzheimer’s disease: past, present, and future perspectives
Therriault, J., Zimmer, E. R., Benedet, A. L., Pascoal, T. A., Gauthier, S. G., & Rosa‐Neto, P. (2022) · Trends in Molecular Medicine · doi:10.1016/j.molmed.2022.05.008 · Cited by 123
Gaetani, L., Paoletti, F. P., Bellomo, G., Mancini, A., Simoni, S., Filippo, M. D., & Parnetti, L. (2020) · Trends in Pharmacological Sciences · doi:10.1016/j.tips.2020.09.011 · Cited by 110
Nasiri, E., Sankowski, R., Dietrich, H., Oikonomidi, A., Huerta, P. T., Popp, J., Al-Abed, Y., & Bacher, M. (2020) · Molecular Medicine · doi:10.1186/s10020-020-00163-5 · Cited by 91
Batista, A. F., Rody, T., Forny-Germano, L., Cerdeiro, S., Bellio, M., Ferreira, S. T., Munoz, D. P., & De Felice, F. G. (2021) · Journal of Neuroinflammation · doi:10.1186/s12974-021-02099-x · Cited by 91
Early life adversity as a risk factor for cognitive impairment and Alzheimer’s disease
Huang, Z., Jordan, J. D., & Zhang, Q. (2023) · Translational Neurodegeneration · doi:10.1186/s40035-023-00355-z · Cited by 98
Lista, S., Imbimbo, B. P., Grasso, M., Fidilio, A., Emanuele, E., Minoretti, P., López-Ortiz, S., Martín-Hernández, J., Gabelle, A., Caruso, G., et al. (2024) · Journal of Neuroinflammation · doi:10.1186/s12974-024-03163-y · Cited by 81
“Specifically, it falls short of the 80–90% range required in clinical diagnostic practice to effectively differentiate between patient groups [69].”
BackgroundResultSelf-citationIn Vivo TSPO Signal and Neuroinflammation in Alzheimer’s Disease
Tournier, B. B., Tsartsalis, S., Ceyzériat, K., Garibotto, V., & Millet, P. (2020) · Cells · doi:10.3390/cells9091941 · Cited by 79
Korecka, M., & Shaw, L. M. J. (2021) · Journal of Neurochemistry · doi:10.1111/jnc.15465 · Cited by 82
“There are several studies that have reported significantly higher concentrations of the soluble variant of TREM2 (sTREM2) in AD compared to control CSF and significant correlations were observed in CSF between soluble TREM2 and total tau as well as ptau181 (Brosseron et al., 2018; Gispert et al., 2016; Heslegrave et a…”
BackgroundBatista, A. F., Bodart‐Santos, V., Felice, F. G. D., & Ferreira, S. T. (2018) · CNS Drugs · doi:10.1007/s40263-018-0593-6 · Cited by 78
Silva, D. F., Candeias, E., Esteves, A. R., Magalhães, J. D., Ferreira, I. L., Nunes‐Costa, D., Rego, A. C., Empadinhas, N., & Cardoso, S. M. (2020) · Journal of Neuroinflammation · doi:10.1186/s12974-020-02004-y · Cited by 73
“Increased levels of pro-inflammatory markers were detected in the CSF of AD patients, namely IL-8, IL-6, and TREM2 [5, 6], as well as in brain tissue where the activation of microglial cells was assessed by examining CD68 and Iba1 positive cells [7].”
BackgroundTREM2 alters the phagocytic, apoptotic and inflammatory response to Aβ42 in HMC3 cells
Akhter, R., Shao, Y., Formica, S., Khrestian, M., & Bekris, L. M. (2021) · Molecular Immunology · doi:10.1016/j.molimm.2020.12.035 · Cited by 68
Brosseron, F., Maaß, A., Kleineidam, L., Ravichandran, K. A., García‐González, P., McManus, R. M., Ising, C., Santarelli, F., Kolbe, C., Häsler, L. M., et al. (2022) · Neuron · doi:10.1016/j.neuron.2021.12.016 · Cited by 65
Self-citationThe Importance of Complement-Mediated Immune Signaling in Alzheimer’s Disease Pathogenesis
Batista, A. F., Khan, K., Papavergi, M.-T., & Lemere, C. A. (2024) · International Journal of Molecular Sciences · doi:10.3390/ijms25020817 · Cited by 72
“Some evidence indicates that excessive brain inflammation is implicated in the pathogenesis of a number of neurological disorders [36], including AD, where increased levels of inflammatory mediators such as cytokines and chemokines are elevated in patients with the disorder [37,38].”
BackgroundSi, G., & Álvarez, A. (2020) · Medicinal Research Reviews · doi:10.1002/med.21722 · Cited by 61
“Reduced CSF levels of VEGF were also reported in subjects with positive tau pathology.(91) Although results of studies on circulating VEGF in AD are inconsistent, Alvarez et al.”
BackgroundBrosseron, F., Maaß, A., Kleineidam, L., Ravichandran, K. A., Kolbe, C., Wolfsgruber, S., Santarelli, F., Häsler, L. M., McManus, R. M., Ising, C., et al. (2023) · Alzheimer s Research & Therapy · doi:10.1186/s13195-022-01118-0 · Cited by 62
Self-citationDecreased CX3CL1 Levels in the Cerebrospinal Fluid of Patients With Alzheimer’s Disease
Perea, J. R., Lleó, A., Alcolea, D. A., Fortea, J., Ávila, J., & Bolós, M. (2018) · Frontiers in Neuroscience · doi:10.3389/fnins.2018.00609 · Cited by 58
Hegazy, S. H., Thomassen, J. Q., Rasmussen, I. J., Nordestgaard, B. G., Tybjærg‐Hansen, A., & Frikke‐Schmidt, R. (2022) · Alzheimer s & Dementia · doi:10.1002/alz.12568 · Cited by 56
Wu, C., Bawa, K. K., Ouk, M., Leung, N., Yu, D., Lanctôt, K. L., Herrmann, N., Pakosh, M. T., & Swardfager, W. (2020) · Ageing Research Reviews · doi:10.1016/j.arr.2020.101130 · Cited by 53
CHIT1 at Diagnosis Reflects Long‐Term Multiple Sclerosis Disease Activity
Oldoni, E., Smets, I., Mallants, K., Vandebergh, M., Van Horebeek, L., Poesen, K., Dupont, P., Dubois, B., & Goris, A. (2020) · Annals of Neurology · doi:10.1002/ana.25691 · Cited by 50
“CSF sTREM2 levels are increased in AD and mild cognitive impairment patients compared with controls and correlate strongly with tau pathology.(45) Although Piccio et al(12) reported elevated sTREM2 levels in MS patients compared to controls, we did not observe any correlation with disease activity.”
BackgroundObrocki, P., Khatun, A., Ness, D., Senkevich, K. A., Hanrieder, J., Capraro, F., Mattsson, N., Andréasson, U., Portelius, E., Ashton, N. J., et al. (2020) · Alzheimer s Research & Therapy · doi:10.1186/s13195-020-00586-6 · Cited by 51
Huang, Z., Hamblin, M. R., & Zhang, Q. (2024) · Alzheimer s Research & Therapy · doi:10.1186/s13195-024-01484-x · Cited by 54
“Studies in recent years have firmly established neuro-inflammation to be a central player in AD pathogenesis [84, 85].”
BackgroundMulticenter Alzheimer's and Parkinson's disease immune biomarker verification study
Brosseron, F., Kolbe, C., Santarelli, F., Carvalho, S., Antonell, A., Castro‐Gomez, S., Tacik, P., Namasivayam, A. A., Mangone, G., Schneider, R., et al. (2020) · Alzheimer's & Dementia · doi:10.1016/j.jalz.2019.07.018 · Cited by 47
Self-citationSoluble TREM2 and Inflammatory Proteins in Alzheimer’s Disease Cerebrospinal Fluid
Rauchmann, B., Sadlon, A., Perneczky, R., & Initiative, A. D. N. (2020) · Journal of Alzheimer s Disease · doi:10.3233/jad-191120 · Cited by 50
“IP-10, a biomarker known to be associated with tau pathology [32], was correlated with sTREM2 only in the A+TN+subgroup.”
Knapskog, A., Henjum, K., Idland, A., Eldholm, R. S., Persson, K., Saltvedt, I. T., Watne, L. O., Engedal, K., & Nilsson, L. N. G. (2020) · Scientific Reports · doi:10.1038/s41598-020-72878-8 · Cited by 53
Plasma VEGFA and PGF impact longitudinal tau and cognition in preclinical Alzheimer’s disease
Yang, H., Yau, W. W., Carlyle, B. C., Trombetta, B. A., Zhang, C. M., Shirzadi, Z., Schultz, A. P., Pruzin, J. J., Fitzpatrick, C. D., Kirn, D. R., et al. (2024) · Brain · doi:10.1093/brain/awae034 · Cited by 43
Albrecht, D. S., Sagare, A., Pachicano, M., Sweeney, M. D., Toga, A., Zlokovic, B., Chui, H., Joe, E., Schneider, L., Morris, J. C., et al. (2021) · Brain, Behavior, and Immunity · doi:10.1016/j.bbi.2021.01.010 · Cited by 37
“, 2018) and in those with mild cognitive impairment and clinical AD (Brosseron et al., 2018).”
BackgroundAdvantages and Pitfalls in Fluid Biomarkers for Diagnosis of Alzheimer’s Disease
Omar, S. H., & Preddy, J. (2020) · Journal of Personalized Medicine · doi:10.3390/jpm10030063 · Cited by 39
“Out of the several investigated inflammatory biomarkers, the diminished C-reactive protein (CRP) level and increased level of triggering receptor expressed on myeloid cells-2 (TREM-2) were observed in the CSF of the patient with AD compared to the normal elderly controls [98].”
Oral microbiome and serological analyses on association of Alzheimer's disease and periodontitis
Fu, K., Chiu, M., Wara‐aswapati, N., Yang, C., Chang, L., Guo, Y. L., Ni, Y., & Chen, Y. (2022) · Oral Diseases · doi:10.1111/odi.14348 · Cited by 38
Inflammatory pathway analytes predicting rapid cognitive decline in MCI stage of Alzheimer’s disease
Pillai, J. A., Bena, J., Bebek, G., Bekris, L. M., Bonner‐Jackson, A., Kou, L., Pai, A., Sørensen, L., Neilsen, M., Rao, S. M., et al. (2020) · Annals of Clinical and Translational Neurology · doi:10.1002/acn3.51109 · Cited by 34
Bellelli, F., Angioni, D., Arosio, B., Vellas, B. J., & Barreto, P. D. S. (2025) · Ageing Research Reviews · doi:10.1016/j.arr.2025.102699 · Cited by 34
Hayek, D., Ziegler, G., Kleineidam, L., Brosseron, F., Nemali, A., Vockert, N., Ravichandran, K. A., Betts, M. J., Peters, O., Schneider, L., et al. (2024) · Molecular Psychiatry · doi:10.1038/s41380-023-02387-3 · Cited by 32
“The resulting tissue maps were quality checked using CAT ’ s sample homogeneity check, which revealed one extreme outlier for GM and one for WM probability maps in our sample, which were excluded from the analyses ( fi nal N = 258).”
BackgroundMethodSelf-citationHuang, D., Wang, Y., Lv, J., Yan, Y., Hu, Y., Liu, C., Zhang, F., Wang, J., & Hao, D. (2020) · PeerJ · doi:10.7717/peerj.9009 · Cited by 30
“Biomedical substances that are involved in metabolic activities are tied to an individual’s biological or metabolic status; thus, circulating proteins are considered sensitive and specific markers of certain pathological states, including abnormal bone metabolism (Brosseron et al., 2018; Shao et al., 2019).”
BackgroundFluid Candidate Biomarkers for Alzheimer’s Disease: A Precision Medicine Approach
Prete, E. D., Beatino, M. F., Campese, N., Giampietri, L., Siciliano, G., Ceravolo, R., & Baldacci, F. (2020) · Journal of Personalized Medicine · doi:10.3390/jpm10040221 · Cited by 29
“Actually, CSF YKL-40 differentiated AD from DLB, PD [160], FTLD [161], and non-AD MCI [162] with only a moderate diagnostic accuracy.”
BackgroundKnowledge gaps in Alzheimer's disease immune biomarker research
Morgan, D., & Mielke, M. M. (2021) · Alzheimer s & Dementia · doi:10.1002/alz.12342 · Cited by 26
Daniilidou, M., Holleman, J., Hagman, G., Kåreholt, I., Aspö, M., Brinkmalm, A., Zetterberg, H., Blennow, K., Solomon, A., Kivipelto, M., et al. (2024) · Translational Psychiatry · doi:10.1038/s41398-024-03072-x · Cited by 27
Chen, R., Zhang, Q., Yan, Y., Zhang, Y., & Zhang, T. (2020) · Molecular Neurobiology · doi:10.1007/s12035-020-02219-3 · Cited by 23
Advances in neuroimaging to support translational medicine in dementia
Cope, T., Weil, R. S., Düzel, E., Dickerson, B. C., & Rowe, J. B. (2021) · Journal of Neurology Neurosurgery & Psychiatry · doi:10.1136/jnnp-2019-322402 · Cited by 25
Wang, R., Zhan, Y., Zhu, W., Yang, Q., & Pei, J. (2024) · Frontiers in Aging Neuroscience · doi:10.3389/fnagi.2024.1407980 · Cited by 25
Elevated sTREM2 and NFL levels in patients with sepsis associated encephalopathy
Orhun, G., Esen, F., Yılmaz, V., Ulusoy, C. A., Şanlı, E., Yıldırım, E., Gurvit, H. I., Özcan, P. E., Sencer, S., Bebek, N., et al. (2021) · International Journal of Neuroscience · doi:10.1080/00207454.2021.1916489 · Cited by 23
Tau-Mediated Dysregulation of Neuroplasticity and Glial Plasticity
Koller, E. J., & Chakrabarty, P. (2020) · Frontiers in Molecular Neuroscience · doi:10.3389/fnmol.2020.00151 · Cited by 23
“elevation is not reliable enough for AD diagnosis, it may be indicative of microglial activity (Suárez-Calvet et al., 2016b; Brosseron et al., 2018).”
BackgroundInfluentialBrosseron, F., Kleemann, K. L., Kolbe, C., Santarelli, F., Castro‐Gomez, S., Tacik, P. M., Latz, E., Jessen, F., & Heneka, M. T. (2020) · Journal of Neurochemistry · doi:10.1111/jnc.15175 · Cited by 22
“…previously described as highly related to CSF tau levels in this cohort [macrophage migration inhibitory factor, (MIF), soluble vascular endothelial growth factor receptor (sVEGFR), sTREM2, soluble vascular cell adhesion molecule 1 (sVCAM-1), sICAM-1, and complement C1q) (Brosseron et al., 2018).”
BackgroundMethodInfluentialSelf-citationKumari, E., Xu, A., Chen, R., Yan, Y., Yang, Z. R., & Zhang, T. (2022) · Experimental Neurology · doi:10.1016/j.expneurol.2022.114231 · Cited by 21
Contreras, J. A., Aslanyan, V., Albrecht, D., Mack, W. J., Initiative, A. D. N., & Pa, J. (2022) · Alzheimer s & Dementia Diagnosis Assessment & Disease Monitoring · doi:10.1002/dad2.12346 · Cited by 20
AMBAR, an Encouraging Alzheimer's Trial That Raises Questions
Loeffler, D. A. (2020) · Frontiers in Neurology · doi:10.3389/fneur.2020.00459 · Cited by 20
Lyu, M., Liu, H., Ye, Y., & Yin, Z. (2020) · Biophysical Chemistry · doi:10.1016/j.bpc.2020.106367 · Cited by 19
Li, T., Initiative, A. D. N., Lyu, D., & Liu, F. (2022) · Journal of Alzheimer s Disease · doi:10.3233/jad-220598 · Cited by 17
Sandoval, C., Lee, J., Toth, B., Nagaraj, R., Schauer, S. P., Hoffman, J. C., Calderon, E., Kollmorgen, G., Bohorquez, S. M. S., Monteiro, C., et al. (2024) · Alzheimer s & Dementia · doi:10.1002/alz.14271 · Cited by 18
APOE4 Copy Number-Dependent Proteomic Changes in the Cerebrospinal Fluid1
Berger, M., Cooter, M., Roesler, A. S., Chung, S., Park, J., Modliszeski, J. L., VanDusen, K. W., Thompson, J. W., Moseley, M. A., Devinney, M. J., et al. (2020) · Journal of Alzheimer s Disease · doi:10.3233/jad-200747 · Cited by 15
Burgelman, M., Dujardin, P., Vandendriessche, C., & Vandenbroucke, R. E. (2023) · Frontiers in Immunology · doi:10.3389/fimmu.2022.1055050 · Cited by 16
“Conversely, unchanged levels were shown for C1q (39, 40), clusterin (50) and fH (39, 44, 46).”
BackgroundMeyer, P., Savard, M., Poirier, J., Morgan, D., Breitner, J. C. S., & Initiative, A. D. N. (2019) · Alzheimer s & Dementia · doi:10.1016/j.jalz.2019.05.007 · Cited by 15
“We know of no present evidence of similar mechanisms in human studies, notably because these efforts have encountered difficulties in reliable measurement of the most important markers of immune activation in CSF [77,78].”
Zhuo, Y., Fu, X., Jiang, Q., Lai, Y., Gu, Y., Fang, S., Chen, H., Liu, C., Pan, H., Wu, Q., et al. (2023) · European Journal of Pharmacology · doi:10.1016/j.ejphar.2023.175895 · Cited by 15
Ekman, U., Ferreira, D., Muehlboeck, J., Wallert, J., Rennie, A., Eriksdotter, M., Wahlund, L., & Westman, E. (2020) · BMC Geriatrics · doi:10.1186/s12877-020-1478-3 · Cited by 15
Increased YKL-40 but Not C-Reactive Protein Levels in Patients with Alzheimer’s Disease
Blanco-Palmero, V. A., Rubio‐Fernández, M., Antequera, D., Villarejo‐Galende, A., Pérez-Molina, J. A., Ferrer, I., Bartolomé, F. B., & Carro, E. (2021) · Biomedicines · doi:10.3390/biomedicines9091094 · Cited by 18
“Furthermore, the CRP levels in CSF remained unchanged in PD patients when compared with healthy subjects [26,32].”
BackgroundResultSabbagh, M. N., Cummings, J. L., Ballard, C. G., van der Flier, W. M., Heneka, M. T., Holst, J. J., Knudsen, L. B., Salloway, S., Tansey, M. G., & Drucker, D. J. (2025) · Nature Aging · doi:10.1038/s43587-025-01029-3 · Cited by 15
“%) were white; and 59.7% and 54.5% were receiving AD medication, respectively.”
InfluentialSelf-citationInflammation in the CNS: Understanding Various Aspects of the Pathogenesis of Alzheimer's Disease
Doroszkiewicz, J., Mroczko, P., & Kulczyńska‐Przybik, A. (2021) · Current Alzheimer Research · doi:10.2174/1567205018666211202143935 · Cited by 14
Pan, R., Initiative, A. D. N., Luo, S., Huang, Q., Li, W., Cai, T., Lai, K., & Shi, X. (2022) · Journal of Alzheimer s Disease · doi:10.3233/jad-220002 · Cited by 13
Moyse, E., Haddad, M., Benlabiod, C., Ramassamy, C., & Krantic, S. M. (2019) · Current Alzheimer Research · doi:10.2174/1567205016666191106094356 · Cited by 14
Zhou, W., Zhou, Y., & Li, J. (2023) · Journal of Clinical Medicine · doi:10.3390/jcm12103589 · Cited by 12
Predicting neurodegeneration from sleep related biofluid changes
Yang, Y., Kim, W. S., Michaelian, J. C., Lewis, S. J. G., Phillips, C. L., D'Rozario, A. L., Chatterjee, P., Martins, R. N., Grunstein, R. R., Halliday, G. M., et al. (2023) · Neurobiology of Disease · doi:10.1016/j.nbd.2023.106369 · Cited by 10
“They have also been shown to be increased in MCI and dementia (Brosseron et al., 2018; Darweesh et al., 2018; Havekes et al., 2019; Swardfager et al., 2010), and also cognitively unimpaired older adults with higher self-reported sleepiness scores (Carvalho et al., 2022).”
BackgroundBeyond amyloid: nanobody-mediated neuroinflammatory therapy for Alzheimer’s disease
Amniouel, S., Suh, J., Zheng, W. H., & Zhang, Q. (2025) · Translational Neurodegeneration · doi:10.1186/s40035-025-00513-5 · Cited by 11
“To address the concern of silencing necessary immune responses, our proposed therapy aims to target specific inflammatory mediators that are known to be deleterious in AD such as IL-1β and TNF-α [45, 46], while preserving the beneficial functions of microglia and astrocytes.”
Pilot proteomic analysis of cerebrospinal fluid in Alzheimer's disease
McKetney, J., Panyard, D. J., Johnson, S. C., Carlsson, C. M., Engelman, C. D., & Coon, J. J. (2021) · PROTEOMICS - CLINICAL APPLICATIONS · doi:10.1002/prca.202000072 · Cited by 9
Teipel, S. J., Dyrba, M., Kleineidam, L., Brosseron, F., Levin, F., Bruno, D., Büerger, K., Cosma, N. C., Schneider, L., Düzel, E., et al. (2024) · Alzheimer s & Dementia Diagnosis Assessment & Disease Monitoring · doi:10.1002/dad2.12510 · Cited by 8
Self-citationCerebrospinal Fluid Inflammatory Markers in Alzheimer’s Disease: Influence of Comorbidities
Wang, Y., Emre, C., Gyllenhammar-Schill, H., Fjellman, K., Eyjolfsdottir, H., Eriksdotter, M., Schultzberg, M., & Hjorth, E. (2021) · Current Alzheimer Research · doi:10.2174/1567205018666210330162207 · Cited by 8
Hu, S., Pan, N., Liu, C., Wang, Y., & Zhang, T. (2021) · Frontiers in Aging Neuroscience · doi:10.3389/fnagi.2021.775432 · Cited by 8
Phadke, L., Lau, D. H. W., Aghaizu, N. D., Ibarra, S., Navarrón, C. M., Granat, L., Magno, L., Whiting, P. J., & Jolly, S. (2022) · Frontiers in Aging Neuroscience · doi:10.3389/fnagi.2022.1056067 · Cited by 8
“In addition, studies have found that elevated levels of inflammatory markers are present in patients with AD (Brosseron et al., 2018), and a number of AD risk genes are associated with innate immune functions (Efthymiou and Goate, 2017; Bellenguez et al.”
BackgroundSoluble TREM2 in body fluid in Alzheimer’s disease and Parkinson’s disease
Gu, L., Shu, H., & Wang, Y. (2023) · Neurological Sciences · doi:10.1007/s10072-023-06729-5 · Cited by 7
“N = 7 studies (including 531 AD patients and 553 HCs) [13, 14, 16, 19, 20, 26, 37] compared sTREM2 level in plasma between AD patients and HCs.”
ResultSexual dimorphisms in innate immune activation markers in predementia Alzheimer’s disease
Knudtzon, S. L., Nordengen, K., Pålhaugen, L., Gísladóttir, B., Jarholm, J. A., Bråthen, G., Skogseth, R. E., Waterloo, K. K., Selnes, P., Fladby, T., et al. (2025) · Brain Communications · doi:10.1093/braincomms/fcaf161 · Cited by 8
“24 found that males had significantly higher concentrations of several inflammatory CSF proteins, including MCP-1 and IL-6, consistent with our results.”
InfluentialAlilou, S., Valizadeh, P., KamaliZonouzi, S., Salabat, D., Jannatdoust, P., Amanollahi, M., Rashidi, F., Rezaie, S., Delavari, S., & Aarabi, M. H. (2024) · Brain Behavior and Immunity Integrative · doi:10.1016/j.bbii.2024.100092 · Cited by 7
Microglia protein profiles in CSF across Alzheimer’s disease clinical stages
Blujdea, E. R., van Bokhoven, P., Adami, P. V. M., Marshe, V. S., Vromen, E., Hok‐A‐Hin, Y. S., Boiten, W. A., Irwin, D. J., Chen‐Plotkin, A. S., Lemstra, A. W., et al. (2026) · Nature Aging · doi:10.1038/s43587-026-01088-0 · Cited by 7
“26–30), MIF 27 and sAXL 10 , that are elevated in earlier stages of AD, possibly as a protective response to the accumulation of amyloid pathology 10,25,28,31–33 .”
Self-citationGhanbarian, E., Khorsand, B., Petersen, K. K., Nallapu, B. T., Sajjadi, S. A., Lipton, R. B., Ezzati, A., & Initiative, A. D. N. (2025) · Journal of Alzheimer s Disease · doi:10.1177/13872877251335915 · Cited by 8
“11 However, studies examining the association between CSF in fl ammatory markers and the progression of cognitive decline over time have produced inconsistent and sometimes con fl icting results.”
CSF biomarkers of neuroinflammation are associated with regional atrophy
Özlü, S., Dyrba, M., Grazia, A., Brosseron, F., Büerger, K., Dechent, P., Düzel, E., Ewers, M., Fließbach, K., Glanz, W., et al. (2025) · Journal of Neurology · doi:10.1007/s00415-025-13564-5 · Cited by 3
Self-citationBifurcations in coupled amyloid-β aggregation-inflammation systems
Chakrabarti, K. S., Bakhtiari, D., & Rezaei‐Ghaleh, N. (2024) · npj Systems Biology and Applications · doi:10.1038/s41540-024-00408-7 · Cited by 3
Gutierrez, J., Kurz, C., Sandoval, C., Edmonds, R., Bittner, T., Perneczky, R., & Biever, A. (2024) · Journal of Alzheimer s Disease · doi:10.3233/jad-240287 · Cited by 3
“3 – 8 This suggests that neuroinflammation represents a third pathological hallmark of AD, although it is controversial whether immune cells exert beneficial or detrimental activities in the pathogenesis of AD.”
BackgroundMethodSex differences in CSF biomarkers of Alzheimer’s disease
Mielke, M. M. (2021) · Elsevier eBooks · doi:10.1016/b978-0-12-819344-0.00012-0 · Cited by 4
Recent Advances in Neurodegeneration
Borreca, A. (2019) · IntechOpen eBooks · doi:10.5772/intechopen.71995 · Cited by 3
Ghanbarian, E., Khorsand, B., Petersen, K. K., Nallapu, B. T., Sajjadi, S. A., Lipton, R. B., & Ezzati, A. (2024) · medRxiv · doi:10.1101/2024.11.13.24317270 · Cited by 3
Solorzano, C. S., Festari, C., Mirabelli, P., Mombelli, E., Coppola, L., Luongo, D., Naviglio, D., Soricelli, A., Quattrini, G., Salvatore, M., et al. (2025) · Frontiers in Cellular Neuroscience · doi:10.3389/fncel.2025.1550333 · Cited by 3
Tubi, M. A., Wheeler, K. V., Matsiyevskiy, E., Hapenney, M., Mack, W. J., Chui, H. C., King, K. S., Thompson, P. M., & Braskie, M. N. (2023) · Neurobiology of Aging · doi:10.1016/j.neurobiolaging.2023.08.002 · Cited by 2
Molecular Basis of Neurodegeneration: Lessons from Alzheimer’s and Parkinson’s Diseases
Zolezzi, J. M., Candia, S. B., & Inestrosa, N. C. (2019) · IntechOpen eBooks · doi:10.5772/intechopen.81270 · Cited by 2
Linking evidence for targeted blood biomarkers in post-stroke cognitive impairment and dementia
Hong, J., Mun, K. T., Kern, K. C., Thirion, M. L., & Hinman, J. D. (2025) · Frontiers in Stroke · doi:10.3389/fstro.2024.1491542 · Cited by 1
Yu, R., Suraev, A. S., Vidal, V., Kong, S. D., Zachariae, R. H., Piccio, L. M., Heneka, M. T., Naismith, S. L., & Michaelian, J. C. (2026) · Molecular Psychiatry · doi:10.1038/s41380-026-03787-x · Cited by 1
Self-citationAzadovich, A. P., Oralov, B., Sherzod, K., Kudeshova, G. T., Akmalovna, A. F., Tajimuratovna, B. U., Kambarova, O., Raupov, F., Baxtiyor, S., Jurabek, Y., et al. (2026) · Clinica Chimica Acta · doi:10.1016/j.cca.2026.121010 · Cited by 1
Sandoval, C., Lee, J., Tóth, B. I., Nagaraj, R., Schauer, S. P., Hoffman, J. C., Kollmorgen, G., Monteiro, C., Teng, E., Hanson, J. E., et al. (2024) · medRxiv · doi:10.1101/2024.04.13.24305768 · Cited by 1
Kozloski, G. A. (2019) · Materials and Methods · doi:10.13070/mm.en.9.2758
Kozloski, G. A. (2019) · Materials and Methods · doi:10.13070/mm.en.9.2844
Emerging Roles of TREM2 in Neurodegenerative Diseases
Kabir, M. T. (2022) · Springer eBooks · doi:10.1007/978-981-16-7606-2_7
Metadata
- Authors
- Brosseron, F., Traschütz, A., Widmann, C. N., Kummer, M. P., Tacik, P., Santarelli, F., Jessen, F., & Heneka, M. T.
- Affiliations
- German Center for Neurodegenerative Diseases (DE)
- University of Bonn (DE)
- University of Cologne (DE)
- Corresponding author
- Heneka, Michael T.
- ORCID
- Venue
- Alzheimer's Research & Therapy
- Published
- 2018-02-26
- Volume
- 10
- Issue
- 1
- Pages
- 25-25
- ISSN
- 1758-9193 (ISSN-L)
- PMC
- PMC5828084
- OpenAlex
- W2796088161
- Cited by
- 113
- References
- 51
- Citations by year
- 2026: 6 · 2025: 9 · 2024: 16 · 2023: 10 · 2022: 12 · 2021: 16 · 2020: 29 · 2019: 10 · 2018: 5
- FWCI
- 11.72
- Type
- journal article
- Language
- en
- Open access
- gold
- doi.org
- Licence
- cc-by
- Locations
- Alzheimer s Research & Therapy (publishedVersion, cc-by)
- PubMed Central (publishedVersion, cc-by)
- PubMed (publishedVersion)
- Kölner Universitäts PublikationsServer (Universität zu Köln) (publishedVersion)
- Open Repository and Bibliography (University of Luxembourg) (submittedVersion, other-oa)
- DOAJ (DOAJ: Directory of Open Access Journals) (submittedVersion, cc-by-sa)
- DZNE Pub (submittedVersion, cc-by)
- Zenodo (CERN European Organization for Nuclear Research) (submittedVersion, cc-by)
- Funders
- EU/EFPIA/(Associated Partner) Innovative Medicines Initiative (2) Joint Undertaking (115568)
- European Union’s Seventh Framework Programme (FP7/2007-2013)
- INMiND (HEALTH-F2-2011-278850 TP21)
- Deutsche Forschungsgemeinschaft (KFO177, TP4)
- Topics
- Health Sciences › Medicine › Psychiatry and Mental health › Dementia and Cognitive Impairment Research
- Life Sciences › Neuroscience › Cellular and Molecular Neuroscience › Alzheimer's disease research and treatments
- Life Sciences › Neuroscience › Neurology › Neuroinflammation and Neurodegeneration Mechanisms
- Keywords
- Alzheimer's disease, cerebrospinal fluid biomarkers, neuroinflammation, inflammatory proteins, C-reactive protein, soluble TREM2, amyloid pathology, tau pathology, mild cognitive impairment, diagnostic accuracy, apolipoprotein E
- MeSH terms
- Adult, Aged, Aged, 80 and over, Alzheimer Disease, C-Reactive Protein, Cerebrospinal Fluid Proteins, Female, Humans, Male, Membrane Glycoproteins, Middle Aged, Receptors, Immunologic, Cohort Studies, Cytokines, Amyloid beta-Peptides, tau Proteins, Statistics, Nonparametric, Vascular Endothelial Growth Factor A
About these checks
Registry, retraction, Cites and statistics results are computed, not judged, with one exception: a printed reference that no index lists is read once by a model before it counts as a citation error. Claims are extracted by a model and kept only when their quote appears verbatim in the text; each cited source is then checked, with a model’s help, for whether it says what the claim relies on. Those verdicts can be wrong — read the claim’s quote and the cited source before relying on one.
Statistics and arithmetic are recomputed, not judged.
Confidence bands are shown only for fields calibrated on our annotated test set. None is calibrated yet, so no band is shown.
What counts as a claim ›How we measure confidence ›How we check this ›
Are you an author, or do you see a problem with this page? Request a review
