

The DOI matches its Crossref record; 105 of the 105 references it cites were found in a registry or an index.
Principles of fluid management and stewardship in septic shock: it is time to consider the four D’s and the four phases of fluid therapy
Open accessAbstract
In patients with septic shock, the administration of fluids during initial hemodynamic resuscitation remains a major therapeutic challenge. We are faced with many open questions regarding the type, dose and timing of intravenous fluid administration. There are only four major indications for intravenous fluid administration: aside from resuscitation, intravenous fluids have many other uses including maintenance and replacement of total body water and electrolytes, as carriers for medications and for parenteral nutrition. In this paradigm-shifting review, we discuss different fluid management strategies including early adequate goal-directed fluid management, late conservative fluid management and late goal-directed fluid removal. In addition, we expand on the concept of the "four D's" of fluid therapy, namely drug, dosing, duration and de-escalation. During the treatment of patients with septic shock, four phases of fluid therapy should be considered in order to provide answers to four basic questions. These four phases are the resuscitation phase, the optimization phase, the stabilization phase and the evacuation phase. The four questions are "When to start intravenous fluids?", "When to stop intravenous fluids?", "When to start de-resuscitation or active fluid removal?" and finally "When to stop de-resuscitation?" In analogy to the way we handle antibiotics in critically ill patients, it is time for fluid stewardship.
Overview
The claims and statistics of this paper haven’t been checked yet.
Run the check — free, no account needed. It reads the open-access text and checks the sources it cites.
Integrity signals
Registry
Cites
Statistics
Figures
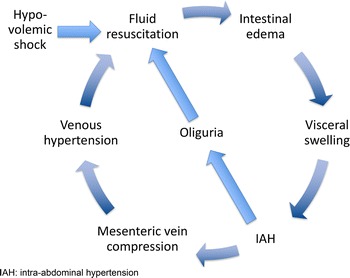
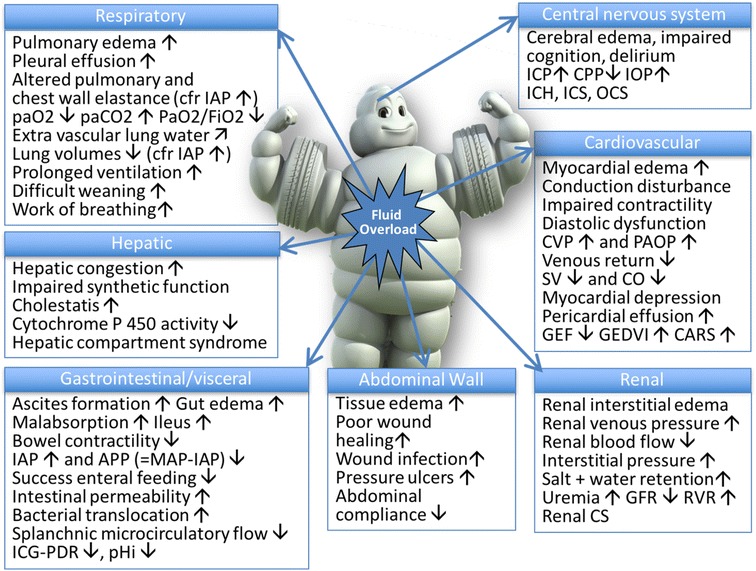
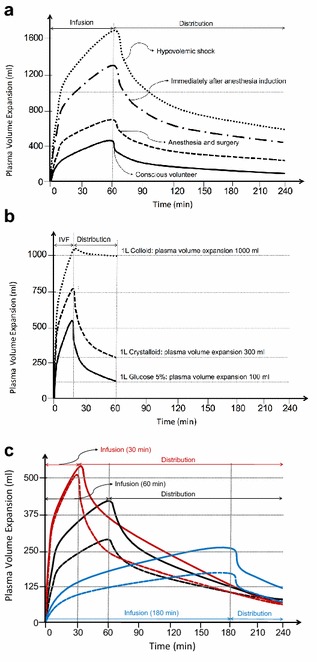
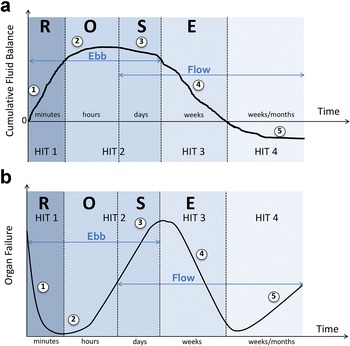
Verification
Claims the paper makes
The claims and statistics of this paper haven’t been checked yet.
Run the check — free, no account needed. It reads the open-access text and checks the sources it cites.
Claims other papers make about this one
Each is checked against this paper’s own text: does it say what the citing paper says it does?
The source backs part of the claim, not all of it — or backs it for a different population, condition or comparison.
In the citing paper
“Poor or incomplete source control may additionally lead to a state of ongoing capillary leak and fluid accumulation, referred to as GIPS (global increased permeability syndrome) [8].”
From Nutrition in Sepsis: A Bench-to-Bedside Review. (2020) · cites this paper as [8]
Experimental — accuracy not yet measuredThe cited source says what the claim attributes to it.
In the citing paper
“since nutrition may also contribute to fluid accumulation [8].”
From Nutrition in Sepsis: A Bench-to-Bedside Review. (2020) · cites this paper as [8]
Self-check
Percentages, sums and reported differences re-computed from the paper’s own numbers.
The self-check needs the paper’s full text.
Citations
Cites
Early goal-directed therapy in the treatment of severe sepsis and septic shock
Rivers, E., Nguyen, B., Havstad, S., Ressler, J., Muzzin, A., Knoblich, B., Peterson, E., & Tomlanovich, M. (2001) · New England Journal of Medicine · doi:10.1056/nejmoa010307 · Cited by 10,743
Surviving Sepsis Campaign: International Guidelines for Management of Severe Sepsis and Septic Shock
Dellinger, R. P., Levy, M. M., Rhodes, A., Annane, D., Gerlach, H., Opal, S. M., Sevransky, J. E., Sprung, C. L., Douglas, I. S., Jaeschke, R., et al. (2013) · Critical Care Medicine · doi:10.1097/ccm.0b013e31827e83af · Cited by 9,694
Intravenous Fluids and Acute Kidney Injury
Ding, X., Cheng, Z., & Qian, Q. (2017) · Blood Purification · doi:10.1159/000452702 · Cited by 6,869
Surviving Sepsis Campaign: International guidelines for management of sepsis and septic shock: 2016.
Rhodes, A., Evans, L. E., Alhazzani, W., Levy, M. M., Antonelli, M., Ferrer, R., Kumar, A., Sevransky, J. E., Sprung, C. L., Nunnally, M. E., et al. (2017) · Intensive Care Medicine · doi:10.1007/s00134-017-4683-6 · Cited by 6,621
Sepsis in European intensive care units: Results of the SOAP study*
Vincent, J., Sakr, Y. L., Sprung, C. L., Ranieri, V. M., Reinhart, K., Gerlach, H., Moreno, R. P., Carlet, J. M., Gall, J. L., & Payen, D. M. (2006) · Critical Care Medicine · doi:10.1097/01.ccm.0000194725.48928.3a · Cited by 2,823
A randomized trial of protocol-based care for early septic shock.
The ProCESS Investigators (2014) · New England Journal of Medicine · doi:10.1056/nejmoa1401602 · Cited by 2,414
Time to treatment and mortality during mandated emergency care for sepsis.
Seymour, C. W., Gesten, F., Prescott, H. C., Friedrich, M. E., Iwashyna, T. J., Phillips, G. S., Lemeshow, S., Osborn, T., Terry, K. M., & Levy, M. M. (2017) · New England Journal of Medicine · doi:10.1056/nejmoa1703058 · Cited by 2,225
Goal-Directed Resuscitation for Patients with Early Septic Shock
The ARISE Investigators and the ANZICS Clinical Trials Group (2014) · New England Journal of Medicine · doi:10.1056/nejmoa1404380 · Cited by 2,055
Hydroxyethyl Starch 130/0.42 versus Ringer's Acetate in Severe Sepsis
Perner, A., Haase, N., Guttormsen, A. B., Tenhunen, J. J., Klemenzson, G., Åneman, A., Madsen, K. R., Møller, M. H., Elkjær, J. M., Poulsen, L. M., et al. (2012) · New England Journal of Medicine · doi:10.1056/nejmoa1204242 · Cited by 1,808
Hydroxyethyl Starch or Saline for Fluid Resuscitation in Intensive Care
Myburgh, J., Finfer, S. R., Bellomo, R., Billot, L., Cass, A., Gattas, D. J., Glass, P., Lipman, J., Liu, B. C., McArthur, C. J., et al. (2012) · New England Journal of Medicine · doi:10.1056/nejmoa1209759 · Cited by 1,681
Research works printed but not linked: 1
- Monnet, 2016, Prediction of fluid responsiveness: an update, Ann Intensive Care, 6, 111, 10.1186/s13613-016-0216-7 · DOI
Cited by
Sorted by citations
Items 301–400 of 643
Krzych, Ł. J., Wiórek, A., Zatorski, P., Gruca, K., Stefańska-Wronka, K., & Trzebicki, J. (2021) · Healthcare · doi:10.3390/healthcare9020140 · Cited by 4
Bogaerts, E., Ferdinande, B., Palmers, P., Malbrain, M. L. N. G., Regenmortel, N. V., Wilmer, A. P., Lemmens, R., Janssens, S. P., Nijst, P., Deyne, C. D., et al. (2021) · Resuscitation · doi:10.1016/j.resuscitation.2021.08.044 · Cited by 4
Self-citationDo we need a 6D’s Framework of Nutritional Stewardship in critical care?
Pisani, D., Navalesi, P., & Rosa, S. D. (2021) · Journal of Anesthesia Analgesia and Critical Care · doi:10.1186/s44158-021-00009-4 · Cited by 4
Barhight, M. F., Sanchez-Pinto, L. N., & Basu, R. K. (2022) · Critical Care Explorations · doi:10.1097/cce.0000000000000792 · Cited by 4
Papaioannou, V. E., & Papaioannou, T. G. (2024) · Journal of Personalized Medicine · doi:10.3390/jpm14010070 · Cited by 4
25th International Symposium on Infections in the Critically Ill Patient
Artigas, A., Carlet, J. M., Ferrer, R., Niederman, M. S., & Torres, A. (2020) · Medical Sciences · doi:10.3390/medsci8010013 · Cited by 4
Point of care ultrasound: a clinical decision support tool for COVID-19
Desai, S. R., Wong, J., Suhitharan, T., Chan, Y. W., & Ng, S.-Y. (2021) · Singapore Medical Journal · doi:10.11622/smedj.2021098 · Cited by 4
Evidence for the Application of Sepsis Bundles in 2021
Plata-Menchaca, E. P., Ruiz‐Rodríguez, J. C., & Ferrer, R. (2021) · Seminars in Respiratory and Critical Care Medicine · doi:10.1055/s-0041-1733899 · Cited by 4
Jeong, H., Park, I., Lee, J. H., Kim, D.-S., Baek, S., Kim, S., & Jo, Y. H. (2022) · Intensive Care Medicine Experimental · doi:10.1186/s40635-022-00480-5 · Cited by 4
Stepwise fluid management in critical illness
Dessap, A. M., & Cecconi, M. (2025) · Intensive Care Medicine · doi:10.1007/s00134-025-08263-8 · Cited by 4
Sallee, C. J., Fitzgerald, J. C., Smith, L., Angelo, J., Daniel, M. C., Gertz, S. J., Hsing, D. D., Mahadeo, K. M., McArthur, J. A., Rowan, C. M., et al. (2022) · Journal of Pediatric Intensive Care · doi:10.1055/s-0042-1757480 · Cited by 3
Comprehensive Fluid Therapy in Critical Care: Guidelines and Best Practices for Fluid Stewardship
Malbrain, M. L. N. G. (2025) · Springer eBooks · doi:10.1007/978-3-031-77335-8_43 · Cited by 3
Self-citationLubis, A. P., Govardi, E., Khairani, M., Elfazi, T. S., & Akbar, H. Z. (2025) · Journal of Cellular & Molecular Anesthesia · doi:10.5812/jcma-148524 · Cited by 3
Briassoulis, G. C., Antonopoulou, T., Velegraki, J., Ilia, S., & Kondili, Ε. (2025) · Life · doi:10.3390/life15121900 · Cited by 3
Sinatra, N., Cuttone, G., Testa, T. S., Via, L. L., Rubulotta, F. M., Abrignani, M. G., Zumbino, C., Mulè, G., Geraci, G., & Carollo, C. (2026) · Life · doi:10.3390/life16010151 · Cited by 3
Ripollés‐Melchor, J., Espinosa, Á. V., Gurumeta, A. A., & Malbrain, M. L. N. G. (2026) · British Journal of Anaesthesia · doi:10.1016/j.bja.2025.12.043 · Cited by 3
Self-citationTwenty-five years of septic shock hemodynamic resuscitation trials: a conceptual perspective
Glenn Hernández, P., Hunsicker, O., Backer, D. D., Angus, D., Bakker, J. H., Basmaji, J., Castro, R., Chew, M. S., Hamzaoui, O., Malbrain, M. L. N. G., et al. (2026) · Critical Care · doi:10.1186/s13054-026-06201-8 · Cited by 3
Self-citationNgwenyama, T. R. (2021) · Advances in Small Animal Care · doi:10.1016/j.yasa.2021.07.005 · Cited by 6
Trigkidis, K., Routsi, C., Kokkoris, S., Kotanidou, A., anon, C., & Kokkoris, S. (2024) · Journal of Critical Care · doi:10.1016/j.jcrc.2024.154905 · Cited by 3
Sneyers, B., Nyssen, C., Bulpa, P., Michaux, I., Lacrosse, D., Dubois, P. E., Rotens, T., & Spinewine, A. (2024) · International Journal of Clinical Pharmacy · doi:10.1007/s11096-024-01816-9 · Cited by 3
Pfaff, A., Butty, E. M., Rozanski, E. A., deLaforcade, A. M., Hicks, J. M., & Berlin, N. (2025) · Journal of Veterinary Internal Medicine · doi:10.1111/jvim.70132 · Cited by 3
Aïssaoui, Y., Jozwiak, M., Bouchama, A., Bennjakhoukh, H., Bencharfa, B., Didi, M., Abouqal, R., & Belhadj, A. (2025) · Journal of Clinical Monitoring and Computing · doi:10.1007/s10877-025-01320-z · Cited by 3
Modern views on infusion of crystalloids in intensive care
Babayants, A. V., Игнатенко, О. В., Zinina, E. P., & Kaledina, I. V. (2021) · Russian Journal of Anesthesiology and Reanimatology · doi:10.17116/anaesthesiology202105149 · Cited by 3
Hemodynamic effects of different fluid volumes for a fluid challenge in septic shock patients
Yang, T., Weng, L., Jiang, W., Li, S., & Du, B. (2021) · Chinese Medical Journal · doi:10.1097/cm9.0000000000001919 · Cited by 3
Zapata, L., Guía, C., Gómez, R., Paredes, T. G., Colinas, L., Portugal-Rodríguez, E., Rodado, I., Leache, I., Fernández-Ferreira, A., Hermosilla-Semikina, I., et al. (2022) · Medicina Intensiva (English Edition) · doi:10.1016/j.medine.2022.03.001 · Cited by 3
Continuous Venous-Arterial Doppler Ultrasound During a Preload Challenge
Kenny, J. S., Gibbs, S. O., Johnston, D., Hofer, L. M., Rae, E., Clarke, G., Eibl, J. K., Nalla, B. P., & Atoui, R. (2023) · Journal of Visualized Experiments · doi:10.3791/64410 · Cited by 3
Identification of medication classes associated with intensive care unit readmissions
Meckel, J., Benanti, G. E., Schomer, K. J., Adams, J. Y., & Parker, P. L. (2023) · JACCP JOURNAL OF THE AMERICAN COLLEGE OF CLINICAL PHARMACY · doi:10.1002/jac5.1766 · Cited by 3
Impact of Fluid Balance on Intensive Care Unit Length of Stay in Critically Ill Trauma Patients
Bright, T. V., Johnson, D. W., Humanez, J. C., Husty, T., Crandall, M. L., & Shald, E. A. (2023) · The American Surgeon · doi:10.1177/00031348231161077 · Cited by 3
Introduction to Fluid Stewardship
Wong, A. V.-K., Wilkinson, J., Nasa, P., Malbrain, L., & Malbrain, M. L. N. G. (2023) · Springer eBooks · doi:10.1007/978-3-031-42205-8_27 · Cited by 3
Self-citationBedi, P. S., Pahwa, B., Hooda, B., & Dwivedi, D. (2019) · International Journal of Research in Medical Sciences · doi:10.18203/2320-6012.ijrms20195535 · Cited by 3
Garcia-Montilla, R. J., Mukundan, S. V., Heitner, S. B., & Khan, A. (2021) · Echocardiography · doi:10.1111/echo.14970 · Cited by 3
Zhao, Z., Zhang, Z., Lin, Q., Shen, L., Wang, P., Zhang, S., Xia, Z., Li, F., Xing, Q., & Zhu, B. (2022) · Frontiers in Medicine · doi:10.3389/fmed.2022.862226 · Cited by 3
Bruce-Hickman, D., Lim, Z. Y., Lim, H. Y., Khan, F., Rastogi, S., Tan, C. K., & Ngoh, C. L. Y. (2023) · Critical Care and Resuscitation · doi:10.1016/j.ccrj.2023.04.006 · Cited by 3
Suyata, M. P., Arif, S. K., Tanra, A. H., & Muchtar, F. (2023) · Bali Medical Journal · doi:10.15562/bmj.v12i1.4224 · Cited by 3
Kidney Failure Associated with Polycompartment Syndrome
Minini, A., Rola, P., & Malbrain, M. L. N. G. (2020) · Hot topics in acute care surgery and trauma · doi:10.1007/978-3-030-55378-4_14 · Cited by 3
Self-citationTen physiological commandments for severe head injury
Godoy, D. A., Badenes, R., & Murillo-Cabezas, F. (2021) · Revista Española de Anestesiología y Reanimación (English Edition) · doi:10.1016/j.redare.2020.09.007 · Cited by 3
Kim, J. S., & Han, B. G. (2020) · Kidney Research and Clinical Practice · doi:10.23876/j.krcp.20.229 · Cited by 3
Fluid Management in Kidney Disease Patients for Nontransplant and Transplantation Surgeries
Sam, A. F., Sahu, S., & Ponnappan, K. T. (2021) · Bali Journal of Anesthesiology · doi:10.4103/bjoa.bjoa_203_20 · Cited by 2
Hemodynamic Monitoring: Current Practice and New Perspectives
Lai, C., & Teboul, J. (2023) · Elsevier eBooks · doi:10.1016/b978-0-323-88271-2.00010-9 · Cited by 2
Self-citationFluid Management in Intra-abdominal Hypertension
Malbrain, M. L. N. G., Nasa, P., laet, I. D., Waele, J. J. D., Jacobs, R., Wise, R., Malbrain, L., Dąbrowski, W., & Wong, A. (2023) · Springer eBooks · doi:10.1007/978-3-031-42205-8_22 · Cited by 2
Self-citationBosisio, N. S. M. B., Romero-González, G. A., Silvestri, A. D., Husain‐Syed, F., & Ferrari, F. (2023) · Nefrología (English Edition) · doi:10.1016/j.nefroe.2023.05.010 · Cited by 2
Shahsavarinia, K., Sabzevari, T., Shadvar, K., Saghaleini, S. H., Mahmoodpoor, A., Ghamari, A. A., Vahedian‐Azimi, A., Samim, A., & Rahimi‐Bashar, F. (2024) · Intensive Care Research · doi:10.1007/s44231-024-00059-6 · Cited by 2
Ngwenyama, T. R. (2025) · Veterinary Clinics of North America Small Animal Practice · doi:10.1016/j.cvsm.2025.02.002 · Cited by 2
Gunning, S., Mire, M., Gulotta, G. E., & Koyner, J. L. (2025) · Journal of Critical Care · doi:10.1016/j.jcrc.2025.155161 · Cited by 3
Popović, R., Anđelić, N., Jovanović, G., Maričić-Prijić, S., Uvelin, A., Tomić, N., Đurić, A. P., Todorović, N., Milijašević, B., & Markovic, D. Z. (2025) · Frontiers in Medicine · doi:10.3389/fmed.2025.1608388 · Cited by 2
Maluangnon, C., Saokaew, A., Rojwatcharapibarn, S., & Ratanarat, R. (2025) · The Ultrasound Journal · doi:10.1186/s13089-025-00447-z · Cited by 2
Graziani, M., Gasperini, L., Gasperini, C., Maraziti, G., PASCALE, G. D., & Becattini, C. (2025) · Internal and Emergency Medicine · doi:10.1007/s11739-025-04179-9 · Cited by 2
Zhang, C., Xie, Z., Lin, G., & Zhang, Q. (2026) · Frontiers in Cardiovascular Medicine · doi:10.3389/fcvm.2025.1674197 · Cited by 2
Kupchik, N. (2021) · Critical Care Nursing Clinics of North America · doi:10.1016/j.cnc.2021.05.001 · Cited by 2
Update on the use of ultrasound in the diagnosis and monitoring of the critical patient
Monteagudo, M. Á. R., Roselló, I. A., Carrasco, Á. D. M., García, P. C., & Zarragoikoetxea, I. (2022) · Revista Española de Anestesiología y Reanimación (English Edition) · doi:10.1016/j.redare.2022.01.003 · Cited by 2
Pellegrini, J. A. S., Mendes, C. L., Gottardo, P. C., Feitosa, K., John, J. F., Tonelli, A. C., Negri, A. J. D. A., Grumann, A. C. B., Barros, D. D. S., Negri, F. E. F. D. O., et al. (2023) · Critical Care Science · doi:10.5935/2965-2774.20230310-en · Cited by 2
Fluid balance in critical illness: choosing our words wisely
Braun, C. G., Selewski, D. T., Dziorny, A. C., & Hasson, D. C. (2025) · Intensive Care Medicine – Paediatric and Neonatal · doi:10.1007/s44253-025-00061-w · Cited by 2
Fuller, B. M. (2018) · Critical Care Medicine · doi:10.1097/ccm.0000000000003309 · Cited by 2
The Impact of IV Electrolyte Replacement on the Fluid Balance of Critically Ill Surgical Patients
Wang, A. S., Dhillon, N. K., Linaval, N. T., Rottler, N. P., Yang, A. R., Margulies, D. R., Ley, E. J., & Barmparas, G. (2019) · The American Surgeon · doi:10.1177/000313481908501021 · Cited by 2
Hou, J., Zheng, J., Ma, G., Lin, X.-M., Hao, G., Su, Y., Luo, J., Liu, K., Luo, Z., & Tu, G.-W. (2020) · Annals of Translational Medicine · doi:10.21037/atm-20-847 · Cited by 2
Thitayanapong, A., & Tongyoo, S. (2022) · Clinical Critical Care · doi:10.54205/ccc.v30.254873 · Cited by 2
Mekeirele, M., Vanhonacker, D., & Malbrain, M. L. N. G. (2022) · Springer eBooks · doi:10.1007/978-981-19-0954-2_20 · Cited by 2
Self-citationPOCUS shock management: point-of-care ultrasound in the integrated management of shock
Cibinel, G. A. (2022) · Italian Journal of Emergency Medicine · doi:10.23736/s2532-1285.22.00151-3 · Cited by 2
Terms and Definitions of Fluid Therapy
Malbrain, M. L. N. G., Wong, A. V.-K., Malbrain, L., Nasa, P., & Wilkinson, J. (2023) · Springer eBooks · doi:10.1007/978-3-031-42205-8_1 · Cited by 3
Self-citationComparative Analysis of Bacteremic and Non-bacteremic Sepsis: A Retrospective Study
Lee, R., Rifaie, R. A., Subedi, K., & Coletti, C. (2024) · Cureus · doi:10.7759/cureus.76418 · Cited by 2
Individualized fluid optimization and de-escalation in critically ill patients with septic shock
Messina, A., Matronola, G. M., & Cecconi, M. (2025) · Current Opinion in Critical Care · doi:10.1097/mcc.0000000000001301 · Cited by 2
Physician factors in utilizing haemodynamic data in patient care
Boerma, E. C., & Bootsma, I. T. (2019) · Current Opinion in Critical Care · doi:10.1097/mcc.0000000000000600 · Cited by 2
From the Physiology to the Bedside: Fluid Therapy in Cardiac Surgery and the ICU
Guarnieri, M., GASPERI, A. D., Gianni, S., Baciarello, M., Bellini, V., & Bignami, E. G. (2019) · Current anesthesiology reports · doi:10.1007/s40140-019-00341-0 · Cited by 2
Munding, C. E., Acconcia, C. N., Elfarnawany, M., Eibl, J. K., Verrecchia, P., Leonard, P., Boyes, A., Yang, Z., Atoui, R., & Demore, C. E. M. (2021) · IEEE International Ultrasonics Symposium · doi:10.1109/ius52206.2021.9593456 · Cited by 2
Fluid Responsiveness as a Physiologic Endpoint to Improve Successful Weaning
Castro, R., Born, P., & Bakker, J. (2022) · Annual update in intensive care and emergency medicine · doi:10.1007/978-3-030-93433-0_12 · Cited by 2
Modern aspects of infusion therapy: review
Khalikova, E. Y., Николаевна, З. Е., & Shtanev, Z. D. (2023) · Clinical nutrition and metabolism · doi:10.17816/clinutr334376 · Cited by 2
Intravenous Fluids: Do Not Drown in Confusion!
Wilkinson, J. N., van Haren, F. M. P., & Malbrain, M. L. N. G. (2020) · Annual update in intensive care and emergency medicine · doi:10.1007/978-3-030-37323-8_13 · Cited by 2
Self-citationLa necesidad de implementación del código sepsis en el Centro Médico Hospital ABC
Gómez, C. A. R., Contreras, A. R. C., Calderón, O. E. P., & Sánchez, J. S. A. (2020) · Anales Médicos de la Asociación Médica del Centro Médico ABC · doi:10.35366/92917 · Cited by 2
Perioperative Fluid Management
Scott, M. J. (2021) · Elsevier eBooks · doi:10.1016/b978-0-323-56724-4.00016-2 · Cited by 2
Feshchenko, Y. I., Beridze, S., Hoa, D. T., Molodtsov, V. Y., Gumeniuk, М., Gogoreliani, N., Sattarov, H. I., Emukhvari, N., Lupu, G., Mostovoy, Y. M., et al. (2021) · Infusion & Chemotherapy · doi:10.32902/2663-0338-2021-1-5-14 · Cited by 2
Hemodynamic Monitoring and Therapy in Hypovolemic Shock
Kletečka, J., & Beneš, J. (2021) · Springer eBooks · doi:10.1007/978-3-030-71752-0_23 · Cited by 2
Jessen, M. K., Andersen, L. W., Thomsen, M. H., Kristensen, P., Hayeri, W., Hassel, R. E., Perner, A., Petersen, J. A. K., & Kirkegaard, H. (2022) · Pilot and Feasibility Studies · doi:10.1186/s40814-022-01034-y · Cited by 2
Fluid Resuscitation in Septic Shock
Ghosh, S. (2022) · Springer eBooks · doi:10.1007/978-981-19-0500-1_11 · Cited by 2
Hussain, A., Владимирович, К. В., & Кirov, М. Y. (2021) · Springer eBooks · doi:10.1007/978-3-030-71752-0_25 · Cited by 2
Biomarkers for intra-abdominal pressure: another tool in the toolbox?
Khanna, A. K., Rola, P., & Malbrain, M. L. N. G. (2022) · European Heart Journal Acute Cardiovascular Care · doi:10.1093/ehjacc/zuac073 · Cited by 2
Self-citationCindryani, M., Taufik, M. A., & Irawany, V. (2020) · Bali Journal of Anesthesiology · doi:10.4103/bjoa.bjoa_3_20 · Cited by 1
Núñez-Ramos, J. A., Manzur-Barbur, C., Charris-Polo, R. A., & Vergara-Barrios, P. (2022) · Revista de Educaci�n e Investigaci�n en Emergencias · doi:10.24875/reie.21000127 · Cited by 1
Current state of sepsis resuscitation in critical care
Orellana, G., Josef, V., Parchim, N. F., & Mitchell, J. A. (2023) · International Anesthesiology Clinics · doi:10.1097/aia.0000000000000416 · Cited by 2
Díaz, M. A. T. (2023) · IntechOpen eBooks · doi:10.5772/intechopen.112156 · Cited by 1
Malbrain, M. L. N. G., Ho, S., Nasa, P., & Wong, A. V.-K. (2023) · Springer eBooks · doi:10.1007/978-3-031-42205-8_26 · Cited by 1
Self-citationAssessment of Fluid Responsiveness with Critical Care Echocardiography: An Update
Pandompatam, G. (2024) · Current Pulmonology Reports · doi:10.1007/s13665-024-00352-1 · Cited by 1
SOP Abschätzung des Volumenbedarfs mittels POCUS
Köhnke, R., & Bentele, S. (2024) · Notaufnahme up2date · doi:10.1055/a-2275-5856 · Cited by 1
Permissive strategies in intensive care units: actual trends?
Domi, R., Coniglione, F., Huti, G., & Lilaj, K. (2025) · Anesthesia and Pain Medicine · doi:10.17085/apm.24103 · Cited by 3
Individualized de-resuscitation and diuresis strategies in hospitalized patients: A narrative review
Carr, J., Sikora, A. N., Meyer, S. A., Hogewood, B., Akin, K., & Fuller, J. (2025) · American Journal of Health-System Pharmacy · doi:10.1093/ajhp/zxaf217 · Cited by 1
Integrating VEXUS and VTI for Precision Hemodynamic Management in Critical Care
Sasidharan, S. (2025) · SN Comprehensive Clinical Medicine · doi:10.1007/s42399-025-02024-w · Cited by 1
Sanfilippo, F., Santonocito, C., Zawadka, M., Caruso, A., Bonelli, G., Dugar, S. P., Vignon, P., & Noto, A. (2025) · Journal of Ultrasound · doi:10.1007/s40477-025-01074-z · Cited by 1
Zulkifili, Z., Handrawan, S. E., Murtadho, M. A. R., & Banun, S. (2025) · Bali Journal of Anesthesiology · doi:10.4103/bjoa.bjoa_142_25 · Cited by 1
Venkatesh, P., & Vinod, N. (2026) · Journal of Acute Care · doi:10.5005/jp-journals-10089-0228 · Cited by 1
Melo, P., Wendel‐Garcia, P. D., Léone, M., Khanna, A. K., Morales, S., Ospina-Tascón, G. A., Castro, R., Glenn Hernández, P., & Kattan, E. (2026) · Critical Care · doi:10.1186/s13054-026-06197-1 · Cited by 1
Strategies for the Management of Sepsis
Gilbert, B. W., Reichert, M., & Fletcher, S. (2019) · AACN Advanced Critical Care · doi:10.4037/aacnacc2019526 · Cited by 1
Agüero, A., & Infante, K. (2021) · Revista Médica del Uruguay · doi:10.29193/rmu.37.2.8 · Cited by 1
Übertherapie in der Intensivmedizin
Druml, W., & Druml, C. (2019) · Wiener klinisches Magazin · doi:10.1007/s00740-019-0288-8 · Cited by 1
Adriane, P., Dewi, N. L. K., & Ardiyan, A. (2022) · Intisari Sains Medis · doi:10.15562/ism.v13i1.1043 · Cited by 1
Dahal, T., Prajapati, S., & Sapkota, B. (2023) · World Journal of Advanced Research and Reviews · doi:10.30574/wjarr.2023.17.2.0257 · Cited by 1
Maynar, J., Barrasa, H., Martin, A., Usón, E., & Fonseca, F. L. A. (2023) · Elsevier eBooks · doi:10.1016/b978-0-323-88271-2.00014-6 · Cited by 1
Fluid and Blood Management in Traumatic and Non-traumatic Surgical Emergencies
Vanhonacker, D., Mekeirele, M., & Malbrain, M. L. N. G. (2023) · Springer eBooks · doi:10.1007/978-3-031-22599-4_14 · Cited by 1
Self-citationManaging the deteriorating child with suspected group A Streptococcus infection
Kempsell-Smith, M., & Fitzsimons, C. (2023) · Nursing Children and Young People · doi:10.7748/ncyp.2023.e1467 · Cited by 1
Management of Postoperative Bleeding Patient
Mishra, S. B. (2024) · Springer eBooks · doi:10.1007/978-981-97-5565-3_33 · Cited by 1
de Bessa, C. M., Vilardo, A. L., Peruchetti, D. B., Conceição, P. H. L., Caruso‐Neves, C., Capelozzi, V. L., Battaglini, D., Robba, C., Pelosi, P. P., Malbrain, M. L. N. G., et al. (2025) · Scientific Reports · doi:10.1038/s41598-025-12491-9 · Cited by 1
Self-citationShadravan, M. M., Souri, H., Shirazi, F., Doroudgar, S., Barani, M., Nassiri, A. A., & Darazam, I. A. (2025) · Research Journal of Critical Care Nephrology · doi:10.61882/rjccn.1.1.24 · Cited by 1
Metadata
- Authors
- Malbrain, M. L. N. G., Van Regenmortel, N., Saugel, B., De Tavernier, B., Van Gaal, P.-J., Joannes-Boyau, O., Teboul, J.-L., Rice, T. W., Mythen, M., & Monnet, X.
- Affiliations
- Vrije Universiteit Brussel (BE)
- University Medical Center Hamburg-Eppendorf (DE)
- Université Paris-Sud (FR)
- University College London (GB)
- Vanderbilt University (US)
- Corresponding author
- Malbrain, Manu L. N.G.
- Venue
- Annals of Intensive Care
- Publisher
- Elsevier BV
- Published
- 2018
- Volume
- 8
- Issue
- 1
- Pages
- 66
- ISSN
- 2110-5820 (ISSN-L)
- PMC
- PMC5964054
- OpenAlex
- W2807356795
- Cited by
- 632
- References
- 105
- Citations by year
- 2026: 84 · 2025: 92 · 2024: 76 · 2023: 96 · 2022: 70 · 2021: 84 · 2020: 76 · 2019: 41 · 2018: 13
- FWCI
- 7.68
- Type
- journal article
- Language
- en
- Open access
- gold
- doi.org
- Licence
- Locations
- Annals of Intensive Care (publishedVersion, cc-by)
- Europe PMC (PubMed Central) (publishedVersion, cc-by)
- PubMed Central (publishedVersion, cc-by)
- PubMed (publishedVersion)
- HAL (submittedVersion)
- DOAJ (DOAJ: Directory of Open Access Journals) (submittedVersion, cc-by-sa)
- UCL Discovery (University College London) (submittedVersion)
- VUBIR (Vrije Universiteit Brussel) (submittedVersion)
- Topics
- Health Sciences › Medicine › Critical Care and Intensive Care Medicine › Sepsis Diagnosis and Treatment
- Health Sciences › Medicine › Surgery › Hemodynamic Monitoring and Therapy
- Health Sciences › Medicine › Surgery › Abdominal Surgery and Complications
- Keywords
- septic shock, fluid management, goal-directed fluid therapy, fluid resuscitation, intravenous fluid therapy, fluid removal
About these checks
Registry, retraction, Cites and statistics results are computed, not judged, with one exception: a printed reference that no index lists is read once by a model before it counts as a citation error. Claims are extracted by a model and kept only when their quote appears verbatim in the text; each cited source is then checked, with a model’s help, for whether it says what the claim relies on. Those verdicts can be wrong — read the claim’s quote and the cited source before relying on one.
Statistics and arithmetic are recomputed, not judged.
Confidence bands are shown only for fields calibrated on our annotated test set. None is calibrated yet, so no band is shown.
What counts as a claim ›How we measure confidence ›How we check this ›
Are you an author, or do you see a problem with this page? Request a review
