

The DOI matches its Crossref record; 87 of the 87 references it cites were found in a registry or an index.
Early-life gut microbiome modulation reduces the abundance of antibiotic-resistant bacteria
Open accessAbstract
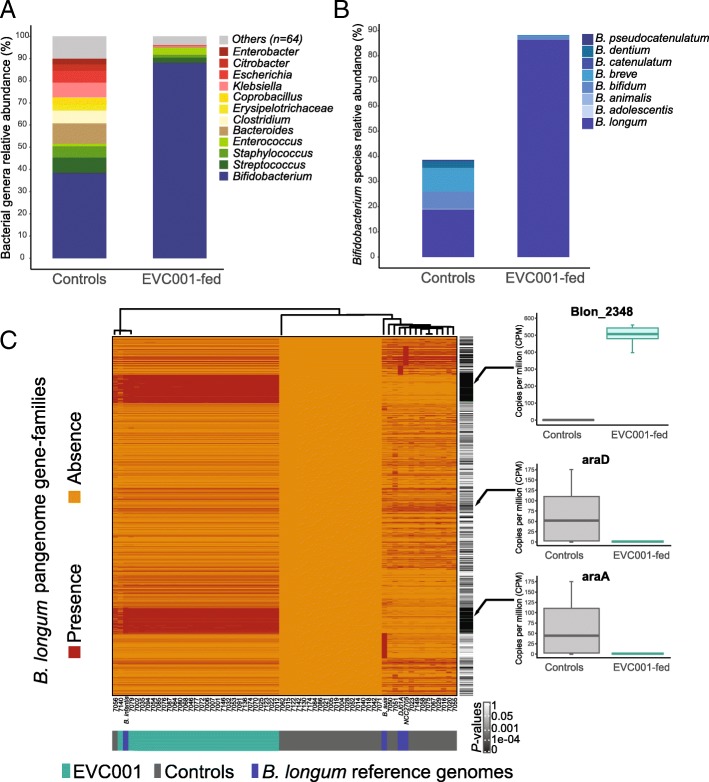
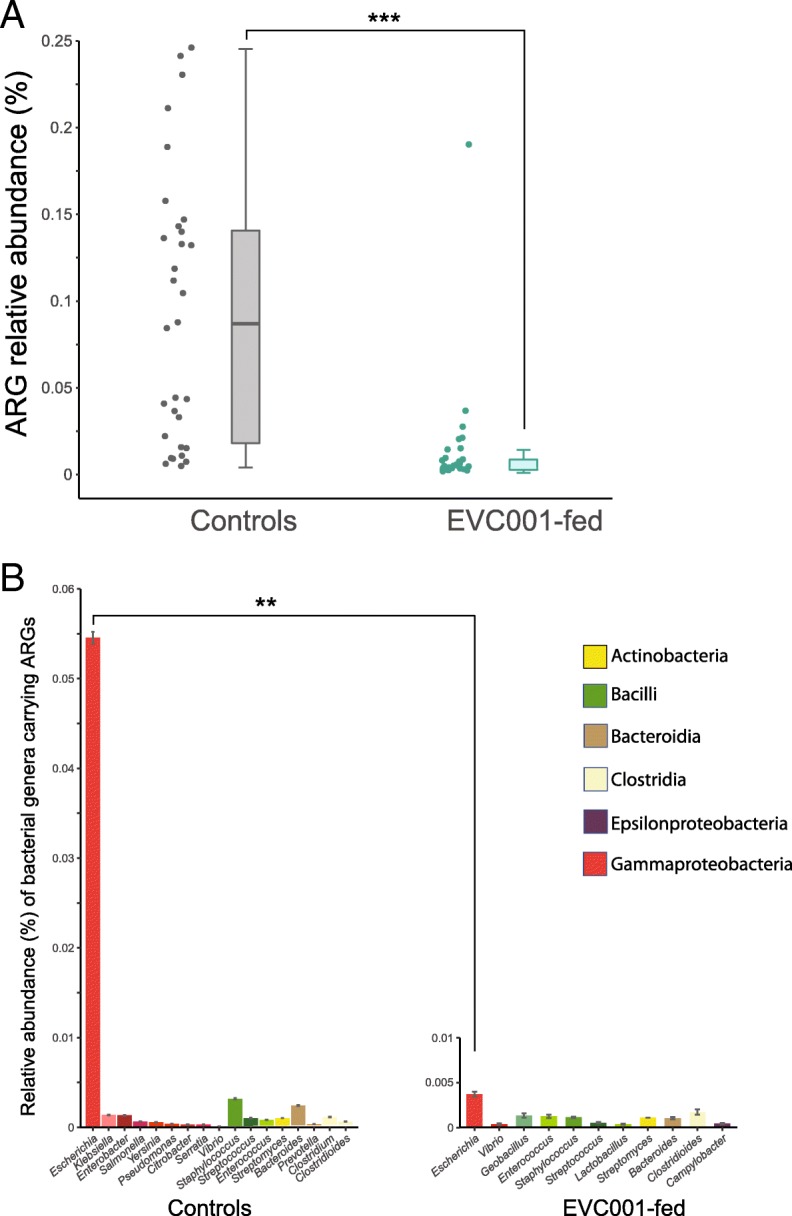
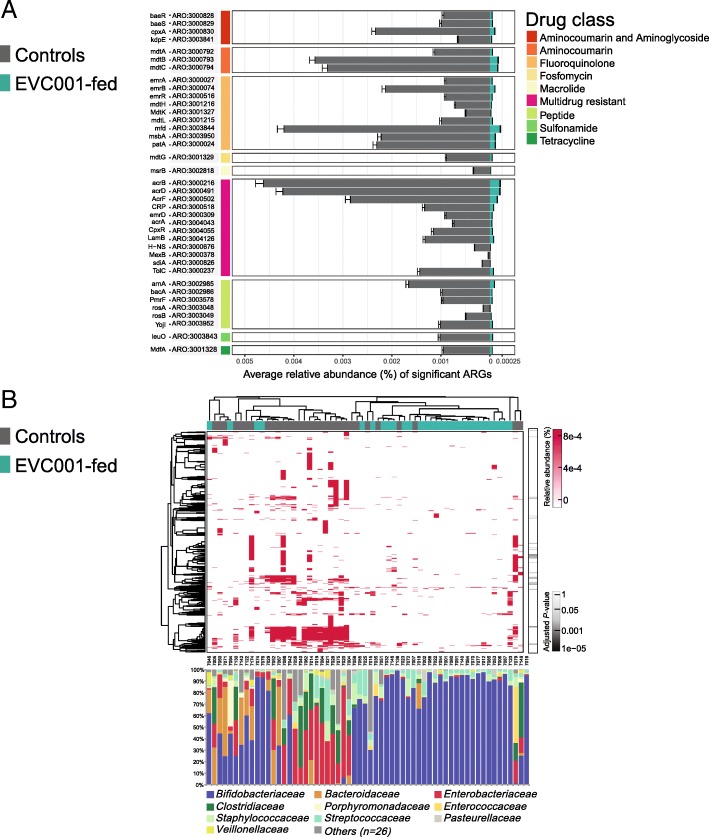
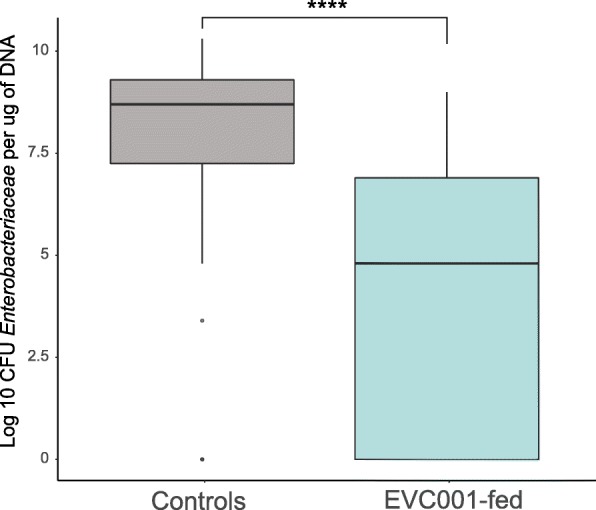
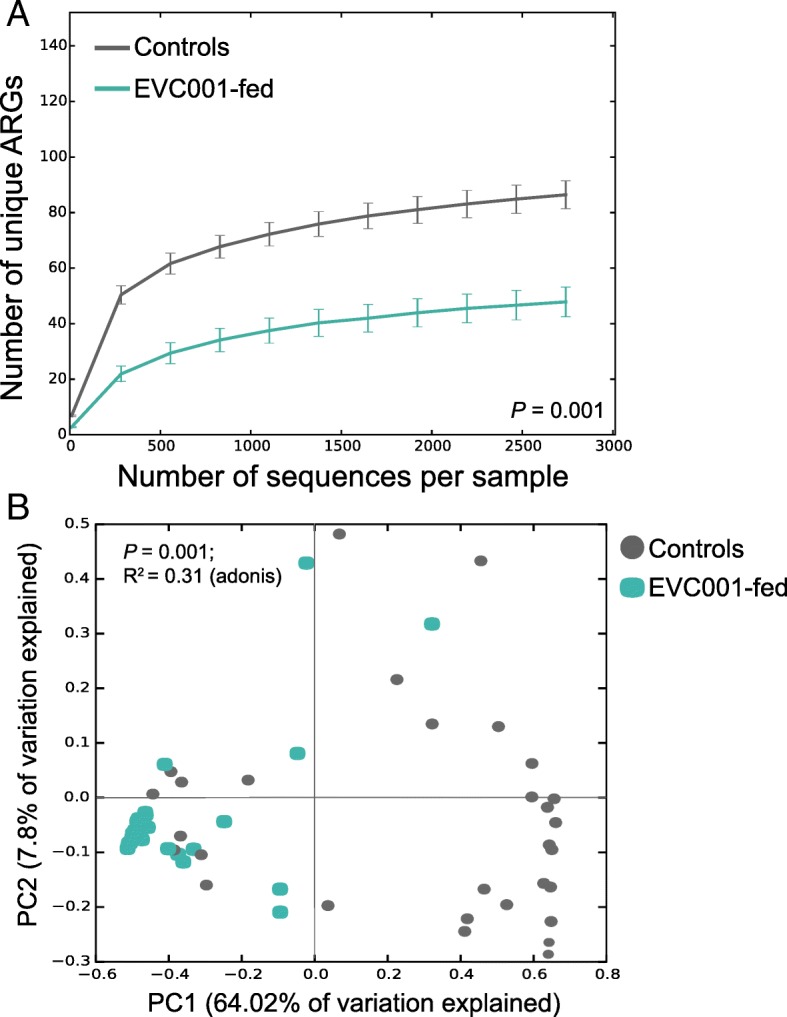
Antibiotic-resistant (AR) bacteria are a global threat. AR bacteria can be acquired in early life and have long-term sequelae. Limiting the spread of antibiotic resistance without triggering the development of additional resistance mechanisms is of immense clinical value. Here, we show how the infant gut microbiome can be modified, resulting in a significant reduction of AR genes (ARGs) and the potentially pathogenic bacteria that harbor them. The gut microbiome was characterized using shotgun metagenomics of fecal samples from two groups of healthy, term breastfed infants. One group was fed B. infantis EVC001 in addition to receiving lactation support (n = 29, EVC001-fed), while the other received lactation support alone (n = 31, controls). Coliforms were isolated from fecal samples and genome sequenced, as well as tested for minimal inhibitory concentrations against clinically relevant antibiotics. Infants fed B. infantis EVC001 exhibited a change to the gut microbiome, resulting in a 90% lower level of ARGs compared to controls. ARGs that differed significantly between groups were predicted to confer resistance to beta lactams, fluoroquinolones, or multiple drug classes, the majority of which belonged to Escherichia, Clostridium, and Staphylococcus. Minimal inhibitory concentration assays confirmed the resistance phenotypes among isolates with these genes. Notably, we found extended-spectrum beta lactamases among healthy, vaginally delivered breastfed infants who had never been exposed to antibiotics. Colonization of the gut of breastfed infants by a single strain of B. longum subsp. infantis had a profound impact on the fecal metagenome, including a reduction in ARGs. This highlights the importance of developing novel approaches to limit the spread of these genes among clinically relevant bacteria. Future studies are needed to determine whether colonization with B. infantis EVC001 decreases the incidence of AR infections in breastfed infants. This clinical trial was registered at ClinicalTrials.gov , NCT02457338.
Overview
The claims and statistics of this paper haven’t been checked yet.
Run the check — free, no account needed. It reads the open-access text and checks the sources it cites.
Integrity signals
Registry
Cites
Statistics
Figures
Verification
Claims the paper makes
The claims and statistics of this paper haven’t been checked yet.
Run the check — free, no account needed. It reads the open-access text and checks the sources it cites.
Claims other papers make about this one
Each is checked against this paper’s own text: does it say what the citing paper says it does?
The source backs part of the claim, not all of it — or backs it for a different population, condition or comparison.
In the citing paper
“Bifidobacterium, and Bifidobacterium supplementation has been associated with lower ARG abundance in the infant gut microbiome, likely due to the competitive exclusion of ARG-rich pathobionts56–59.”
From Impact of early life antibiotic and probiotic treatment on gut microbiome and resistome of very-low-birth-weight preterm infants. (2025) · cites this paper as [56]
Experimental — accuracy not yet measured
Self-check
Percentages, sums and reported differences re-computed from the paper’s own numbers.
The self-check needs the paper’s full text.
Citations
Cites
Trimmomatic: a flexible trimmer for Illumina sequence data
Bolger, A. M., Lohse, M., & Usadel, B. (2014) · Bioinformatics · doi:10.1093/bioinformatics/btu170 · Cited by 65,548
SPAdes: A New Genome Assembly Algorithm and Its Applications to Single-Cell Sequencing
Bankevich, A., Nurk, S., Antipov, D., Gurevich, A. A., Dvorkin, M. V., Kulikov, A. S., Lesin, V. M., Nikolenko, S., Pham, S., Prjibelski, A. D., et al. (2012) · Journal of Computational Biology · doi:10.1089/cmb.2012.0021 · Cited by 26,312
Fast and sensitive protein alignment using DIAMOND
Buchfink, B., Xie, C., & Huson, D. H. (2015) · Nature Methods · doi:10.1038/nmeth.3176 · Cited by 14,201
Structure, function and diversity of the healthy human microbiome
The Human Microbiome Project Consortium (2012) · Nature · doi:10.1038/nature11234 · Cited by 11,726
Canu: scalable and accurate long-read assembly via adaptive k -mer weighting and repeat separationPreprint
Koren, S., Walenz, B. P., Berlin, K., Miller, J. R., Bergman, N. H., & Phillippy, A. M. (2017) · Genome Research · doi:10.1101/gr.215087.116 · Cited by 7,260
MEGAN analysis of metagenomic dataPreprint
Huson, D. H., Auch, A. F., Qi, J., & Schuster, S. C. (2007) · Genome Research · doi:10.1101/gr.5969107 · Cited by 3,294
Estimating Health Care-Associated Infections and Deaths in U.S. Hospitals, 2002
Klevens, R. M., Edwards, J. R., Richards, C. L., Horan, T. C., Gaynes, R. P., Pollock, D. A., & Cardo, D. M. (2007) · Public Health Reports · doi:10.1177/003335490712200205 · Cited by 2,963
Bacterial Persistence as a Phenotypic Switch
Balaban, N. Q., Merrin, J., Chait, R., Kowalik, L., & Leibler, S. (2004) · Science · doi:10.1126/science.1099390 · Cited by 2,952
Development of the Human Infant Intestinal Microbiota
Palmer, C., Bik, E. M., DiGiulio, D. B., Relman, D. A., & Brown, P. O. (2007) · PLoS Biology · doi:10.1371/journal.pbio.0050177 · Cited by 2,877
Wikler, M. A., & Clinical (2006) · Clinical and Laboratory Standards Institute eBooks · Cited by 2,842
Research works printed but not linked: 2
- Andremont A. Commensal flora may play key role in spreading antibiotic resistance. ASM news. 2003;69(12):601–7.
- CLSI. Performance Standards for Antimicrobial Susceptibility Testing: CLSI supplement. M100S. 26th ed. Wayne, PA: Clinical and Laboratory Standards Institute; 2016.
Cited by
Sorted by citations
Bifidobacteria-mediated immune system imprinting early in life
Henrick, B. M., Rodriguez, L., Lakshmikanth, T., Pou, C., Henckel, E., Arzoomand, A., Olin, A., Wang, J., Mikeš, J., Tan, Z., et al. (2021) · Cell · doi:10.1016/j.cell.2021.05.030 · Cited by 836
Self-citationImpact of antibiotics on the human microbiome and consequences for host health
Patangia, D. V., Ryan, C. A., Dempsey, E. M., Ross, R. P., & Stanton, C. (2022) · MicrobiologyOpen · doi:10.1002/mbo3.1260 · Cited by 861
Clinical implications of preterm infant gut microbiome development
Healy, D., Ryan, C. A., Ross, R. P., Stanton, C., & Dempsey, E. M. (2021) · Nature Microbiology · doi:10.1038/s41564-021-01025-4 · Cited by 142
Early‐Life Gut Microbiome—The Importance of Maternal and Infant Factors in Its Establishment
Kapourchali, F. R., & Cresci, G. (2020) · Nutrition in Clinical Practice · doi:10.1002/ncp.10490 · Cited by 137
Islam, T., Haque, M. A., Barai, H. R., Istiaq, A., & Kim, J.-J. (2024) · Plants · doi:10.3390/plants13081135 · Cited by 84
Casaburi, G., Duar, R. M., Brown, H. K., Mitchell, R. D., Kazi, S., Chew, S., Cagney, O., Flannery, R. L., Sylvester, K. G., Frese, S. A., et al. (2021) · Scientific Reports · doi:10.1038/s41598-020-80583-9 · Cited by 76
Self-citationAntimicrobial resistance in enteric bacteria: current state and next-generation solutions
Wallace, M. J., Fishbein, S. R. S., & Dantas, G. A. (2020) · Gut Microbes · doi:10.1080/19490976.2020.1799654 · Cited by 82
Duar, R. M., Casaburi, G., Mitchell, R. D., Scofield, L. N. C., Ramírez, C. A. O., Barile, D., Henrick, B. M., & Frese, S. A. (2020) · Nutrients · doi:10.3390/nu12113247 · Cited by 72
Self-citationDuar, R. M., Kyle, D., & Casaburi, G. (2020) · High-Throughput · doi:10.3390/ht9020007 · Cited by 70
Self-citationThe infant gut resistome is associated with E. coli and early-life exposures
Lebeaux, R. M., Coker, M. O., Dade, E. F., Palys, T. J., Morrison, H. G., Ross, B. D., Baker, E., Karagas, M. R., Madan, J. C., & Hoen, A. G. (2021) · BMC Microbiology · doi:10.1186/s12866-021-02129-x · Cited by 69
Early life gut microbiome and its impact on childhood health and chronic conditions
Núñez, H., Nieto, P. A., Mars, R. A. T., Ghavami, M., Hoy, C. S., & Sukhum, K. V. (2025) · Gut Microbes · doi:10.1080/19490976.2025.2463567 · Cited by 80
O’Brien, C. E., Meier, A., Cernioglo, K., Mitchell, R. D., Casaburi, G., Frese, S. A., Henrick, B. M., Underwood, M. A., & Smilowitz, J. T. (2021) · Pediatric Research · doi:10.1038/s41390-020-01350-0 · Cited by 67
Self-citationNguyen, M., Holdbrooks, H., Mishra, P. K., Abrantes, M. A., Eskew, S., Garma, M., Oca, C.-G., McGuckin, C., Hein, C. T., Mitchell, R. D., et al. (2021) · Frontiers in Pediatrics · doi:10.3389/fped.2021.618009 · Cited by 61
Self-citationMaternal-infant antibiotic resistance genes transference: what do we know?
Samarra, A., Esteban-Torres, M., Cabrera‐Rubio, R., Bernabeu, M., Arboleya, S., Gueimonde, M., & Collado, M. C. (2023) · Gut Microbes · doi:10.1080/19490976.2023.2194797 · Cited by 58
Duar, R. M., Henrick, B. M., Casaburi, G., & Frese, S. A. (2020) · Frontiers in Nutrition · doi:10.3389/fnut.2020.00033 · Cited by 50
Self-citationHeiss, B. E., Ehrlich, A. M., Maldonado-Gómez, M. X., Taft, D. H., Larke, J. A., Goodson, M. L., Slupsky, C. M., Tancredi, D. J., Raybould, H. E., & Mills, D. A. (2021) · Gut Microbes · doi:10.1080/19490976.2021.1986666 · Cited by 51
Bifidobacterium and Lactobacillus Probiotics and Gut Dysbiosis in Preterm Infants
Rossum, T. V., Haiß, A., Knoll, R. L., Marißen, J., Podlesny, D., Pagel, J., Bleskina, M., Vens, M., Fortmann, M. I., Siller, B., et al. (2024) · Archives of Pediatrics and Adolescent Medicine · doi:10.1001/jamapediatrics.2024.2626 · Cited by 47
Tobias, J. D., Olyaei, A. F., Laraway, B. J., Jordan, B. K., Dickinson, S., Golzarri‐Arroyo, L., Fialkowski, E., Owora, A. H., & Scottoline, B. P. (2022) · The Journal of Pediatrics · doi:10.1016/j.jpeds.2021.12.070 · Cited by 46
Inulin Fermentation by Lactobacilli and Bifidobacteria from Dairy Calves
Zhu, Y., Liu, J., Lopez, J. M., & Mills, D. A. (2020) · Applied and Environmental Microbiology · doi:10.1128/aem.01738-20 · Cited by 41
Hays, M. R., Kildow, B. J., Hartman, C. W., Lyden, E. R., Springer, B. D., Fehring, T. K., & Garvin, K. L. (2023) · The Journal of Arthroplasty · doi:10.1016/j.arth.2023.02.025 · Cited by 39
Mills, D. A., German, J. B., Lebrilla, C. B., & Underwood, M. A. (2023) · Gut Microbes · doi:10.1080/19490976.2023.2192458 · Cited by 39
Self-citationArzamasov, A. A., Nakajima, A., Sakanaka, M., Ojima, M. N., Katayama, T., Rodionov, D. A., & Osterman, A. L. (2022) · mSystems · doi:10.1128/msystems.00343-22 · Cited by 41
Kiu, R., Darby, E. M., Alcon-Giner, C., Acuna-Gonzalez, A., Camargo, A., Lamberte, L. E., Phillips, S., Sim, K., Shaw, A. G., Clarke, P., et al. (2025) · Nature communications · doi:10.1038/s41467-025-62584-2 · Cited by 36
“Bi fi do-bacterium , and Bi fi dobacterium supplementation has been associated with lower ARG abundance in the infant gut microbiome, likely due to the competitive exclusion of ARG-rich pathobionts 56 – 59 .”
Derrien, M., Mikulic, N., Uyoga, M. A., Chenoll, E., Climent, E., Howard-Varona, A., Nyilima, S., Stoffel, N. U., Karanja, S., Kottler, R., et al. (2023) · Gut Microbes · doi:10.1080/19490976.2023.2178793 · Cited by 36
Antimicrobial Resistance Genes (ARGs), the Gut Microbiome, and Infant Nutrition
Theophilus, R. J., & Taft, D. H. (2023) · Nutrients · doi:10.3390/nu15143177 · Cited by 37
Oladeinde, A., Abdo, Z., Zwirzitz, B., Woyda, R., Lakin, S. M., Press, M. O., Cox, N. A., Thomas, J. C., Looft, T. P., Rothrock, M. J., et al. (2022) · Applied and Environmental Microbiology · doi:10.1128/aem.02517-21 · Cited by 37
Can breastfeeding protect against antimicrobial resistance?
Nadimpalli, M. L., Bourke, C. D., Robertson, R. C., Delarocque‐Astagneau, E., Manges, A. R., & Pickering, A. J. (2020) · BMC Medicine · doi:10.1186/s12916-020-01862-w · Cited by 38
Impact of antibiotics on off-target infant gut microbiota and resistance genes in cohort studies
Lebeaux, R. M., Madan, J. C., Nguyen, Q. P., Coker, M. O., Dade, E. F., Moroishi, Y., Palys, T. J., Ross, B. D., Pettigrew, M. M., Morrison, H. G., et al. (2022) · Pediatric Research · doi:10.1038/s41390-022-02104-w · Cited by 36
Breastfeeding and early Bifidobacterium-driven microbial colonization shape the infant gut resistome
Samarra, A., Alcañiz, A. J., Martínez-Costa, C., Marina, A., Comas, I., Segata, N., Quijada, N. M., & Collado, M. C. (2025) · Nature Communications · doi:10.1038/s41467-025-61154-w · Cited by 32
Helping Mom Help Baby: Nutrition-Based Support for the Mother-Infant Dyad During Lactation
Ford, E. L., Underwood, M. A., & German, J. B. (2020) · Frontiers in Nutrition · doi:10.3389/fnut.2020.00054 · Cited by 40
Self-citationCasaburi, G., Wei, J., Kazi, S., Liu, J., Wang, K., Tao, G., Lin, P., Dunn, J., Henrick, B. M., Frese, S. A., et al. (2022) · Frontiers in Pediatrics · doi:10.3389/fped.2022.893059 · Cited by 27
Self-citationAbdipour, H., & Hemati, H. (2023) · International Journal of Environmental & Analytical Chemistry · doi:10.1080/03067319.2023.2207465 · Cited by 27
Samarra, A., Cabrera-Rubio, R., Martínez-Costa, C., & Collado, M. C. (2024) · Gut Microbes · doi:10.1080/19490976.2024.2357176 · Cited by 25
Building Robust Assemblages of Bacteria in the Human Gut in Early Life
Tannock, G. W. (2021) · Applied and Environmental Microbiology · doi:10.1128/aem.01449-21 · Cited by 24
Hubeny, J., Ciesielski, S., Harnisz, M., Korzeniewska, E., Dulski, T., Jałowiecki, Ł., & Płaza, G. A. (2021) · Frontiers in Environmental Science · doi:10.3389/fenvs.2021.738158 · Cited by 21
Xu, X., Feng, Q., Zhang, T., Gao, Y., Cheng, Q., Zhang, W., Wu, Q., Xu, K., Li, Y., Nguyen, N., et al. (2024) · iMeta · doi:10.1002/imt2.169 · Cited by 20
The Resistome of ESKAPEE Pathogens in Untreated and Treated Wastewater: A Polish Case Study
Hubeny, J., Korzeniewska, E., Ciesielski, S., Płaza, G. A., & Harnisz, M. (2022) · Biomolecules · doi:10.3390/biom12081160 · Cited by 19
Bajorek, S. A., Duar, R. M., Corrigan, M., Matrone, C., Winn, K. A., Norman, S. E., Mitchell, R. D., Cagney, O., Aksenov, A. A., Melnik, A. V., et al. (2022) · Frontiers in Pediatrics · doi:10.3389/fped.2021.795970 · Cited by 19
Self-citationMilk glycan metabolism by intestinal bifidobacteria: insights from comparative genomics
Arzamasov, A. A., & Osterman, A. L. (2022) · Critical Reviews in Biochemistry and Molecular Biology · doi:10.1080/10409238.2023.2182272 · Cited by 19
Larke, J. A., Heiss, B. E., Ehrlich, A. M., Taft, D. H., Raybould, H. E., Mills, D. A., & Slupsky, C. M. (2023) · Microbiome · doi:10.1186/s40168-023-01624-9 · Cited by 19
Human Milk—The Biofluid That Nourishes Infants from the First Day of Life
Lugonja, N. M., Marinković, V., Pucarević, M., Miletić, S., Stojić, N., Crnković, D. M., & Vrvić, M. M. (2024) · Foods · doi:10.3390/foods13091298 · Cited by 19
Apiwatsiri, P., Pupa, P., Sirichokchatchawan, W., Sawaswong, V., Nimsamer, P., Payungporn, S., Hampson, D. J., & Prapasarakul, N. (2022) · PLoS ONE · doi:10.1371/journal.pone.0269959 · Cited by 18
Genomic atlas of Bifidobacterium infantis and B. longum informs infant probiotic design
Shao, Y., Wang, S., Gichuki, B. M., Stares, M. D., Rozday, T. J., Kumar, N., Browne, H. P., Dawson, N. J. R., Njunge, J. M., Tigoi, C., et al. (2026) · Cell · doi:10.1016/j.cell.2026.01.007 · Cited by 17
Lebeaux, R. M., Karalis, D., Lee, J., Whitehouse, H. C., Madan, J. C., Karagas, M. R., & Hoen, A. G. (2022) · Gut Microbes · doi:10.1080/19490976.2022.2120743 · Cited by 20
Impact of Early Feeding: Metagenomics Analysis of the Infant Gut Microbiome
Guglielmo, M. D. D., Franke, K., Robbins, A. K., & Crowgey, E. L. (2022) · Frontiers in Cellular and Infection Microbiology · doi:10.3389/fcimb.2022.816601 · Cited by 17
The neonatal intestinal resistome and factors that influence it—a systematic review
Léo, S., Curtis, N. C., & Zimmermann, P. (2022) · Clinical Microbiology and Infection · doi:10.1016/j.cmi.2022.07.014 · Cited by 16
Influence of age, socioeconomic status, and location on the infant gut resistome across populations
Patangia, D. V., Grimaud, G. M., Wang, S., Ross, R. P., & Stanton, C. (2024) · Gut Microbes · doi:10.1080/19490976.2023.2297837 · Cited by 15
Patangia, D. V., Grimaud, G. M., O'Shea, C., Ryan, C. A., Dempsey, E. M., Stanton, C., & Ross, R. P. (2024) · Microbiome · doi:10.1186/s40168-023-01732-6 · Cited by 17
Pettersen, V. K., Antunes, L. C. M., Dufour, A., & Arrieta, M. (2021) · Computational and Structural Biotechnology Journal · doi:10.1016/j.csbj.2021.12.012 · Cited by 14
Temporal dynamics and microbial interactions shaping the gut resistome in early infancy
Chatzigiannidou, I., Johansen, P. L., Dehli, R. I., Moll, J. M., Eriksen, C., Myers, P. N., Roager, H. M., Yang, L., Stokholm, J., Sørensen, S. J., et al. (2025) · Nature Communications · doi:10.1038/s41467-025-63401-6 · Cited by 14
Xu, J. Y., Duar, R. M., Quah, B., Gong, M., Tin, F., Chan, P., Sim, C. K., Tan, K. H., Chong, Y. S., Gluckman, P. D., et al. (2024) · Frontiers in Pediatrics · doi:10.3389/fped.2024.1421051 · Cited by 13
Self-citationMetagenomics analysis of the neonatal intestinal resistome
Léo, S., Çetiner, Ö. F., Pittet, L. F., Messina, N. L., Jakob, W., Falquet, L., Curtis, N. C., & Zimmermann, P. (2023) · Frontiers in Pediatrics · doi:10.3389/fped.2023.1169651 · Cited by 12
Kuwelker, K., Langeland, N., Löhr, I. H., Gidion, J., Manyahi, J., Moyo, S. J., Blomberg, B., & Klingenberg, C. (2021) · Trials · doi:10.1186/s13063-021-05251-3 · Cited by 12
Modulation of gut microbiota: An emerging consequence in neonatal sepsis
Iqbal, F., Lewis, L., Siva, N., Vandana, K. E., Purkayastha, J., & Shenoy, P. A. (2023) · Clinical Epidemiology and Global Health · doi:10.1016/j.cegh.2023.101245 · Cited by 10
Thomas, J. C., Kieran, T. J., Finger, J. W., Bayona‐Vásquez, N. J., Oladeinde, A., Beasley, J. C., Seaman, J. C., McArthur, J. V., Rhodes, O. E., & Glenn, T. C. (2021) · Microbiology Spectrum · doi:10.1128/spectrum.00097-21 · Cited by 10
Javvadi, S. G., Kujawska, M., Papp, D., Gontarczyk, A. M., Jordan, A., Lawson, M. A., O’Neill, I. J., Alcon-Giner, C., Kiu, R., Clarke, P., et al. (2022) · bioRxiv (Cold Spring Harbor Laboratory) · doi:10.1101/2022.01.27.477972 · Cited by 12
Emami, S., Lerno, L., & Taha, A. Y. (2021) · Food Additives & Contaminants Part A · doi:10.1080/19440049.2021.1982150 · Cited by 9
Vasco, K. A., Bowcutt, B., Carbonell, S. L., Souza, L., Robison, C. I., Abuelo, Á., Erskine, R. J., Norby, B., Zhang, L., Ruegg, P. L., et al. (2024) · Journal of Dairy Science · doi:10.3168/jds.2023-24572 · Cited by 8
Duar, R. M., Kyle, D., & Tribe, R. M. (2020) · FEMS Microbiology Letters · doi:10.1093/femsle/fnaa032 · Cited by 8
Self-citationSowden, M., van Niekerk, E., Bulabula, A. N. H., Dramowski, A., Whitelaw, A. C., Twisk, J. W. R., & van Weissenbruch, M. M. (2022) · Frontiers in Pediatrics · doi:10.3389/fped.2022.1002762 · Cited by 7
Human Gut Microbiome: A Potential Prospective to Counter Antibiotic-Resistant Pathogens
Yadav, M. (2020) · Elsevier eBooks · doi:10.1016/b978-0-12-819265-8.00005-x · Cited by 6
Ravikant, R., Kumari, P., Kumar, M., Roy, P., & Jeya, M. (2022) · Journal of Pure and Applied Microbiology · doi:10.22207/jpam.16.2.37 · Cited by 8
Baseline azithromycin resistance in the gut microbiota of preterm born infants
Gallacher, D. J., Zhang, L., Aboklaish, A. F., Mitchell, E., Wach, R., Marchesi, J. R., & Kotecha, S. (2023) · Pediatric Research · doi:10.1038/s41390-023-02743-7 · Cited by 6
Understanding the influence of the microbiome on childhood infections
Heston, S. M., Hurst, J. H., & Kelly, M. S. (2024) · Expert Review of Anti-infective Therapy · doi:10.1080/14787210.2024.2340664 · Cited by 5
Srinivasjois, R. M., Gebremedhin, A. T., Silva, D. T., Rao, S. C., & Pereira, G. F. (2023) · Journal of Paediatrics and Child Health · doi:10.1111/jpc.16318 · Cited by 5
O’Brien, C. E., Frese, S. A., Cernioglo, K., Damian-Medina, K., Mitchell, R. D., Casaburi, G., Melnyk, R. A., Henrick, B. M., & Smilowitz, J. T. (2025) · mSphere · doi:10.1128/msphere.00518-25 · Cited by 4
Self-citationDeposition of resistant bacteria and resistome through FMT in germ‐free piglets
Sun, J., Chen, Y., Ding, Y., Zhong, H., Wu, M., Liu, Z. H., & Ge, L. (2021) · Letters in Applied Microbiology · doi:10.1111/lam.13490 · Cited by 3
Arzamasov, A. A., Nakajima, A., Sakanaka, M., Ojima, M. N., Katayama, T., Rodionov, D. A., & Osterman, A. L. (2022) · bioRxiv (Cold Spring Harbor Laboratory) · doi:10.1101/2022.04.06.487429 · Cited by 3
The role of the gut microbiome in antibiotic-driven antimicrobial resistance
Joshi, G., Rani, S., Bharti, D., Panda, N., Chavan, P., Mathpal, S., Ramaiah, S., & Anbarasu, A. (2026) · Frontiers in Microbiology · doi:10.3389/fmicb.2026.1856738 · Cited by 3
The microbiome in infant gut health and development
Alipour, Z., Duman, H., Lee, J. J., Karav, S., & Frese, S. A. (2024) · Elsevier eBooks · doi:10.1016/b978-0-443-18979-1.00003-4 · Cited by 2
Self-citationStructures and Functions of Human Milk Oligosaccharides (HMOs)
Lebrilla, C. B., & Vinjamuri, A. (2022) · Elsevier eBooks · doi:10.1016/b978-0-12-821618-7.00023-7 · Cited by 2
Antimicrobial utilization in very-low-birth-weight infants: association with probiotic use
Ting, J. Y., Yoon, E. W., Fajardo, C. A., Daboval, T., Bertelle, V., Shah, P. S., Canadian Neonatal Network (CNN) Investigators, Shah, P. S., Beltempo, M., Kanungo, J., et al. (2022) · Journal of Perinatology · doi:10.1038/s41372-022-01382-w · Cited by 1
The Human Gut Microbiome and the Dissemination of Antibiotic Resistant Microbes
Idahmed, A., Sneed, K., & Pathak, Y. V. (2023) · Chemical & Pharmaceutical Research · doi:10.33425/2689-1050.1051 · Cited by 1
Distribution of Antibiotic-Resistant Genes in Intestines of Infants and Influencing Factors
Wang, Y.-C., Jiang, T., Mo, L., Lu, H.-Z., Quan, L.-H., Zhong, P., & Guan, Y. (2024) · Critical Reviews in Eukaryotic Gene Expression · doi:10.1615/critreveukaryotgeneexpr.v34.i8.60 · Cited by 1
Coates, N., John, D. A., Jordan, S. E., Storey, M., Thornton, C. A., Garaiová, I., Wang, D., Allen, S. J., Michael, D. R., Plummer, S., et al. (2025) · Microorganisms · doi:10.3390/microorganisms13050984 · Cited by 1
Yu, J., Allela, O. Q. B., Alkhazali, W. H., Bishoyi, A. K., Oweis, R. J., Varma, P., Kashyap, A., Panigrahi, R., Chauhan, A. S., Sameer, H. N., et al. (2026) · Microbial Pathogenesis · doi:10.1016/j.micpath.2026.108357 · Cited by 1
A Review of Probiotic Interventions for Necrotizing Enterocolitis and Sepsis in Preterm Infants
Thye, A. Y.-K., Lim, H. X., Kumari, Y., Tan, L. T., Letchumanan, V., Pusparajah, P., Chan, K., Lee, L., & Law, J. W. (2026) · International Journal of Molecular Sciences · doi:10.3390/ijms27083602 · Cited by 2
A Narrative Review of the Tale of the Dysbiotic Microbiome in the Preterm Neonate
Sowden, M., van Niekerk, E., Bulabula, A. N. H., & van Weissenbruch, M. M. (2023) · Dietetics · doi:10.3390/dietetics2040022 · Cited by 1
Avelino, D. R., Pinto, E. D., Silva, F. B. D., Guimarães, K. M., & Lopes, G. D. S. (2023) · Revista Contemporânea · doi:10.56083/rcv3n12-268 · Cited by 1
Gut Microbiota and Antibiotics: Dysbiosis and Antimicrobial Resistance
Imchen, M., Moopantakath, J., & Kumavath, R. (2021) · Elsevier eBooks · doi:10.1016/b978-0-12-819265-8.00049-8 · Cited by 1
Nguyen, M., Holdbrooks, H., Mishra, P. K., Abrantes, M. A., Eskew, S., Garma, M., Oca, C.-G., McGuckin, C., Hein, C. T., Mitchell, R. D., et al. (2020) · Research Square · doi:10.21203/rs.3.rs-92208/v1 · Cited by 1
Self-citationKuwelker, K., Langeland, N., Löhr, I. H., Gidion, J., Manyahi, J., Moyo, S. J., Blomberg, B., & Klingenberg, C. (2020) · doi:10.21203/rs.3.rs-70753/v1 · Cited by 1
Xin-ming, X., Feng, Q., Zhang, T., Cheng, Q., Gao, Y., Zhang, W., Wu, Q., Xu, K., Li, Y., Nguyen, N., et al. (2023) · Research Square · doi:10.21203/rs.3.rs-3010645/v1 · Cited by 1
Rossum, T. V., Haiß, A., Knoll, R. L., Marißen, J., Podlesny, D., Pagel, J., Bleskina, M., Vens, M., Fortmann, M. I., Siller, B., et al. (2024) · SSRN Electronic Journal · doi:10.2139/ssrn.4704736 · Cited by 1
Using difference-in-difference to understand the downside to antibiotic use during infancy
Thorman, A. W., & Taft, D. H. (2022) · Pediatric Research · doi:10.1038/s41390-022-02280-9
Kuwelker, K., Langeland, N., Löhr, I. H., Gidion, J., Manyahi, J., Moyo, S. J., Blomberg, B. A., & Klingenberg, C. (2021) · Figshare · doi:10.6084/m9.figshare.14516101
Larke, J. A., Heiss, B. E., Ehrlich, A. M., Taft, D. H., Raybould, H. E., Mills, D. A., & Slupsky, C. M. (2023) · Figshare · doi:10.6084/m9.figshare.24040727
Kuwelker, K., Langeland, N., Löhr, I. H., Gidion, J., Manyahi, J., Moyo, S. J., Blomberg, B. A., & Klingenberg, C. (2021) · Figshare · doi:10.6084/m9.figshare.14516110
Kuwelker, K., Langeland, N., Löhr, I. H., Gidion, J., Manyahi, J., Moyo, S. J., Blomberg, B. A., & Klingenberg, C. (2021) · Figshare · doi:10.6084/m9.figshare.14516104
Kuwelker, K., Langeland, N., Löhr, I. H., Gidion, J., Manyahi, J., Moyo, S. J., Blomberg, B. A., & Klingenberg, C. (2021) · Figshare · doi:10.6084/m9.figshare.14516107
Kuwelker, K., Langeland, N., Löhr, I. H., Gidion, J., Manyahi, J., Moyo, S. J., Blomberg, B. A., & Klingenberg, C. (2021) · Figshare · doi:10.6084/m9.figshare.14516113
Patangia, D. V., Grimaud, G. M., O’Shea, C.-A., Ryan, C. A., Dempsey, E., Stanton, C., & Ross, R. P. (2024) · Figshare · doi:10.6084/m9.figshare.26676569
Kong, W., Wu, B., Huang, Y., Liu, H., & Huang, C. (2026) · Frontiers in Allergy · doi:10.3389/falgy.2026.1789143
RetractedCAMEO: a CAZyme mapping engine optimized for HUMAnN
Bolino, M. J., & Frese, S. A. (2026) · Microbiology Resource Announcements · doi:10.1128/mra.00707-26
Self-citationInfluence of probiotics on faecal antibiotic resistome in neonates: a systematic review
Rath, C., Fursule, A., Wong, F., Rao, S. C., & Patole, S. (2026) · Pediatric Research · doi:10.1038/s41390-026-05356-y
Jarman, J. B., Torres, P. J., Baum, C., Tinoco, J., Sato, H., Rasteiro, C. S., Selbrede, R., Insel, R. A., Culler, S. J., & Dien, S. V. (2026) · Pediatric Research · doi:10.1038/s41390-026-05318-4
Bhagat, T., Goyal, A., & Chatterji, T. (2026) · Future Microbiology · doi:10.1080/17460913.2026.2715938
Yang, M., He, H., Fu, J., Yu, Z., Li, W., Kai, L., Hu, C., Feng, J., Shan, T., Wang, Y., et al. (2026) · Nutrients · doi:10.3390/nu18172776
The impact of prophylactic azithromycin on the developing preterm gut microbiome and resistome
Ahearn-Ford, S., Aboklaish, A. F., Young, G. R., Lowe, J., Masi, A. C., Gallacher, D. J., Marchesi, J. R., Berrington, J. E., Kotecha, S., & Stewart, C. J. (2026) · Gut Microbes · doi:10.1080/19490976.2026.2748147
Metadata
- Authors
- Casaburi, G., Duar, R. M., Vance, D. P., Mitchell, R., Contreras, L., Frese, S. A., Smilowitz, J. T., & Underwood, M. A.
- Affiliations
- Infinant Health Inc. (United States) (US)
- University of Nebraska–Lincoln (US)
- University of California, Davis (US)
- University of California Davis Medical Center (US)
- Corresponding author
- Smilowitz, Jennifer T.
- Underwood, Mark A.
- ORCID
- Venue
- Antimicrobial Resistance & Infection Control
- Published
- 2019-08-14
- Volume
- 8
- Issue
- 1
- Pages
- 131-131
- ISSN
- 2047-2994 (ISSN-L)
- PMC
- PMC6693174
- OpenAlex
- W2967608930
- Cited by
- 101
- References
- 86
- Citations by year
- 2026: 12 · 2025: 6 · 2024: 14 · 2023: 16 · 2022: 20 · 2021: 21 · 2020: 12
- FWCI
- 4.39
- Type
- journal article
- Language
- en
- Open access
- gold
- doi.org
- Locations
- Antimicrobial Resistance and Infection Control (publishedVersion, cc-by)
- Europe PMC (PubMed Central) (publishedVersion, cc-by)
- PubMed Central (publishedVersion, cc-by)
- PubMed (publishedVersion)
- DOAJ (DOAJ: Directory of Open Access Journals) (submittedVersion, cc-by-sa)
- eScholarship (California Digital Library) (submittedVersion, cc-by)
- Funders
- Evolve Biosystems (n/a)
- Topics
- Life Sciences › Biochemistry, Genetics and Molecular Biology › Molecular Biology › Gut microbiota and health
- Health Sciences › Medicine › Microbiology (medical) › Antibiotic Resistance in Bacteria
- Health Sciences › Nursing › Nutrition and Dietetics › Infant Nutrition and Health
- Keywords
- antibiotic resistance genes, infant gut microbiota, probiotic supplementation, breastfeeding, coliform bacteria, extended-spectrum beta-lactamase, minimum inhibitory concentration, Escherichia, Clostridium, Staphylococcus, vaginal delivery, antibiotic resistance spread
- MeSH terms
- Gastrointestinal Microbiome, Bifidobacterium longum subspecies infantis, Whole Genome Sequencing, Anti-Bacterial Agents, Bacteria, beta-Lactamases, Breast Feeding, Drug Resistance, Microbial, Feces, Humans, Infant, Newborn, Microbial Sensitivity Tests, Case-Control Studies, Probiotics, Metagenomics, High-Throughput Nucleotide Sequencing
About these checks
Registry, retraction, Cites and statistics results are computed, not judged, with one exception: a printed reference that no index lists is read once by a model before it counts as a citation error. Claims are extracted by a model and kept only when their quote appears verbatim in the text; each cited source is then checked, with a model’s help, for whether it says what the claim relies on. Those verdicts can be wrong — read the claim’s quote and the cited source before relying on one.
Statistics and arithmetic are recomputed, not judged.
Confidence bands are shown only for fields calibrated on our annotated test set. None is calibrated yet, so no band is shown.
What counts as a claim ›How we measure confidence ›How we check this ›
Are you an author, or do you see a problem with this page? Request a review
