

The DOI matches its Crossref record; 67 of the 67 references it cites were found in a registry or an index.
Potential and active functions in the gut microbiota of a healthy human cohort
Open accessAbstract
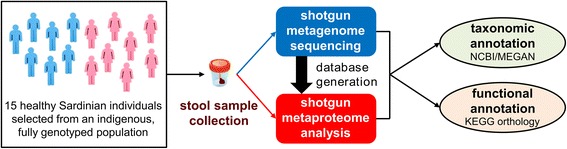
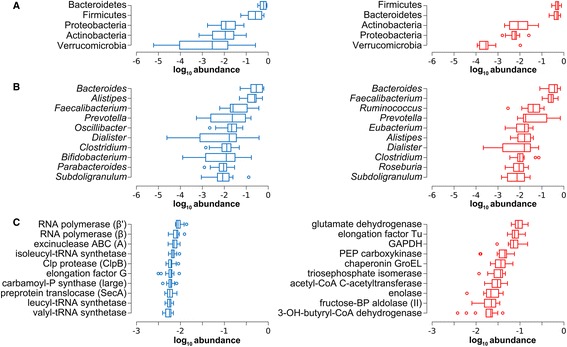
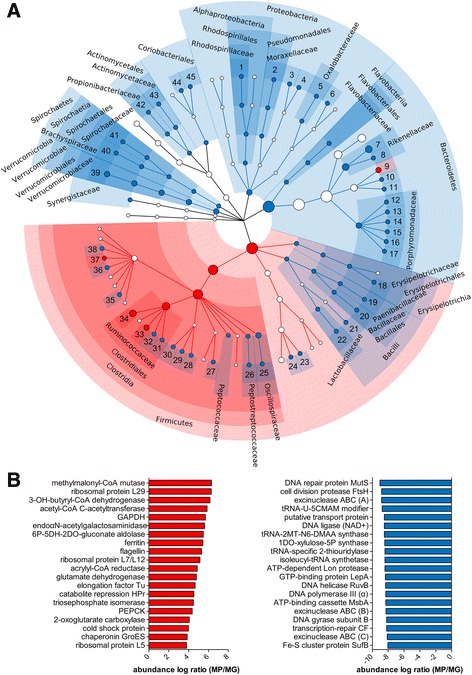
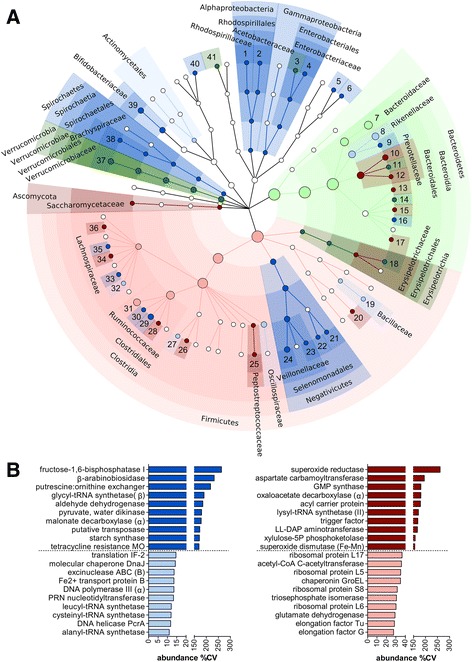
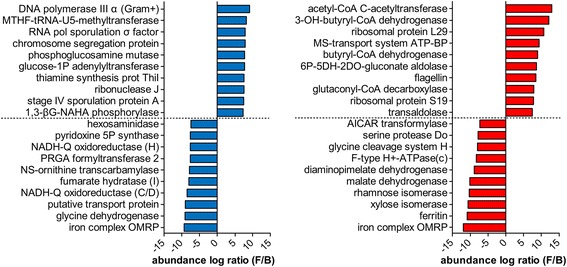
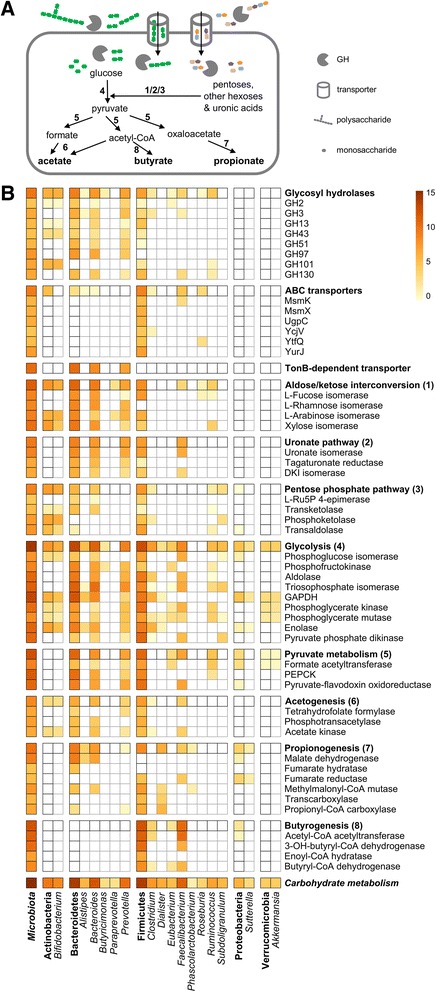
BACKGROUND: The study of the gut microbiota (GM) is rapidly moving towards its functional characterization by means of shotgun meta-omics. In this context, there is still no consensus on which microbial functions are consistently and constitutively expressed in the human gut in physiological conditions. Here, we selected a cohort of 15 healthy subjects from a native and highly monitored Sardinian population and analyzed their GMs using shotgun metaproteomics, with the aim of investigating GM functions actually expressed in a healthy human population. In addition, shotgun metagenomics was employed to reveal GM functional potential and to compare metagenome and metaproteome profiles in a combined taxonomic and functional fashion. RESULTS: Metagenomic and metaproteomic data concerning the taxonomic structure of the GM under study were globally comparable. On the contrary, a considerable divergence between genetic potential and functional activity of the human healthy GM was observed, with the metaproteome displaying a higher plasticity, compared to the lower inter-individual variability of metagenome profiles. The taxon-specific contribution to functional activities and metabolic tasks was also examined, giving insights into the peculiar role of several GM members in carbohydrate metabolism (including polysaccharide degradation, glycan transport, glycolysis, and short-chain fatty acid production). Noteworthy, Firmicutes-driven butyrogenesis (mainly due to Faecalibacterium spp.) was shown to be the metabolic activity with the highest expression rate and the lowest inter-individual variability in the study cohort, in line with the previously reported importance of the biosynthesis of this microbial product for the gut homeostasis. CONCLUSIONS: Our results provide detailed and taxon-specific information regarding functions and pathways actively working in a healthy GM. The reported discrepancy between expressed functions and functional potential suggests that caution should be used before drawing functional conclusions from metagenomic data, further supporting metaproteomics as a fundamental approach to characterize the human GM metabolic functions and activities.
Overview
The claims and statistics of this paper haven’t been checked yet.
Run the check — free, no account needed. It reads the open-access text and checks the sources it cites.
Integrity signals
Registry
Cites
Statistics
Figures
Verification
Claims the paper makes
The claims and statistics of this paper haven’t been checked yet.
Run the check — free, no account needed. It reads the open-access text and checks the sources it cites.
Claims other papers make about this one
Each is checked against this paper’s own text: does it say what the citing paper says it does?
In the citing paper
“actual metabolic activity of the gut microbiome may diverge from its functional potential (Tanca et al., 2017).”
From Gut reactions: Breaking down xenobiotic–microbiome interactions (2019) · cites this paper as Tanca et al., 2017
Self-check
Percentages, sums and reported differences re-computed from the paper’s own numbers.
The self-check needs the paper’s full text.
Citations
Cites
Search and clustering orders of magnitude faster than BLAST
Edgar, R. C. (2010) · Bioinformatics · doi:10.1093/bioinformatics/btq461 · Cited by 21,098
Fast and sensitive protein alignment using DIAMOND
Buchfink, B., Xie, C., & Huson, D. H. (2015) · Nature Methods · doi:10.1038/nmeth.3176 · Cited by 14,201
Structure, function and diversity of the healthy human microbiome
The Human Microbiome Project Consortium (2012) · Nature · doi:10.1038/nature11234 · Cited by 11,726
Universal sample preparation method for proteome analysis
Wiśniewski, J. R., Zougman, A., Nagaraj, N., & Mann, M. (2009) · Nature Methods · doi:10.1038/nmeth.1322 · Cited by 8,352
KEGG as a reference resource for gene and protein annotation
Kanehisa, M., Sato, Y., Kawashima, M., Furumichi, M., & Tanabe, M. (2016) · Nucleic Acids Research · doi:10.1093/nar/gkv1070 · Cited by 7,387
UniProt: a hub for protein information
The UniProt Consortium (2015) · Nucleic Acids Research · doi:10.1093/nar/gku989 · Cited by 5,106
Metsalu, T., & Vilo, J. (2015) · Nucleic Acids Research · doi:10.1093/nar/gkv468 · Cited by 3,770
2016 update of the PRIDE database and its related tools
Vizcaíno, J. A., Csordás, A., del‐Toro, N., Dianes, J. A., Griss, J., Lavidas, I., Mayer, G., Pérez‐Riverol, Y., Reisinger, F., Ternent, T., et al. (2015) · Nucleic Acids Research · doi:10.1093/nar/gkv1145 · Cited by 3,440
Human Genetics Shape the Gut Microbiome
Goodrich, J. K., Waters, J. L., Poole, A. C., Sutter, J. L., Koren, O., Blekhman, R., Beaumont, M., Van Treuren, W., Knight, R., Bell, J. T., et al. (2014) · Cell · doi:10.1016/j.cell.2014.09.053 · Cited by 3,164
Population-level analysis of gut microbiome variation
Falony, G., Joossens, M., Vieira-Silva, S., Wang, J., Darzi, Y., Faust, K., Kurilshikov, A., Bonder, M. J., Valles-Colomer, M., Vandeputte, D., et al. (2016) · Science · doi:10.1126/science.aad3503 · Cited by 2,400
Human gut microbes impact host serum metabolome and insulin sensitivity
Pedersen, H. K., Gudmundsdottir, V., Nielsen, H. B., Hyotylainen, T., Nielsen, T., Jensen, B. A. H., Forslund, K., Hildebrand, F., Prifti, E., Falony, G., et al. (2016) · Nature · doi:10.1038/nature18646 · Cited by 2,116
Dao, M. C., Everard, A., Aron-Wisnewsky, J., Sokolovska, N., Prifti, E., Verger, E. O., Kayser, B. D., Levenez, F., Chilloux, J., Hoyles, L., et al. (2016) · Gut · doi:10.1136/gutjnl-2014-308778 · Cited by 1,931
Population-based metagenomics analysis reveals markers for gut microbiome composition and diversity
Zhernakova, A., Kurilshikov, A., Bonder, M. J., Tigchelaar, E. F., Schirmer, M., Vatanen, T., Mujagic, Z., Vila, A. V., Falony, G., Vieira-Silva, S., et al. (2016) · Science · doi:10.1126/science.aad3369 · Cited by 1,914
Machiels, K., Joossens, M., Sabino, J., De Preter, V., Arijs, I., Eeckhaut, V., Ballet, V., Claes, K., Van Immerseel, F., Verbeke, K., et al. (2014) · Gut · doi:10.1136/gutjnl-2013-304833 · Cited by 1,904
Kovatcheva-Datchary, P., Nilsson, A., Akrami, R., Lee, Y. S., De Vadder, F., Arora, T., Hallen, A., Martens, E., Björck, I., & Bäckhed, F. (2015) · Cell Metabolism · doi:10.1016/j.cmet.2015.10.001 · Cited by 1,731
Error filtering, pair assembly and error correction for next-generation sequencing reads
Edgar, R. C., & Flyvbjerg, H. (2015) · Bioinformatics · doi:10.1093/bioinformatics/btv401 · Cited by 1,315
Bifidobacteria and Their Role as Members of the Human Gut Microbiota
O’Callaghan, A. A., & van Sinderen, D. (2016) · Frontiers in Microbiology · doi:10.3389/fmicb.2016.00925 · Cited by 1,160
Genomic variation landscape of the human gut microbiome
Schloissnig, S., Arumugam, M., Sunagawa, S., Mitreva, M., Tap, J., Zhu, A., Waller, A., Mende, D. R., Kultima, J. R., Martin, J., et al. (2013) · Nature · doi:10.1038/nature11711 · Cited by 907
Zoetendal, E. G., von Wright, A., Vilpponen-Salmela, T., Ben-Amor, K., Akkermans, A. D. L., & de Vos, W. M. (2002) · Applied and Environmental Microbiology · doi:10.1128/aem.68.7.3401-3407.2002 · Cited by 868
FragGeneScan: predicting genes in short and error-prone reads
Rho, M., Tang, H., & Ye, Y. (2010) · Nucleic Acids Research · doi:10.1093/nar/gkq747 · Cited by 865
Compact graphical representation of phylogenetic data and metadata with GraPhlAn
Asnicar, F., Weingart, G., Tickle, T. L., Huttenhower, C., & Segata, N. (2015) · PeerJ · doi:10.7717/peerj.1029 · Cited by 818
BoxPlotR: a web tool for generation of box plots
Spitzer, M., Wildenhain, J., Rappsilber, J., & Tyers, M. (2014) · Nature Methods · doi:10.1038/nmeth.2811 · Cited by 809
Microbiota-Produced Succinate Improves Glucose Homeostasis via Intestinal Gluconeogenesis
Vadder, F. D., Kovatcheva‐Datchary, P., Zitoun, C., Duchampt, A., Bäckhed, F., & Mithieux, G. (2016) · Cell Metabolism · doi:10.1016/j.cmet.2016.06.013 · Cited by 779
Less label, more free: Approaches in label‐free quantitative mass spectrometry
Neilson, K. A., Ali, N., Muralidharan, S., Mirzaei, M., Mariani, M., Assadourian, G., Lee, A., Sluyter, S. C. V., & Haynes, P. A. (2011) · PROTEOMICS · doi:10.1002/pmic.201000553 · Cited by 731
Relating the metatranscriptome and metagenome of the human gut
Franzosa, E. A., Morgan, X. C., Segata, N., Waldron, L., Reyes, J. A., Earl, A. M., Giannoukos, G., Boylan, M. R., Ciulla, D., Gevers, D., et al. (2014) · Proceedings of the National Academy of Sciences · doi:10.1073/pnas.1319284111 · Cited by 731
Roopchand, D. E., Carmody, R. N., Kuhn, P., Moskal, K., Rojas-Silva, P., Turnbaugh, P. J., & Raskin, I. (2015) · Diabetes · doi:10.2337/db14-1916 · Cited by 678
Takahashi, K., Nishida, A., Fujimoto, T., Fujii, M., Shioya, M., Imaeda, H., Inatomi, O., Bamba, S., Andoh, A., & Sugimoto, M. (2016) · Digestion · doi:10.1159/000441768 · Cited by 619
Cockburn, D. W., & Koropatkin, N. M. (2016) · Journal of Molecular Biology · doi:10.1016/j.jmb.2016.06.021 · Cited by 561
Heritability of Cardiovascular and Personality Traits in 6,148 Sardinians
Pilia, G., Chen, W., Scuteri, A., Orrù, M., Albai, G., Dei, M., Lai, S., Usala, G., Lai, M., Loi, P., et al. (2006) · PLoS Genetics · doi:10.1371/journal.pgen.0020132 · Cited by 551
Shotgun metaproteomics of the human distal gut microbiota
VerBerkmoes, N. C., Russell, A. L., Shah, M. B., Godzik, A., Rosenquist, M., Halfvarson, J., Lefsrud, M. G., Apajalahti, J., Tysk, C., Hettich, R. L., et al. (2008) · The ISME Journal · doi:10.1038/ismej.2008.108 · Cited by 544
Intestinal microbiota in health and disease: Role of bifidobacteria in gut homeostasis
Tojo, R. (2014) · World Journal of Gastroenterology · doi:10.3748/wjg.v20.i41.15163 · Cited by 533
Chapter 12: Human Microbiome Analysis
Morgan, X. C., & Huttenhower, C. (2012) · PLoS Computational Biology · doi:10.1371/journal.pcbi.1002808 · Cited by 496
Metagenome Sequencing of the Hadza Hunter-Gatherer Gut Microbiota
Rampelli, S., Schnorr, S. L., Consolandi, C., Turroni, S., Severgnini, M., Peano, C., Brigidi, P., Crittenden, A. N., Henry, A. G., & Candela, M. (2015) · Current Biology · doi:10.1016/j.cub.2015.04.055 · Cited by 399
Metatranscriptomic Approach to Analyze the Functional Human Gut Microbiota
Gosalbes, M. J., Durbán, A., Pignatelli, M., Abellan, J. J., Jiménez‐Hernández, N., Pérez‐Cobas, A. E., Latorre, A., & Moyá, A. (2011) · PLoS ONE · doi:10.1371/journal.pone.0017447 · Cited by 395
Integrated Metagenomics/Metaproteomics Reveals Human Host-Microbiota Signatures of Crohn's Disease
Erickson, A. R., Cantarel, B. L., Lamendella, R., Darzi, Y., Mongodin, E. F., Pan, C., Shah, M., Halfvarson, J., Tysk, C., Henrissat, B., et al. (2012) · PLoS ONE · doi:10.1371/journal.pone.0049138 · Cited by 395
Sidore, C., Busonero, F., Maschio, A., Porcu, E., Naitza, S., Żołędziewska, M., Mulas, A., Pistis, G., Steri, M., Danjou, F., et al. (2015) · Nature Genetics · doi:10.1038/ng.3368 · Cited by 386
Self-citationThe Neuro-endocrinological Role of Microbial Glutamate and GABA Signaling
Mazzoli, R., & Pessione, E. (2016) · Frontiers in Microbiology · doi:10.3389/fmicb.2016.01934 · Cited by 383
Leonel, A. J., & Alvarez-Leite, J. I. (2012) · Current Opinion in Clinical Nutrition & Metabolic Care · doi:10.1097/mco.0b013e32835665fa · Cited by 362
Nayfach, S., & Pollard, K. S. (2015) · Genome biology · doi:10.1186/s13059-015-0611-7 · Cited by 359
Integrated multi-omics of the human gut microbiome in a case study of familial type 1 diabetes
Heintz-Buschart, A., May, P., Laczny, C. C., Lebrun, L. A., Bellora, C., Krishna, A., Wampach, L., Schneider, J. G., Hogan, A., de Beaufort, C., et al. (2016) · Nature Microbiology · doi:10.1038/nmicrobiol.2016.180 · Cited by 316
Toward Accurate and Quantitative Comparative Metagenomics
Nayfach, S., & Pollard, K. S. (2016) · Cell · doi:10.1016/j.cell.2016.08.007 · Cited by 304
Functional analysis of natural microbial consortia using community proteomics
VerBerkmoes, N. C., Denef, V. J., Hettich, R. L., & Banfield, J. F. (2009) · Nature Reviews Microbiology · doi:10.1038/nrmicro2080 · Cited by 273
Is butyrate the link between diet, intestinal microbiota and obesity-related metabolic diseases?
Brahe, L. K., Astrup, A., & Larsen, L. H. (2013) · Obesity Reviews · doi:10.1111/obr.12068 · Cited by 264
Fernie, A. R., & Stitt, M. (2012) · PLANT PHYSIOLOGY · doi:10.1104/pp.112.193235 · Cited by 220
Microbial Community Analysis Using MEGAN
Huson, D. H., & Weber, N. (2013) · Methods in enzymology on CD-ROM/Methods in enzymology · doi:10.1016/b978-0-12-407863-5.00021-6 · Cited by 213
Jones, M. B., Highlander, S. K., Anderson, E. L., Li, W., Dayrit, M., Klitgord, N., Fabani, M. M., Seguritan, V., Green, J., Pride, D. T., et al. (2015) · Proceedings of the National Academy of Sciences · doi:10.1073/pnas.1519288112 · Cited by 209
Kolmeder, C. A., de Been, M., Nikkilä, J., Ritamo, I., Mättö, J., Valmu, L., Salojärvi, J., Palva, A., Salonen, A., & de Vos, W. M. (2012) · PLoS ONE · doi:10.1371/journal.pone.0029913 · Cited by 200
Youseff, B. H., Holbrook, E. D., Smolnycki, K. A., & Rappleye, C. A. (2012) · PLoS Pathogens · doi:10.1371/journal.ppat.1002713 · Cited by 152
Shankar, V., Gouda, M., Moncivaiz, J. D., Gordon, A., Reo, N. V., Hussein, L., & Paliy, O. (2017) · mSystems · doi:10.1128/msystems.00169-16 · Cited by 152
Zhang, Z., Wu, X., Cao, S., Wang, L., Wang, D., Yang, H., Feng, Y., Wang, S., & Li, L. (2016) · Oncotarget · doi:10.18632/oncotarget.9306 · Cited by 149
The impact of sequence database choice on metaproteomic results in gut microbiota studies
Tanca, A., Palomba, A., Fraumene, C., Pagnozzi, D., Manghina, V., Deligios, M., Muth, T., Rapp, E., Martens, L., Addis, M. F., et al. (2016) · Microbiome · doi:10.1186/s40168-016-0196-8 · Cited by 134
Self-citationTanca, A., Palomba, A., Deligios, M., Cubeddu, T., Fraumene, C., Biosa, G., Pagnozzi, D., Addis, M. F., & Uzzau, S. (2013) · PLoS ONE · doi:10.1371/journal.pone.0082981 · Cited by 119
Self-citationA straightforward and efficient analytical pipeline for metaproteome characterization
Tanca, A., Palomba, A., Pisanu, S., Deligios, M., Fraumene, C., Manghina, V., Pagnozzi, D., Addis, M. F., & Uzzau, S. (2014) · Microbiome · doi:10.1186/s40168-014-0049-2 · Cited by 106
Self-citationTanca, A., Biosa, G., Pagnozzi, D., Addis, M. F., & Uzzau, S. (2013) · PROTEOMICS · doi:10.1002/pmic.201200478 · Cited by 105
Self-citationLeal‐Díaz, A. M., Noriega, L. G., Torre-Villalvazo, I., Torres, N., Alemán, G., López‐Romero, P., Sánchez‐Tapia, M., Aguilar‐López, M., Furuzawa‐Carballeda, J., Velázquez‐Villegas, L. A., et al. (2016) · Scientific Reports · doi:10.1038/srep34242 · Cited by 96
Metaproteomic data analysis at a glance: advances in computational microbial community proteomics
Muth, T., Renard, B. Y., & Martens, L. (2016) · Expert Review of Proteomics · doi:10.1080/14789450.2016.1209418 · Cited by 92
Role of prokaryotic Cu,Zn superoxide dismutase in pathogenesis
Battistoni, A. (2003) · Biochemical Society Transactions · doi:10.1042/bst0311326 · Cited by 89
Tanca, A., Manghina, V., Fraumene, C., Palomba, A., Abbondio, M., Deligios, M., Silverman, M. A., & Uzzau, S. (2017) · Frontiers in Microbiology · doi:10.3389/fmicb.2017.00391 · Cited by 85
Self-citationKolmeder, C. A., Salojärvi, J., Ritari, J., de Been, M., Raes, J., Falony, G., Vieira‐Silva, S., Kekkonen, R. A., Corthals, G. L., Palva, A., et al. (2016) · PLoS ONE · doi:10.1371/journal.pone.0153294 · Cited by 83
The effect of DNA extraction methodology on gut microbiota research applications
Gerasimidis, K., Bertz, M., Quince, C., Brunner, K., Bruce, A., Combet, E., Calus, S., Loman, N. J., & Ijaz, U. Z. (2016) · BMC Research Notes · doi:10.1186/s13104-016-2171-7 · Cited by 83
Tanca, A., Palomba, A., Pisanu, S., Addis, M. F., & Uzzau, S. (2015) · PROTEOMICS · doi:10.1002/pmic.201400573 · Cited by 77
Self-citationIntegrating ecological and engineering concepts of resilience in microbial communities
Song, H.-S., Renslow, R. S., Fredrickson, J. K., & Lindemann, S. R. (2015) · Frontiers in Microbiology · doi:10.3389/fmicb.2015.01298 · Cited by 76
Carvajal‐Rodríguez, A., & de Uña‐Álvarez, J. (2011) · PLoS ONE · doi:10.1371/journal.pone.0024700 · Cited by 75
Strategies for Metagenomic-Guided Whole-Community Proteomics of Complex Microbial Environments
Cantarel, B. L., Erickson, A. R., VerBerkmoes, N. C., Erickson, B. K., Carey, P. A., Pan, C., Shah, M. B., Mongodin, E. F., Jansson, J. K., Fraser, C. M., et al. (2011) · PLoS ONE · doi:10.1371/journal.pone.0027173 · Cited by 63
Functional Gene Composition, Diversity and Redundancy in Microbial Stream Biofilm Communities
Dopheide, A., Lear, G., He, Z., Zhou, J. Z., & Lewis, G. D. (2015) · PLoS ONE · doi:10.1371/journal.pone.0123179 · Cited by 51
Fitness Trade-Offs Determine the Role of the Molecular Chaperonin GroEL in Buffering Mutations
Sabater‐Muñoz, B., Prats-Escriche, M., Montagud‐Martínez, R., López‐Cerdán, A., Toft, C., Aguilar-Rodríguez, J., Wagner, A., & Fares, M. A. (2015) · Molecular Biology and Evolution · doi:10.1093/molbev/msv144 · Cited by 50
Importance of Glutamate Dehydrogenase (GDH) in Clostridium difficile Colonization In Vivo
Girinathan, B. P., Braun, S. E., Sirigireddy, A. R., Lopez, J. E., & Govind, R. (2016) · PLoS ONE · doi:10.1371/journal.pone.0160107 · Cited by 33
Cited by
Sorted by citations
The sponge holobiont in a changing ocean: from microbes to ecosystems
Pita, L., Rix, L., Slaby, B. M., Franke, A., & Hentschel, U. (2018) · Microbiome · doi:10.1186/s40168-018-0428-1 · Cited by 603
Cullin, N., Azevedo Antunes, C., Straussman, R., Stein-Thoeringer, C. K., & Elinav, E. (2021) · Cancer Cell · doi:10.1016/j.ccell.2021.08.006 · Cited by 578
Microbiome and Human Health: Current Understanding, Engineering, and Enabling Technologies
Aggarwal, N., Kitano, S., Puah, G. R. Y., Kittelmann, S., Hwang, I. Y., & Chang, M. W. (2022) · Chemical Reviews · doi:10.1021/acs.chemrev.2c00431 · Cited by 571
The Microbiota–Gut–Brain Axis in Psychiatric Disorders
Góralczyk-Bińkowska, A., Szmajda‐Krygier, D., & Kozłowska, E. (2022) · International Journal of Molecular Sciences · doi:10.3390/ijms231911245 · Cited by 569
McGuinness, A. J., Davis, J. A., Dawson, S. L., Loughman, A., Collier, F., O’Hely, M., Simpson, C. A., Green, J., Marx, W., Hair, C., et al. (2022) · Molecular Psychiatry · doi:10.1038/s41380-022-01456-3 · Cited by 502
Metadata
- Authors
- Tanca, A., Abbondio, M., Palomba, A., Fraumene, C., Manghina, V., Cucca, F., Fiorillo, E., & Uzzau, S.
- Affiliations
- University of Sassari (IT)
- Institute of Genetic and Biomedical Research (IT)
- Corresponding author
- Uzzau, Sergio
- ORCID
- Venue
- Microbiome
- Published
- 2017-07-14
- Volume
- 5
- Issue
- 1
- Pages
- 79-79
- ISSN
- 2049-2618 (ISSN-L)
- PMC
- PMC5513205
- OpenAlex
- W2735061408
- Cited by
- 172
- References
- 67
- Citations by year
- 2026: 10 · 2025: 12 · 2024: 20 · 2023: 21 · 2022: 23 · 2021: 18 · 2020: 12 · 2019: 37 · 2018: 16 · 2017: 3
- FWCI
- 7.60
- Type
- journal article
- Language
- en
- Open access
- gold
- doi.org
- Locations
- Microbiome (publishedVersion, cc-by)
- PubMed Central (publishedVersion, cc-by)
- PubMed (publishedVersion)
- UnissResearch (Università degli Studi di Sassari) (submittedVersion, cc-by-nc-nd)
- DOAJ (DOAJ: Directory of Open Access Journals) (submittedVersion)
- Funders
- Sardegna Ricerche (ex art. 26 LR 37/98 - 2014)
- Università degli Studi di Sassari (Doctoral Fellowships from the International PhD Course in Life Sciences and Biotechnologies)
- National Institute on Aging (N01-AG-1-2109 and HHSN271201100005C)
- Fondazione Banco di Sardegna (U1301.2015/AI.1157.BE)
- Topics
- Life Sciences › Biochemistry, Genetics and Molecular Biology › Molecular Biology › Gut microbiota and health
- Health Sciences › Dentistry › Periodontics › Oral microbiology and periodontitis research
- Life Sciences › Agricultural and Biological Sciences › Food Science › Probiotics and Fermented Foods
- Keywords
- gut microbiota, interindividual variability, carbohydrate metabolism, polysaccharide degradation, glycolysis, short-chain fatty acids, Faecalibacterium, Firmicutes, Sardinian population, intestinal homeostasis
- MeSH terms
- Bacillota, Firmicutes, Gastrointestinal Microbiome, Faecalibacterium, Adult, Bacteria, Fatty Acids, Volatile, Female, Homeostasis, Humans, Italy, Male, Middle Aged, Cohort Studies, Proteomics, Carbohydrate Metabolism, Biosynthetic Pathways, Metagenome, Young Adult, Metagenomics, Healthy Volunteers
About these checks
Registry, retraction, Cites and statistics results are computed, not judged, with one exception: a printed reference that no index lists is read once by a model before it counts as a citation error. Claims are extracted by a model and kept only when their quote appears verbatim in the text; each cited source is then checked, with a model’s help, for whether it says what the claim relies on. Those verdicts can be wrong — read the claim’s quote and the cited source before relying on one.
Statistics and arithmetic are recomputed, not judged.
Confidence bands are shown only for fields calibrated on our annotated test set. None is calibrated yet, so no band is shown.
What counts as a claim ›How we measure confidence ›How we check this ›
Are you an author, or do you see a problem with this page? Request a review
