

The DOI matches its Crossref record; 71 of the 71 references it cites were found in a registry or an index.
Host genetics influence the rumen microbiota and heritable rumen microbial features associate with feed efficiency in cattle
Open accessAbstract
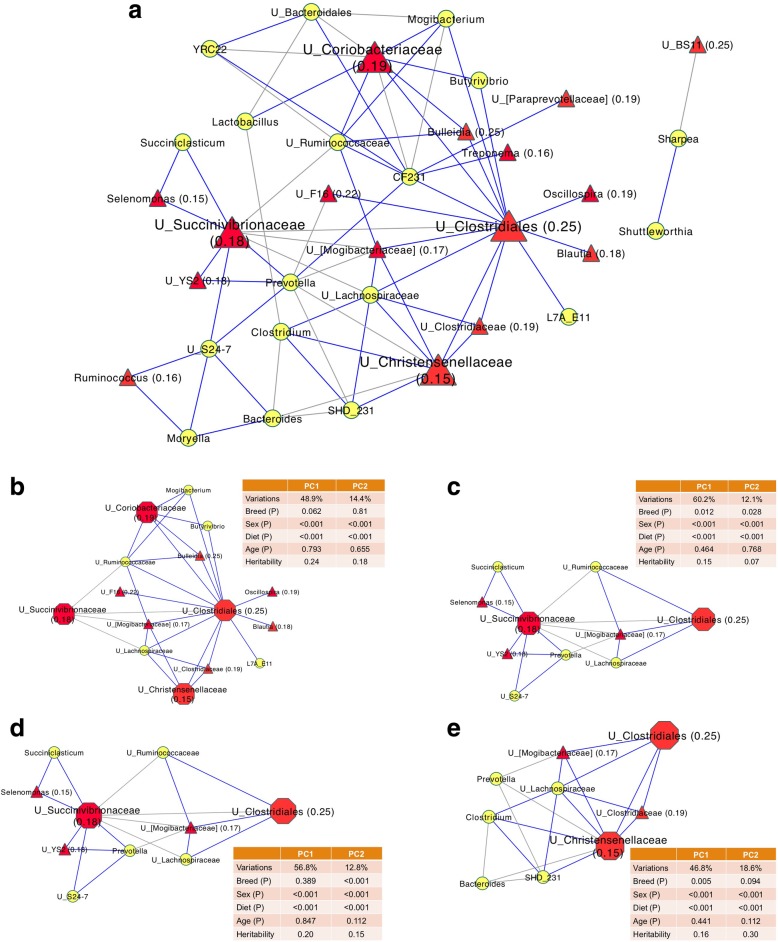
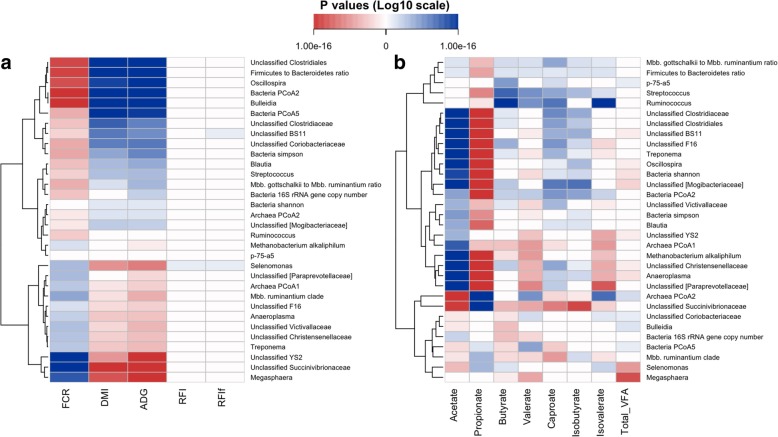
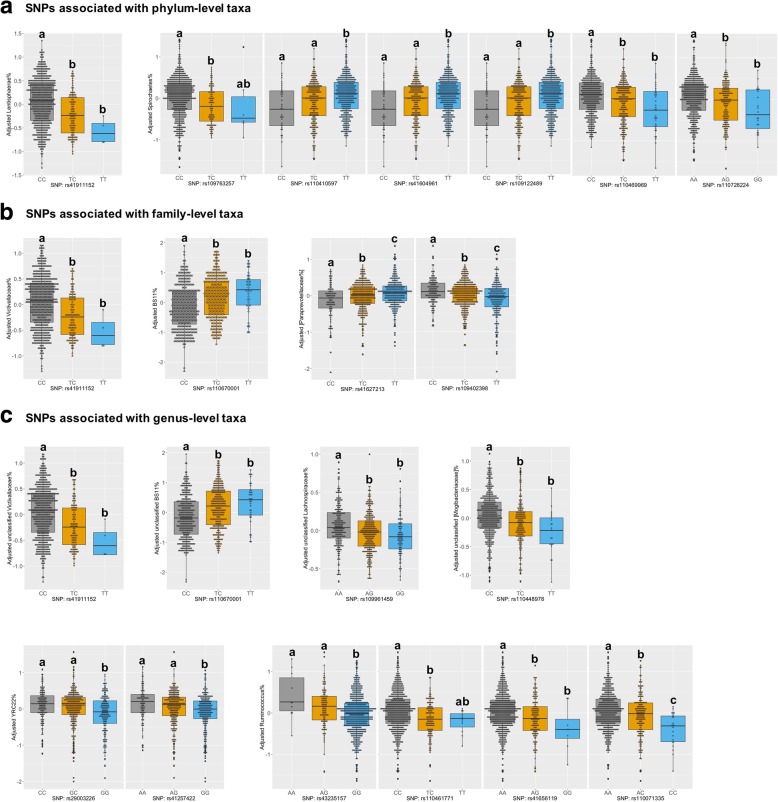
The symbiotic rumen microbiota is essential for the digestion of plant fibers and contributes to the variation of production and health traits in ruminants. However, to date, the heritability of rumen microbial features and host genetic components associated with the rumen microbiota, as well as whether such genetic components are animal performance relevant, are largely unknown. In the present study, we assessed rumen microbiota from a cohort of 709 beef cattle and showed that multiple factors including breed, sex, and diet drove the variation of rumen microbiota among animals. The diversity indices, the relative abundance of ~ 34% of microbial taxa (59 out of 174), and the copy number of total bacteria had a heritability estimate ( h 2 ) ≥ 0.15, suggesting that they are heritable elements affected by host additive genetics. These moderately heritable rumen microbial features were also found to be associated with host feed efficiency traits and rumen metabolic measures (volatile fatty acids). Moreover, 19 single nucleotide polymorphisms (SNPs) located on 12 bovine chromosomes were found to be associated with 14 (12 of them had h 2 ≥ 0.15) rumen microbial taxa, and five of these SNPs were known quantitative trait loci for feed efficiency in cattle. These findings suggest that some rumen microbial features are heritable and could be influenced by host genetics, highlighting a potential to manipulate and obtain a desirable and efficient rumen microbiota using genetic selection and breeding. It could be a useful strategy to further improve feed efficiency and optimize rumen fermentation through targeting both cattle and their rumen microbiota.
Overview
The claims and statistics of this paper haven’t been checked yet.
Run the check — free, no account needed. It reads the open-access text and checks the sources it cites.
Integrity signals
Registry
Cites
Statistics
Figures
Verification
Claims the paper makes
The claims and statistics of this paper haven’t been checked yet.
Run the check — free, no account needed. It reads the open-access text and checks the sources it cites.
Claims other papers make about this one
Each is checked against this paper’s own text: does it say what the citing paper says it does?
The cited source says what the claim attributes to it.
In the citing paper
“However, genetic manipulation of rumen microbiota is also possible through different techniques as host genetics influences some heritable microbial traits (81–83).”
From Phytogenic Additives Can Modulate Rumen Microbiome to Mediate Fermentation Kinetics and Methanogenesis Through Exploiting Diet–Microbe Interaction (2020) · cites this paper as [81]
Self-check
Percentages, sums and reported differences re-computed from the paper’s own numbers.
The self-check needs the paper’s full text.
Citations
Cites
Controlling the False Discovery Rate: A Practical and Powerful Approach to Multiple Testing
Benjamini, Y., & Hochberg, Y. (1995) · Journal of the Royal Statistical Society Series B: Statistical Methodology · doi:10.1111/j.2517-6161.1995.tb02031.x · Cited by 109,482
Basic local alignment search tool
Altschul, S. F., Gish, W., Miller, W., Myers, E. W., & Lipman, D. J. (1990) · Journal of Molecular Biology · doi:10.1006/jmbi.1990.9999 · Cited by 98,669
Cytoscape: A software Environment for integrated models of biomolecular interaction networks
Shannon, P., Markiel, A., Ozier, O., Baliga, N. S., Wang, J. T., Ramage, D., Amin, N., Schwikowski, B., & Ideker, T. (2003) · Genome Research · doi:10.1101/gr.1239303 · Cited by 51,888
Search and clustering orders of magnitude faster than BLAST
Edgar, R. C. (2010) · Bioinformatics · doi:10.1093/bioinformatics/btq461 · Cited by 21,098
Schloss, P. D., Westcott, S. L., Ryabin, T., Hall, J. R., Hartmann, M., Hollister, E. B., Lesniewski, R. A., Oakley, B. B., Parks, D. H., Robinson, C. J., et al. (2009) · Applied and Environmental Microbiology · doi:10.1128/aem.01541-09 · Cited by 19,549
UCHIME improves sensitivity and speed of chimera detection
Edgar, R. C., Haas, B. J., Clemente, J. C., Quince, C., & Knight, R. (2011) · Bioinformatics · doi:10.1093/bioinformatics/btr381 · Cited by 15,114
Diet rapidly and reproducibly alters the human gut microbiome
David, L. A., Maurice, C. F., Carmody, R. N., Gootenberg, D. B., Button, J. E., Wolfe, B. E., Ling, A. V., Devlin, A. S., Varma, Y., Fischbach, M. A., et al. (2014) · Nature · doi:10.1038/nature12820 · Cited by 10,100
Efficient Methods to Compute Genomic Predictions
VanRaden, P. M. (2008) · Journal of Dairy Science · doi:10.3168/jds.2007-0980 · Cited by 6,050
McDonald, D. T., Price, M. N., Goodrich, J. K., Nawrocki, E. P., DeSantis, T. Z., Probst, A. J., Andersen, G. L., Knight, R. D., & Hugenholtz, P. (2011) · The ISME Journal · doi:10.1038/ismej.2011.139 · Cited by 5,144
Human Genetics Shape the Gut Microbiome
Goodrich, J. K., Waters, J. L., Poole, A. C., Sutter, J. L., Koren, O., Blekhman, R., Beaumont, M., Van Treuren, W., Knight, R., Bell, J. T., et al. (2014) · Cell · doi:10.1016/j.cell.2014.09.053 · Cited by 3,164
Research works printed but not linked: 3
- Olfert ED, Cross BM, McWilliams AA. Guide to the care and use of experimental steers. Ottawa: Canadian Council on Animal Care; 1993.
- Gilmour AR, Gogel BJ, Cullis BR, Welham SJ, Thompson R, Butler D, Cherry M, Collins D, Dutkowski G, Harding SA. ASReml user guide. Release 4.1 structural specification. Hemel Hempstead: VSN International Ltd; 2014.
- Core R. Team: R: a language and environment for statistical computing. Vienna: R Foundation for Statistical Computing; 2014.
Cited by
Sorted by citations
Targeting circular RNAs as a therapeutic approach: current strategies and challenges
He, A. T., Liu, J., Li, F., & Yang, B. B. (2021) · Signal Transduction and Targeted Therapy · doi:10.1038/s41392-021-00569-5 · Cited by 567
Xue, M., Sun, H., Wu, X., Liu, J., & Guan, L. L. (2020) · Microbiome · doi:10.1186/s40168-020-00819-8 · Cited by 526
The rumen microbiome: balancing food security and environmental impacts
Mizrahi, I., Wallace, R. J., & Moraïs, S. (2021) · Nature Reviews Microbiology · doi:10.1038/s41579-021-00543-6 · Cited by 490
Disease-induced changes in plant microbiome assembly and functional adaptation
Gao, M., Xiong, C., Gao, C. D., Tsui, C. K. M., Wang, M., Zhou, X. M., Zhang, A., & Cai, L. (2021) · Microbiome · doi:10.1186/s40168-021-01138-2 · Cited by 514
The Role of the Gut Microbiome in Cattle Production and Health: Driver or Passenger?
O’Hara, E., Neves, A. L. A., Song, Y., & Guan, L. L. (2020) · Annual Review of Animal Biosciences · doi:10.1146/annurev-animal-021419-083952 · Cited by 254
Metadata
- Authors
- Li, F., Li, C., Chen, Y., Liu, J., Zhang, C., Irving, B., Fitzsimmons, C., Plastow, G., & Guan, L. L.
- Affiliations
- University of Alberta (CA)
- Agriculture and Agri-Food Canada (CA)
- Corresponding author
- Guan, Le Luo
- Venue
- Microbiome
- Published
- 2019-06-13
- Volume
- 7
- Issue
- 1
- Pages
- 92-92
- ISSN
- 2049-2618 (ISSN-L)
- PMC
- PMC6567441
- OpenAlex
- W2953135971
- Cited by
- 530
- References
- 71
- Citations by year
- 2026: 44 · 2025: 77 · 2024: 94 · 2023: 65 · 2022: 62 · 2021: 120 · 2020: 58 · 2019: 10
- FWCI
- 93.43
- Type
- journal article
- Language
- en
- Open access
- gold
- doi.org
- Locations
- Microbiome (publishedVersion, cc-by)
- Europe PMC (PubMed Central) (publishedVersion, cc-by)
- PubMed Central (publishedVersion, cc-by)
- PubMed (publishedVersion)
- Federal Open Science Repository of Canada / Le Dépôt fédéral de science ouverte du Canada (submittedVersion, cc-by)
- DOAJ (DOAJ: Directory of Open Access Journals) (submittedVersion, cc-by-sa)
- Funders
- Alberta Livestock and Meat Agency (2013R029R)
- Natural Sciences and Engineering Research Council of Canada (Discovery)
- Alberta Innovates - Technology Futures (Graduate student scholarship)
- Alberta Agriculture and Forestry (2018F095R)
- Topics
- Life Sciences › Agricultural and Biological Sciences › Animal Science and Zoology › Ruminant Nutrition and Digestive Physiology
- Life Sciences › Biochemistry, Genetics and Molecular Biology › Genetics › Genetic and phenotypic traits in livestock
- Life Sciences › Biochemistry, Genetics and Molecular Biology › Molecular Biology › Gut microbiota and health
- Keywords
- rumen microbiota, host genetics, heritability, feed efficiency, beef cattle, single nucleotide polymorphisms, quantitative trait loci, volatile fatty acids, rumen fermentation, genetic selection
- MeSH terms
- Host Microbial Interactions, Animals, Animal Feed, Animal Nutritional Physiological Phenomena, Archaea, Bacteria, Breeding, Cattle, Female, Fermentation, Genotype, Male, Phylogeny, Rumen, Microbiota
About these checks
Registry, retraction, Cites and statistics results are computed, not judged, with one exception: a printed reference that no index lists is read once by a model before it counts as a citation error. Claims are extracted by a model and kept only when their quote appears verbatim in the text; each cited source is then checked, with a model’s help, for whether it says what the claim relies on. Those verdicts can be wrong — read the claim’s quote and the cited source before relying on one.
Statistics and arithmetic are recomputed, not judged.
Confidence bands are shown only for fields calibrated on our annotated test set. None is calibrated yet, so no band is shown.
What counts as a claim ›How we measure confidence ›How we check this ›
Are you an author, or do you see a problem with this page? Request a review
