

The DOI matches its Crossref record; 90 of the 90 references it cites were found in a registry or an index.
eToxPred: a machine learning-based approach to estimate the toxicity of drug candidates
Open accessAbstract
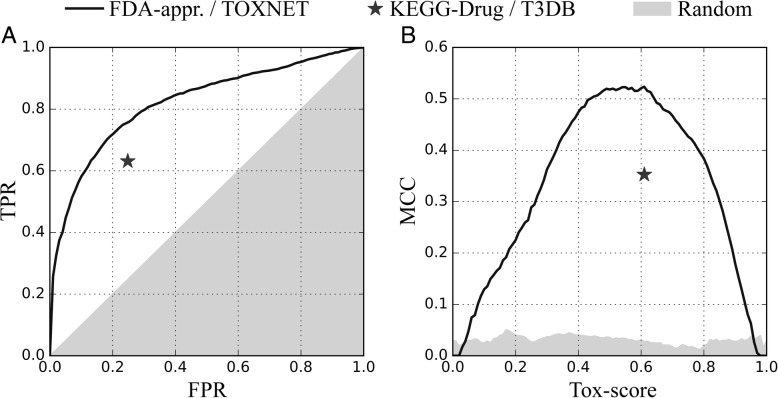
BACKGROUND: The efficiency of drug development defined as a number of successfully launched new pharmaceuticals normalized by financial investments has significantly declined. Nonetheless, recent advances in high-throughput experimental techniques and computational modeling promise reductions in the costs and development times required to bring new drugs to market. The prediction of toxicity of drug candidates is one of the important components of modern drug discovery. RESULTS: In this work, we describe eToxPred, a new approach to reliably estimate the toxicity and synthetic accessibility of small organic compounds. eToxPred employs machine learning algorithms trained on molecular fingerprints to evaluate drug candidates. The performance is assessed against multiple datasets containing known drugs, potentially hazardous chemicals, natural products, and synthetic bioactive compounds. Encouragingly, eToxPred predicts the synthetic accessibility with the mean square error of only 4% and the toxicity with the accuracy of as high as 72%. CONCLUSIONS: eToxPred can be incorporated into protocols to construct custom libraries for virtual screening in order to filter out those drug candidates that are potentially toxic or would be difficult to synthesize. It is freely available as a stand-alone software at https://github.com/pulimeng/etoxpred .
Overview
The claims and statistics of this paper haven’t been checked yet.
Run the check — free, no account needed. It reads the open-access text and checks the sources it cites.
Integrity signals
Registry
Cites
Statistics
Figures
Verification
Claims the paper makes
The claims and statistics of this paper haven’t been checked yet.
Run the check — free, no account needed. It reads the open-access text and checks the sources it cites.
Claims other papers make about this one
Each is checked against this paper’s own text: does it say what the citing paper says it does?
In the citing paper
“AI-based methods have also been able to predict the toxicity of drug candidates [6].”
From The role of AI in drug discovery: challenges, opportunities, and strategies (2023) · cites this paper as [6]
Self-check
Percentages, sums and reported differences re-computed from the paper’s own numbers.
The self-check needs the paper’s full text.
Citations
Cites
Breiman, L. (2001) · Machine Learning · doi:10.1023/a:1010933404324 · Cited by 133,538 · cited 1×
“DeepTox was reported to outperform deep neural networks (DNNs) [31], support vector machines (SVMs) [32], random forests (RF) [33], and elastic nets [34].”
BackgroundTrott, O., & Olson, A. J. (2010) · Journal of Computational Chemistry · doi:10.1002/jcc.21334 · Cited by 38,412 · cited 1×
“VS performed with high-performance computing machines renders docking programs such as AutoDock Vina [19], rDock [20], Glide [21], and FlexX [22] capable to search through millions of compounds in a matter of days or even hours.”
MethodClassification and Regression Trees.
Ryzin, J. V., Breiman, L., Friedman, J. H., Olshen, R. A., & Stone, C. J. (1986) · Journal of the American Statistical Association · doi:10.2307/2288003 · Cited by 21,030
Regularization Paths for Generalized Linear Models via Coordinate Descent
Friedman, J., Hastie, T., & Tibshirani, R. (2010) · Journal of Statistical Software · doi:10.18637/jss.v033.i01 · Cited by 19,927 · cited 1×
“DeepTox was reported to outperform deep neural networks (DNNs) [31], support vector machines (SVMs) [32], random forests (RF) [33], and elastic nets [34].”
BackgroundDeep learning in neural networks: an overview
Schmidhuber, J. (2015) · Neural Networks · doi:10.1016/j.neunet.2014.09.003 · Cited by 18,570
Stochastic relaxation, gibbs distributions, and the bayesian restoration of images.
Geman, S., & Geman, D. (1984) · IEEE Transactions on Pattern Analysis and Machine Intelligence · doi:10.1109/tpami.1984.4767596 · Cited by 17,949 · cited 1×
“The training process involves the optimization of the weight vector through Gibbs sampling [38].”
MethodAn Introduction to Statistical Learning
James, G., Witten, D., Hastie, T., & Tibshirani, R. (2013) · Springer Texts in Statistics · doi:10.1007/978-1-4614-7138-7 · Cited by 12,106 · cited 1×
“In this work, the SAscore predictor is evaluated with a 5-fold cross-validation protocol, which was empirically demonstrated to be sufficient for most applications [64].”
MethodClassification And Regression Trees
Breiman, L., Friedman, J. H., Olshen, R. A., & Stone, C. J. (2017) · doi:10.1201/9781315139470 · Cited by 11,417
Open Babel: An open chemical toolbox
O'Boyle, N. M., Banck, M. S., James, C. A. J., Morley, C., Vandermeersch, T., & Hutchison, G. R. (2011) · Journal of Cheminformatics · doi:10.1186/1758-2946-3-33 · Cited by 10,745 · cited 1×
“Input data to machine learning models are 1024-bit Day-light fingerprints constructed for dataset compounds with Open Babel [61].”
MethodFriesner, R. A., Banks, J. L., Murphy, R. B., Halgren, T. A., Klicic, J. J., Mainz, D. T., Repasky, M. P., Knoll, E. H., Shelley, M., Perry, J. K., et al. (2004) · Journal of Medicinal Chemistry · doi:10.1021/jm0306430 · Cited by 10,057 · cited 1×
“VS performed with high-performance computing machines renders docking programs such as AutoDock Vina [19], rDock [20], Glide [21], and FlexX [22] capable to search through millions of compounds in a matter of days or even hours.”
MethodGeurts, P., Ernst, D., & Wehenkel, L. (2006) · Machine Learning · doi:10.1007/s10994-006-6226-1 · Cited by 9,300 · cited 2×
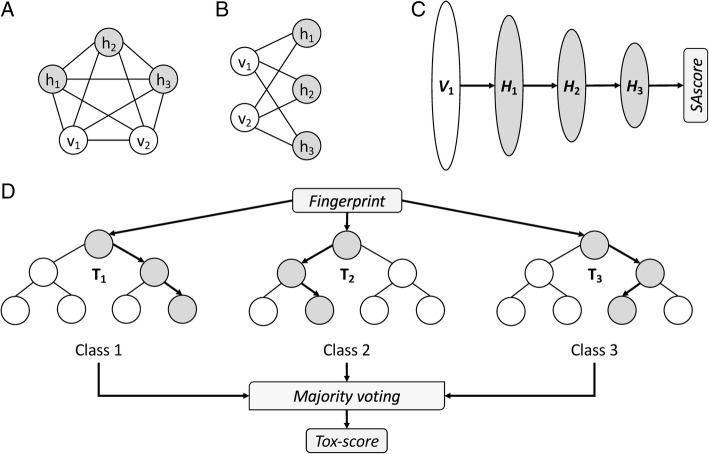
“Finally, the Extremely Randomized Trees, or Extra Trees (ET), algorithm [43] is used to predict the toxicity of drug candidates (Fig.”
MethodFluorine in medicinal chemistry
Purser, S., Moore, P. R., Swallow, S., & Gouverneur, V. (2007) · Chemical Society Reviews · doi:10.1039/b610213c · Cited by 7,678 · cited 1×
“The presence of fluorine atoms in pharmaceuticals increases their bioavailability by modulating p K a and lipophilicity, as well as by improving their absorption and partitioning into membranes [82].”
BackgroundLearning Deep Architectures for AI
Bengio, Y. (2009) · Foundations and Trends® in Machine Learning · doi:10.1561/2200000006 · Cited by 7,330 · cited 1×
“It is noteworthy that DBNs are first effective deep learning algorithms capable of extracting a deep hierarchical representation of the training data [41].”
BackgroundVitaku, E., Smith, D. T., & Njardarson, J. T. (2014) · Journal of Medicinal Chemistry · doi:10.1021/jm501100b · Cited by 6,440 · cited 1×
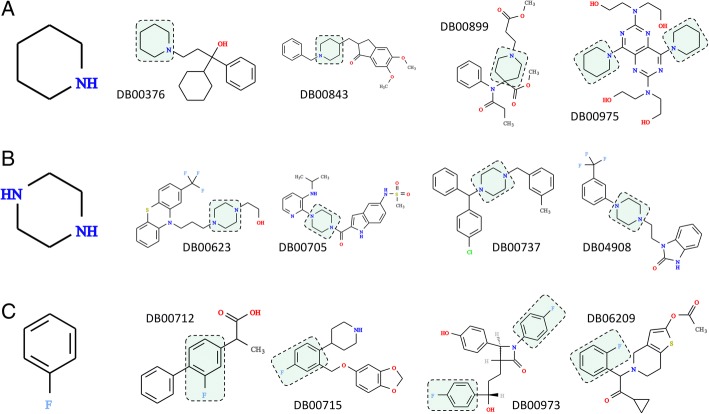
“Similarly, many well established and commercially available drugs contain a piperazine ring as part of their molecular structures [77].”
BackgroundComparison of the predicted and observed secondary structure of T4 phage lysozyme
Matthews, B. W. (1975) · Biochimica et Biophysica Acta (BBA) - Protein Structure · doi:10.1016/0005-2795(75)90109-9 · Cited by 5,399 · cited 1×
“In addition, we assess the overall quality of a binary classifier with the Matthews correlation coefficient (MCC) [65] and the Receiver Operating Characteristic (ROC) analysis.”
MethodLearning Deep Architectures for AI
Bengio, Y. (2009) · now publishers, Inc. eBooks · doi:10.1561/9781601982957 · Cited by 5,050
Wang, J., Sánchez‐Roselló, M., Aceña, J. L., del Pozo, C., Sorochinsky, A. E., Fustero, S., Soloshonok, V. A., & Liu, H. (2013) · Chemical Reviews · doi:10.1021/cr4002879 · Cited by 4,902 · cited 1×
“As a result, an estimated one-third of the top-performing drugs currently on the market contain fluorine atoms in their structure [81].”
BackgroundTraining Products of Experts by Minimizing Contrastive Divergence
Hinton, G. E. (2002) · Neural Computation · doi:10.1162/089976602760128018 · Cited by 4,879 · cited 1×
“This architecture allows for a fast, layer-by-layer training, during which the contrast-ive divergence algorithm [40] is employed to learn a layer of features from the visible units starting from the lowest visible layer.”
MethodDrugBank: a comprehensive resource for in silico drug discovery and exploration
Wishart, D. S. (2006) · Nucleic Acids Research · doi:10.1093/nar/gkj067 · Cited by 3,892 · cited 1×
“FDA-approved drugs were obtained from the DrugBank database, a widely used cheminformatics resource providing comprehensive information on known drugs and their molecular targets [51].”
MethodVII. Note on regression and inheritance in the case of two parents
Pearson, K. (1895) · Proceedings of the Royal Society of London · doi:10.1098/rspl.1895.0041 · Cited by 3,726
How to improve R&D productivity: the pharmaceutical industry's grand challenge
Paul, S. M., Mytelka, D. S., Dunwiddie, C. T., Persinger, C. C., Munos, B. H., Lindborg, S. R., & Schacht, A. L. (2010) · Nature Reviews Drug Discovery · doi:10.1038/nrd3078 · Cited by 3,566 · cited 1×
“To develop a new drug requires 6 – 12 years and costs as much as $2.6 billion [1, 2].”
BackgroundInfluentialA learning algorithm for Boltzmann machines
Ackley, D. H., Hinton, G. E., & Sejnowski, T. J. (1985) · Cognitive Science · doi:10.1207/s15516709cog0901_7 · Cited by 3,402
Innovation in the pharmaceutical industry: New estimates of R&D costs
DiMasi, J. A., Grabowski, H. G., & Hansen, R. W. (2016) · Journal of Health Economics · doi:10.1016/j.jhealeco.2016.01.012 · Cited by 3,359 · cited 2×
“Although, a breakdown of the overall capitalized costs shows that the clinical period costing $1.5 billion is economically the most critical factor, the expenditures of the pre-human phase aggregate to $1.1 billion [1].”
BackgroundInfluentialTaylor, R. D., MacCoss, M., & Lawson, A. D. G. (2014) · Journal of Medicinal Chemistry · doi:10.1021/jm4017625 · Cited by 2,614 · cited 1×
“Nitrogen-bearing heterocycles, piperidine and pi-perazine, are of central importance to medicinal chemistry [71].”
BackgroundDirectory of useful decoys, enhanced (DUD-E): better ligands and decoys for better benchmarking.
Mysinger, M. M., Carchia, M., Irwin, J. J., & Shoichet, B. K. (2012) · Journal of Medicinal Chemistry · doi:10.1021/jm300687e · Cited by 2,412 · cited 1×
“In addition to natural products, we compiled a non-redundant set of mostly synthetic bioactive compounds from the Data-base of Useful Decoys, Extended (DUD-E) database [50] by selecting 17,499 active molecules against 101 pharmacologically relevant targets.”
BackgroundKEGG for representation and analysis of molecular networks involving diseases and drugs
Kanehisa, M., Goto, S., Furumichi, M., Tanabe, M., & Hirakawa, M. (2010) · Nucleic Acids Research · doi:10.1093/nar/gkp896 · Cited by 2,322 · cited 1×
“The KEGG-Drug resource contains drugs approved in Japan, United States, and Europe, annotated with the information on their targets, metabolizing enzymes, and molecular interactions [52].”
BackgroundComputational Methods in Drug Discovery
Sliwoski, G. R., Kothiwale, S., Meiler, J., & Lowe, E. W. (2013) · Pharmacological Reviews · doi:10.1124/pr.112.007336 · Cited by 2,306 · cited 1×
“CADD strategies include ligand-and structure-based drug design, lead optimization, and the comprehensive evaluation of absorption, distribution, metabolism, excretion, and toxicity (ADMET) parameters [4].”
BackgroundMullin, A., & Rosenblatt, F. F. (1963) · American Mathematical Monthly · doi:10.2307/2312103 · Cited by 2,211
The Ames Salmonella/microsome mutagenicity assay
Mortelmans, K. E., & Zeiger, E. (2000) · Mutation research. Fundamental and molecular mechanisms of mutagenesis · doi:10.1016/s0027-5107(00)00064-6 · Cited by 2,103 · cited 1×
“…example is chemTox (http://www.cyprotex.com/ insilico/physiological_modelling/chemtox) predicting key toxicity parameters, the Ames mutagenicity [27] and the median lethal dose (LD 50 ) following intravenous and oral administration, as well as the aqueous solubility. chemTox employs molecular…”
BackgroundErtl, P., & Schuffenhauer, A. (2009) · Journal of Cheminformatics · doi:10.1186/1758-2946-1-8 · Cited by 1,939 · cited 3×
“…SAscore values are computed with an exact approach that combines the fragment-based score representing the “ historical synthetic knowledge ” with the complexity-based score penalizing the presence of ring systems, such as spiro and fused rings, multiple stereo centers, and macrocycles [62].”
BackgroundMethodResultInfluentialPrinciples of Neurodynamics: Perceptrons and the Theory of Brain Mechanisms
White, B. W., & Rosenblatt, F. (1963) · The American Journal of Psychology · doi:10.2307/1419730 · Cited by 1,818 · cited 1×
“In addition, we tested two other classifiers, the Linear Discriminant Analysis (LDA) [67] and Multi-layer Perceptron (MLP) [68], however, their performance is generally not as high as those of RF and ET.”
MethodPRINCIPLES OF NEURODYNAMICS. PERCEPTRONS AND THE THEORY OF BRAIN MECHANISMS
ROSENBLATT, F. (1961) · doi:10.21236/ad0256582 · Cited by 1,691
Information processing in dynamical systems: foundations of harmony theory
Smolensky, P. (1986) · The MIT Press eBooks · Cited by 1,673
hERG potassium channels and cardiac arrhythmia
Sanguinetti, M. C., & Tristani‐Firouzi, M. (2006) · Nature · doi:10.1038/nature04710 · Cited by 1,582 · cited 1×
“For instance, a blockage of the human Ether-à--go-go-Related Gene (hERG) potassium ion channels by a surprisingly diverse group of drugs can induce lethal cardiac arrhythmia [25].”
BackgroundFluorine in Medicinal Chemistry
Böhm, H., Banner, D. W., Bendels, S., Kansy, M., Kuhn, B., Müller, K., Obst-Sander, U., & Ståhl, M. (2004) · ChemBioChem · doi:10.1002/cbic.200301023 · Cited by 1,580 · cited 1×
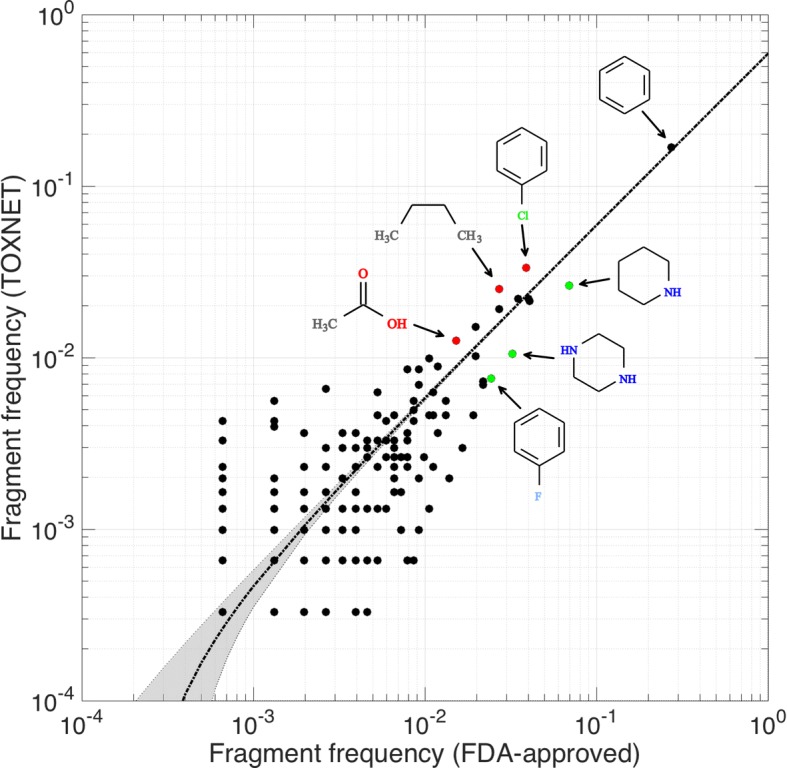
“A low metabolic stability due to cytochrome P450-mediated oxidation can be mitigated by blocking metabolically unstable hydrogen positions with fluorine atoms [84], as exemplified by drug structures shown in Fig.”
BackgroundDiener, H., Cunha, L., Forbes, C. D., Sivenius, J., Smets, P., & Lowenthal, A. (1996) · Journal of the Neurological Sciences · doi:10.1016/s0022-510x(96)00308-5 · Cited by 1,559 · cited 1×
“…donepezil (Drug-Bank-ID: DB00843), a reversible acetyl cholinesterase inhibitor to treat Alzheimer ’ s disease [74], an opioid analgesic drug remifentanil (DrugBank-ID: DB00899) [75], and dipyridamole (DrugBank-ID: DB00975), a phosphodiesterase inhibitor preventing the blood clot formation [76].”
BackgroundForbes, C., & Collaborators, E. (1997) · International Journal of Clinical Practice · doi:10.1111/j.1742-1241.1997.tb11433.x · Cited by 1,411
Role of Molecular Dynamics and Related Methods in Drug Discovery
Vivo, M. D., Masetti, M., Bottegoni, G., & Cavalli, A. (2016) · Journal of Medicinal Chemistry · doi:10.1021/acs.jmedchem.5b01684 · Cited by 1,358 · cited 1×
“Foremost SBDD methods include molecular docking [15], molecular dynamics [16], receptor-based VS [17], and the de novo design of active compounds [18].”
MethodMorris, G. M., & Lim-Wilby, M. S. L. (2008) · Methods in molecular biology · doi:10.1007/978-1-59745-177-2_19 · Cited by 1,264
DeepTox: toxicity prediction using deep learning
Mayr, A., Klambauer, G., Unterthiner, T., & Hochreiter, S. (2016) · Frontiers in Environmental Science · doi:10.3389/fenvs.2015.00080 · Cited by 1,081 · cited 2×
“DeepTox [30] was the best performing methods in the Tox21 Data Challenge winning the grand challenge, the nuclear receptor panel, the stress response panel, and six single assays.”
MethodResultStochastic relaxation, Gibbs distributions and the Bayesian restoration of images*
Geman, S., & Geman, D. (1993) · Journal of Applied Statistics · doi:10.1080/02664769300000058 · Cited by 1,003
The Process of Structure-Based Drug Design
Anderson, A. C. (2003) · Chemistry & Biology · doi:10.1016/j.chembiol.2003.09.002 · Cited by 965 · cited 1×
“Although the combination of pharmacophore modeling, QSAR, and VS techniques has been demonstrated to be valuable in the absence of the protein structure data [12, 13], the three-dimensional (3D) information on the target protein allows employing structure-based drug design (SBDD) [14] in CADD.”
MethodComputer-based de novo design of drug-like molecules
Schneider, G., & Fechner, U. (2005) · Nature Reviews Drug Discovery · doi:10.1038/nrd1799 · Cited by 956 · cited 1×
“Foremost SBDD methods include molecular docking [15], molecular dynamics [16], receptor-based VS [17], and the de novo design of active compounds [18].”
MethodHinton, G. E. (2009) · Scholarpedia · doi:10.4249/scholarpedia.5947 · Cited by 933 · cited 1×
“1C) [39].”
Predictive Inference: An Introduction
Geisser, S. (1993) · Springer eBooks · doi:10.1007/978-1-4899-4467-2 · Cited by 922
Pharmacophore modeling and applications in drug discovery: challenges and recent advances
Yang, S. (2010) · Drug Discovery Today · doi:10.1016/j.drudis.2010.03.013 · Cited by 902 · cited 1×
“VS employing features provided by pharmacophore modeling [6] and quantitative structure-activity relationship (QSAR) analysis [7] can be performed in order to identify potentially active compounds.”
MethodChen, C. Y. (2011) · PLoS ONE · doi:10.1371/journal.pone.0015939 · Cited by 819 · cited 1×
“As an independent set, we employ the Traditional Chinese Medicine (TCM) Database@Taiwan, currently the largest and most comprehensive small molecule database on traditional Chinese medicine for virtual screening [55].”
MethodProTox: a web server for the in silico prediction of rodent oral toxicity
Drwal, M. N., Banerjee, P., Dunkel, M., Wettig, M. R., & Preißner, R. (2014) · Nucleic Acids Research · doi:10.1093/nar/gku401 · Cited by 766 · cited 1×
“A similar method, ProTox, predicts rodent oral toxicity based on the analysis of toxic fragments present in compounds with known LD 50 values [28].”
MethodIn silico toxicology: computational methods for the prediction of chemical toxicity
Raies, A. B., & Bajić, V. B. (2016) · Wiley Interdisciplinary Reviews Computational Molecular Science · doi:10.1002/wcms.1240 · Cited by 756 · cited 1×
“Other techniques to predict toxicity utilize various features such as fingerprints, physicochemical properties, and pharmaco-phore models to build predictive dose-and time-response models [29].”
MethodrDock: A Fast, Versatile and Open Source Program for Docking Ligands to Proteins and Nucleic Acids
Carmona, S. R., Álvarez-García, D., Foloppe, N., Garmendia-Doval, A. B., Juhos, S., Schmidtke, P., Barril, X., Hubbard, R. E., & Morley, S. (2014) · PLoS Computational Biology · doi:10.1371/journal.pcbi.1003571 · Cited by 660 · cited 1×
“VS performed with high-performance computing machines renders docking programs such as AutoDock Vina [19], rDock [20], Glide [21], and FlexX [22] capable to search through millions of compounds in a matter of days or even hours.”
MethodTan, C.-C., Yu, J.-T., Wang, H.-F., Tan, M.-S., Meng, X.-F., Wang, C., Jiang, T., Zhu, X.-C., & Tan, L. (2014) · Journal of Alzheimer s Disease · doi:10.3233/jad-132690 · Cited by 484 · cited 1×
“…to treat Parkinson ’ s disease [73], donepezil (Drug-Bank-ID: DB00843), a reversible acetyl cholinesterase inhibitor to treat Alzheimer ’ s disease [74], an opioid analgesic drug remifentanil (DrugBank-ID: DB00899) [75], and dipyridamole (DrugBank-ID: DB00975), a phosphodiesterase inhibitor…”
BackgroundUse of Natural Products as Chemical Library for Drug Discovery and Network Pharmacology
Gu, J., Gui, Y., Chen, L., Yuan, G., Lu, H., & Xu, X. (2013) · PLoS ONE · doi:10.1371/journal.pone.0062839 · Cited by 419
Acharya, C., Coop, A., Polli, J. E., & MacKerell, A. D. (2010) · Current Computer - Aided Drug Design · doi:10.2174/157340911793743547 · Cited by 343 · cited 1×
“Ligand-based drug design (LBDD) leverages the spatial information and physicochemical features extracted from known bioactives against a given target protein to design and optimize new compounds for the same target [5].”
Backgroundvan Heek, M., France, C. F., Compton, D. S., McLeod, R. L., Yumibe, N. P., Alton, K. B., Sybertz, E. J., & Davis, H. R. (1997) · Journal of Pharmacology and Experimental Therapeutics · doi:10.1016/s0022-3565(24)36992-7 · Cited by 306 · cited 1×
“Another example is cholesterol inhibitor ezetimibe (DrugBank-ID: DB00973), in which two metabolically labile sites are effectively blocked by fluorine substituents [86].”
BackgroundQuantitative structure-activity relationship methods: Perspectives on drug discovery and toxicology
Perkins, R., Fang, H., Tong, W., & Welsh, W. J. (2003) · Environmental Toxicology and Chemistry · doi:10.1897/01-171 · Cited by 284 · cited 1×
“VS employing features provided by pharmacophore modeling [6] and quantitative structure-activity relationship (QSAR) analysis [7] can be performed in order to identify potentially active compounds.”
MethodHistory of the design of captopril and related inhibitors of angiotensin converting enzyme.
Cushman, D. W., & Ondetti, M. A. (1991) · Hypertension · doi:10.1161/01.hyp.17.4.589 · Cited by 270 · cited 1×
“Captopril, an angiotensin-converting enzyme inhibitor, was one of the first success stories of LBDD, which was considered a revo-lutionary concept in 1970s compared to conventional methods [11].”
ResultPred‐hERG: A Novel web‐Accessible Computational Tool for Predicting Cardiac Toxicity
Braga, R. C., Alves, V. M., da Silva, M. F. B., Muratov, E. N., Fourches, D., Lião, L. M., Tropsha, A., & Andrade, C. H. (2015) · Molecular Informatics · doi:10.1002/minf.201500040 · Cited by 261 · cited 1×
“A recently developed method, Pred-hERG, estimates the cardiac toxicity with a set of features based on statistically significant and externally predictive QSAR models of the hERG blockage [26].”
MethodPiperazine scaffold: A remarkable tool in generation of diverse pharmacological agents
Shaquiquzzaman, M., Verma, G., Marella, A., Akhter, M., Akhtar, W., Khan, M. F., Tasneem, S., & Alam, M. M. (2015) · European Journal of Medicinal Chemistry · doi:10.1016/j.ejmech.2015.07.026 · Cited by 259 · cited 1×
“activities exhibited by piperazine derivatives make them attractive leads to develop new antidepressant, anticancer, anthelmintic, antibacterial, antifungal, antimalarial, and anticonvulsant therapeutics [78].”
BackgroundSawyer, J. S., Anderson, B. D., Beight, D. W., Campbell, R. M., Jones, M. L., Herron, D. K., Lampe, J. W., McCowan, J. R., McMillen, W. T., Mort, N. A., et al. (2003) · Journal of Medicinal Chemistry · doi:10.1021/jm0205705 · Cited by 238
Handbook of Carcinogenic Potency and Genotoxicity Databases
Gold, L. S., & Zeiger, E. (1996) · doi:10.1201/9781439810644 · Cited by 218
Comparison of the NCI Open Database with Seven Large Chemical Structural Databases
Voigt, J. H., Bienfait, B., Wang, S., & Nicklaus, M. C. (2001) · Journal of Chemical Information and Computer Sciences · doi:10.1021/ci000150t · Cited by 217 · cited 1×
“Re-moving the redundancy at a Tanimoto coefficient (TC) [48] of 0.8 with the SUBSET [49] program resulted in 1008 NuBBE and 81,372 UNPD molecules.”
MethodInfluentialIn Silico Prediction of Chemical Acute Oral Toxicity Using Multi-Classification Methods
Li, X., Chen, L., Cheng, F., Wu, Z., Bian, H., Xu, C., Li, W., Liu, G., Shen, X., & Tang, Y. (2014) · Journal of Chemical Information and Modeling · doi:10.1021/ci5000467 · Cited by 184 · cited 1×
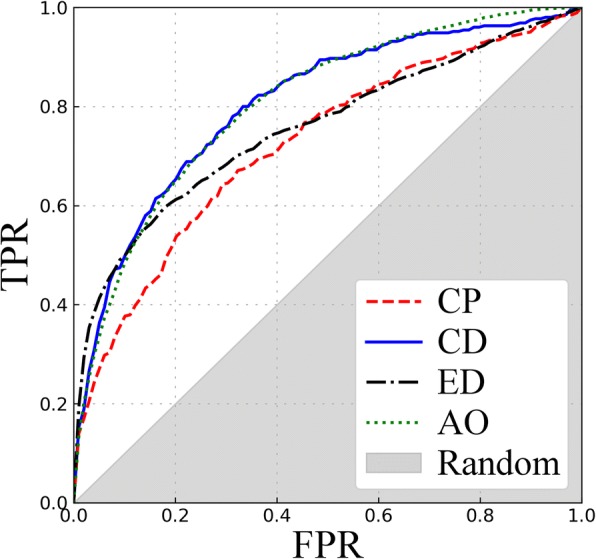
“These results are in line with benchmarking data reported for other classifiers; for instance, e ToxPred compares favorably with different methods particularly against the AO and ED datasets [30, 70].”
ResultWang, S., Li, Y., Wang, J., Chen, L., Zhang, L., Yu, H., & Hou, T. (2012) · Molecular Pharmaceutics · doi:10.1021/mp300023x · Cited by 180 · cited 1×
“The CD set includes 350 toxic compounds with an IC 50 of 1 μ M [58].”
BackgroundDevelopment of a Natural Products Database from the Biodiversity of Brazil
Valli, M., dos Santos, R. N., Figueira, L., Nakajima, C. H., Castro‐Gamboa, I., Andricopulo, A. D., & Bolzani, V. D. S. (2013) · Journal of Natural Products · doi:10.1021/np3006875 · Cited by 178 · cited 1×
“NuBBE is a virtual database of natural products and derivatives from the Brazilian biodiversity [46], whereas UNPD is a general resource of natural products created primarily for virtual screening and network pharmacology [47].”
BackgroundLee, H., Jeung, E., Cho, M., Kim, T., Leung, P. C. K., & Choi, K. (2013) · Journal of Cellular and Molecular Medicine · doi:10.1111/j.1582-4934.2012.01649.x · Cited by 171 · cited 1×
“Endocrine disrupting chemicals interfere with the normal functions of endogenous hormones causing metabolic and reproductive disorders, the dysfunction of neuronal and immune systems, and cancer growth [59].”
BackgroundT3DB: a comprehensively annotated database of common toxins and their targets
Lim, E. L., Pon, A., Djoumbou-Feunang, Y., Knox, C., Shrivastava, S., Guo, A. C., Neveu, V., & Wishart, D. S. (2009) · Nucleic Acids Research · doi:10.1093/nar/gkp934 · Cited by 168 · cited 1×
“T3DB houses detailed toxicity data in terms of chemical properties, molecular and cellular interactions, and medical information, for a number of pollutants, pesticides, drugs, and food toxins [54].”
BackgroundSingh, J., Chuaqui, C. E., Boriack‐Sjodin, P. A., Lee, W., Pontz, T. W., Corbley, M. J., Cheung, H. K., Arduini, R. M., Mead, J. N., Newman, M. N., et al. (2003) · Bioorganic & Medicinal Chemistry Letters · doi:10.1016/j.bmcl.2003.09.028 · Cited by 167
Receptor-based virtual screening protocol for drug discovery
Cerqueira, N. M. F. S. A., Gesto, D., Oliveira, E. F., Santos‐Martins, D., Brás, N. F., Sousa, S. F., Fernandes, P. A., & Ramos, M. J. (2015) · Archives of Biochemistry and Biophysics · doi:10.1016/j.abb.2015.05.011 · Cited by 151 · cited 1×
“Foremost SBDD methods include molecular docking [15], molecular dynamics [16], receptor-based VS [17], and the de novo design of active compounds [18].”
MethodBorsini, F., Evans, K., Jason, K., Rohde, F., Alexander, B., & Pollentier, S. (2002) · CNS Drug Reviews · doi:10.1111/j.1527-3458.2002.tb00219.x · Cited by 125 · cited 1×
“9B, are antipsychotic fluphenazine (DrugBank-ID: DB00623), antiretroviral delavirdine (DrugBank-ID: DB00705), antihistamine meclizine (DrugBank-ID: DB00737), and flibanserin (DrugBank-ID: DB04908) to treat hypoactive sexual desire disorder among pre-menopausal women [79].”
BackgroundComputational polypharmacology: a new paradigm for drug discovery
Chaudhari, R. R., Tan, Z., Huang, B., & Zhang, S. (2017) · Expert Opinion on Drug Discovery · doi:10.1080/17460441.2017.1280024 · Cited by 123 · cited 1×
“Numerous machine learning-based techniques have been developed to reveal complex relations between chemical entities and their biological targets [35].”
BackgroundAssessing the Performance of 3D Pharmacophore Models in Virtual Screening: How Good are They?
Braga, R. C., & Andrade, C. H. (2013) · Current Topics in Medicinal Chemistry · doi:10.2174/1568026611313090010 · Cited by 114 · cited 1×
“Although the combination of pharmacophore modeling, QSAR, and VS techniques has been demonstrated to be valuable in the absence of the protein structure data [12, 13], the three-dimensional (3D) information on the target protein allows employing structure-based drug design (SBDD) [14] in CADD.”
MethodComputational Approaches for Drug Discovery
Hung, C., & Chen, C. (2014) · Drug Development Research · doi:10.1002/ddr.21222 · Cited by 105 · cited 1×
“Computer-aided drug discovery (CADD) holds a significant promise to reduce the costs and speed up the development of lead candidates at the outset of drug discovery [3].”
BackgroundChevillard, F., & Kolb, P. (2015) · Journal of Chemical Information and Modeling · doi:10.1021/acs.jcim.5b00203 · Cited by 101 · cited 1×
“Although the capabilities of the traditional LBDD to discover new classes of leads may be limited, recent advances in generating targeted virtual chemical libraries by combinatorial chemistry methods considerably extend the application of LBDD methods [8 – 10].”
BackgroundFlexX‐Scan: Fast, structure‐based virtual screening
Schellhammer, I., & Rarey, M. (2004) · Proteins Structure Function and Bioinformatics · doi:10.1002/prot.20217 · Cited by 96 · cited 1×
“VS performed with high-performance computing machines renders docking programs such as AutoDock Vina [19], rDock [20], Glide [21], and FlexX [22] capable to search through millions of compounds in a matter of days or even hours.”
MethodPharmacophore-based virtual screening: a review of recent applications
Kim, K., Kim, N. D., & Seong, B. L. (2010) · Expert Opinion on Drug Discovery · doi:10.1517/17460441003592072 · Cited by 93 · cited 1×
“Although the combination of pharmacophore modeling, QSAR, and VS techniques has been demonstrated to be valuable in the absence of the protein structure data [12, 13], the three-dimensional (3D) information on the target protein allows employing structure-based drug design (SBDD) [14] in CADD.”
MethodSuperToxic: a comprehensive database of toxic compounds
Schmidt, U., Struck, S., Grüning, B. A., Hossbach, J., Jaeger, I. S., Parol, R., Lindequist, U., Teuscher, E., & Preißner, R. (2008) · Nucleic Acids Research · doi:10.1093/nar/gkn850 · Cited by 91 · cited 1×
“Among 12,612 molecules with LD 50 data provided by the SuperToxic database [60], 7392 compounds are labeled as toxic with a LD 50 of 500 mg kg − 1 .”
MethodPatel, S. S., & Spencer, C. M. (1996) · Drugs · doi:10.2165/00003495-199652030-00009 · Cited by 89
Liu, T., Naderi, M., Alvin, C., Mukhopadhyay, S., & Bryliński, M. (2017) · Journal of Chemical Information and Modeling · doi:10.1021/acs.jcim.6b00596 · Cited by 87 · cited 2×
“…application, this technique can be incorporated into high-throughput pipelines constructing custom libraries for virtual screening, such as that based on e MolFrag [9] and e Synth [10], to eliminate from CADD those drug candidates that are potentially toxic or would be difficult to synthesize.”
MethodSelf-citationInterpreting linear support vector machine models with heat map molecule coloring
Rosenbaum, L., Hinselmann, G., Jahn, A., & Zell, A. (2011) · Journal of Cheminformatics · doi:10.1186/1758-2946-3-11 · Cited by 57 · cited 1×
“DeepTox was reported to outperform deep neural networks (DNNs) [31], support vector machines (SVMs) [32], random forests (RF) [33], and elastic nets [34].”
BackgroundMechanism of Paroxetine (Paxil) Inhibition of the Serotonin Transporter
Davis, B. A., Nagarajan, A., Forrest, L. R., & Singh, S. K. (2016) · Scientific Reports · doi:10.1038/srep23789 · Cited by 56 · cited 1×
“Further, fluorination helps stabilize the binding of a drug to a protein pocket by creating additional favorable interactions, as it was suggested for the fluorophe-nyl ring of paroxetine (DrugBank-ID: DB00715) [83], a selective serotonin reuptake inhibitor shown in Fig.”
BackgroundHyohdoh, I., Furuichi, N., Aoki, T., Itezono, Y., Shirai, H., Ozawa, S., Watanabe, F., Matsushita, M., Sakaitani, M., Ho, P., et al. (2013) · ACS Medicinal Chemistry Letters · doi:10.1021/ml4002419 · Cited by 40 · cited 1×
“1) fluorine substitution [80].”
A graph-based approach to construct target-focused libraries for virtual screening
Naderi, M., Alvin, C., Ding, Y., Mukhopadhyay, S., & Bryliński, M. (2016) · Journal of Cheminformatics · doi:10.1186/s13321-016-0126-6 · Cited by 40 · cited 2×
“…application, this technique can be incorporated into high-throughput pipelines constructing custom libraries for virtual screening, such as that based on e MolFrag [9] and e Synth [10], to eliminate from CADD those drug candidates that are potentially toxic or would be difficult to synthesize.”
BackgroundMethodSelf-citationTypical toxic components in traditional Chinese medicine
Lv, W., Piao, J., & Jiang, J. (2012) · Expert Opinion on Drug Safety · doi:10.1517/14740338.2012.726610 · Cited by 31
3-O-Methyldopa, L-Dopa, and Trihexyphenidyl in the Treatment of Parkinson’s Disease
Muenter, M. D., Dinapoli, R. P., Sharpless, N. S., & Tyce, G. M. (1973) · Mayo Clinic Proceedings · doi:10.1016/s0025-6196(26)07959-0 · Cited by 30 · cited 1×
“9A, trihexyphenidyl (DrugBank-ID: DB00376), a muscarinic antagonist to treat Parkinson ’ s disease [73], donepezil (Drug-Bank-ID: DB00843), a reversible acetyl cholinesterase inhibitor to treat Alzheimer ’ s disease [74], an opioid analgesic drug remifentanil (DrugBank-ID: DB00899) [75], and…”
BackgroundPrasugrel: A Critical Comparison with Clopidogrel
Reinhart, K. M., White, C. M., & Baker, W. L. (2009) · Pharmacotherapy The Journal of Human Pharmacology and Drug Therapy · doi:10.1592/phco.29.12.1441 · Cited by 28 · cited 1×
“Finally, replacing the chlorine atom with a fluorine improves safety profile and pharmacokinetic properties of prasugrel (DrugBank-ID: DB06209) compared to other thienopyridine antiplatelet drugs, ticlopidine and clopidogrel [87].”
BackgroundFast Molecular Docking Methods
Eyck, L. F. T., Mandell, J. G., Kotlovyi, V., & Tsigelny, I. F. (1998) · Springer eBooks · doi:10.1007/978-1-4899-1540-5_98 · Cited by 26
Targeted Fluorination of a Nonsteroidal Anti‐inflammatory Drug to Prolong Metabolic Half‐Life
Shaughnessy, M. J., Harsányi, A., Li, J., Bright, T. V., Murphy, C. D., & Sandford, G. (2014) · ChemMedChem · doi:10.1002/cmdc.201300490 · Cited by 22 · cited 1×
“Indeed, a targeted fluorination of a nonsteroidal anti-inflammatory drug flurbiprofen (DrugBank-ID: DB00712) helped prolong its metabolic half-life [85].”
BackgroundThe Interactions Between hERG Potassium Channel and Blockers
Du, L., Li, M., & You, Q. (2009) · Current Topics in Medicinal Chemistry · doi:10.2174/156802609788317829 · Cited by 20 · cited 1×
“The cardiotoxicity (CD) dataset contains 1571 molecules characterized with bioassay against human ether-a-go-go related gene (hERG) potassium channel. hERG channel blockade induces lethal arrhythmia causing a life-threatening symptom [57].”
MethodClasses of Piperidine-Based Drugs
Vardanyan, R. (2017) · Elsevier eBooks · doi:10.1016/b978-0-12-805157-3.00010-7 · Cited by 17
TOXNET: the National Library of Medicine's toxicology database.
Wexler, P. (1995) · PubMed · Cited by 11
Research works printed but not linked: 2
- Theano_Development_Team: Theano: A Python framework for fast computation of mathematical expressions. arXiv e-prints 2016:abs/1605.02688.
- Tanimoto TT. An elementary mathematical theory of classification and prediction. In: Book An elementary mathematical theory of classification and prediction. (editor ed.^eds.). City; 1958.
Cited by
Sorted by citations
Artificial intelligence in drug discovery and development
Paul, D., Sanap, G., Shenoy, S., Kalyane, D., Kalia, K., & Tekade, R. K. (2021) · Drug Discovery Today · doi:10.1016/j.drudis.2020.10.010 · Cited by 1,695
Artificial intelligence to deep learning: machine intelligence approach for drug discovery
Gupta, R., Srivastava, D., Sahu, M., Tiwari, S., Ambasta, R. K., & Kumar, P. (2021) · Molecular Diversity · doi:10.1007/s11030-021-10217-3 · Cited by 1,473
“…prediction software and web-based tools such as Tox21 (https:// ntp. niehs. nih. gov/ whatw estudy/ tox21/ index. html) [327], SEA (http:// sea. bkslab. org/) [328], eToxPred (https:// www. bryli nski. org/ etoxp red-0) [329], and TargeTox (https:// github. com/ artem-lysen ko/ Targe Tox) [330].”
The role of AI in drug discovery: challenges, opportunities, and strategies
Blanco-González, A., Cabezón, A., Seco-González, A., Conde-Torres, D., Antelo-Riveiro, P., Piñeiro, Á., & Garcia-Fandino, R. (2023) · Pharmaceuticals · doi:10.3390/ph16060891 · Cited by 690
ToxinPred2: an improved method for predicting toxicity of proteins
Sharma, N., Naorem, L. D., Jain, S., & Raghava, G. P. S. (2022) · Briefings in Bioinformatics · doi:10.1093/bib/bbac174 · Cited by 380
Artificial intelligence and machine learning in drug discovery and development
Patel, V. J., & Shah, M. (2021) · Intelligent Medicine · doi:10.1016/j.imed.2021.10.001 · Cited by 234
Metadata
- Authors
- Pu, L., Naderi, M., Liu, T., Wu, H.-C., Mukhopadhyay, S., & Brylinski, M.
- Affiliations
- Louisiana State University (US)
- Venue
- BMC Pharmacology and Toxicology
- Published
- 2019-01-08
- Volume
- 20
- Issue
- 1
- Pages
- 2-2
- ISSN
- 2050-6511 (ISSN-L)
- PMC
- PMC6325674
- OpenAlex
- W2918544128
- Cited by
- 212
- References
- 90
- Citations by year
- 2026: 21 · 2025: 33 · 2024: 50 · 2023: 44 · 2022: 29 · 2021: 20 · 2020: 10 · 2019: 5
- FWCI
- 10.88
- Type
- journal article
- Language
- en
- Open access
- gold
- doi.org
- Locations
- BMC Pharmacology and Toxicology (publishedVersion, cc-by)
- Europe PMC (PubMed Central) (publishedVersion, cc-by)
- PubMed Central (publishedVersion, cc-by)
- PubMed (publishedVersion)
- Civil War Book Review (submittedVersion)
- DOAJ (DOAJ: Directory of Open Access Journals) (submittedVersion, cc-by-sa)
- Funders
- National Institute of General Medical Sciences (R35GM119524)
- Topics
- Life Sciences › Pharmacology, Toxicology and Pharmaceutics › Drug Discovery › Computational Drug Discovery Methods
- Physical Sciences › Materials Science › Materials Chemistry › Machine Learning in Materials Science
- Health Sciences › Veterinary › Small Animals › Animal testing and alternatives
- Keywords
- toxicity prediction, drug candidates, synthetic accessibility, molecular fingerprints, machine learning, virtual screening, small organic molecules, drug-likeness, chemical toxicity
- MeSH terms
- Machine Learning, Algorithms, Animals, Humans, Drug Discovery, Drug-Related Side Effects and Adverse Reactions
About these checks
Registry, retraction, Cites and statistics results are computed, not judged, with one exception: a printed reference that no index lists is read once by a model before it counts as a citation error. Claims are extracted by a model and kept only when their quote appears verbatim in the text; each cited source is then checked, with a model’s help, for whether it says what the claim relies on. Those verdicts can be wrong — read the claim’s quote and the cited source before relying on one.
Statistics and arithmetic are recomputed, not judged.
Confidence bands are shown only for fields calibrated on our annotated test set. None is calibrated yet, so no band is shown.
What counts as a claim ›How we measure confidence ›How we check this ›
Are you an author, or do you see a problem with this page? Request a review
