Cited by 154

The DOI matches its Crossref record; 1 of the 1 references it cites were found in a registry or an index.

Increased intratumoral mast cells foster immune suppression and gastric cancer progression through TNF‐α‐PD‐L1 pathway

Lv, Yipin, Zhao, Yongliang, Wang, Xianhua, Chen, Na, Mao, Fangyuan, Teng, Yongsheng, Wang, Tingting, Peng, Liusheng, Zhang, Jinyu, Cheng, Ping, Liu, Yugang, Kong, Hui, Chen, Weisan, Hao, Chuanjie, Han, Bin, Ma, Qiang, Zou, Quanming, Chen, Jun, Zhuang, Yuan·2019·Journal for ImmunoTherapy of Cancer

Overview

The claims and statistics of this paper haven’t been checked yet.

Run the check — free, no account needed. It reads the open-access text and checks the sources it cites.

A few free checks a day · papers already verified open instantly · results are public

Integrity signals

Registry

Crossref · 10.1186/s40425-019-0530-3

Cites

1 of 1 references verified0 citation errors · 0 not checkable

Statistics

Figures

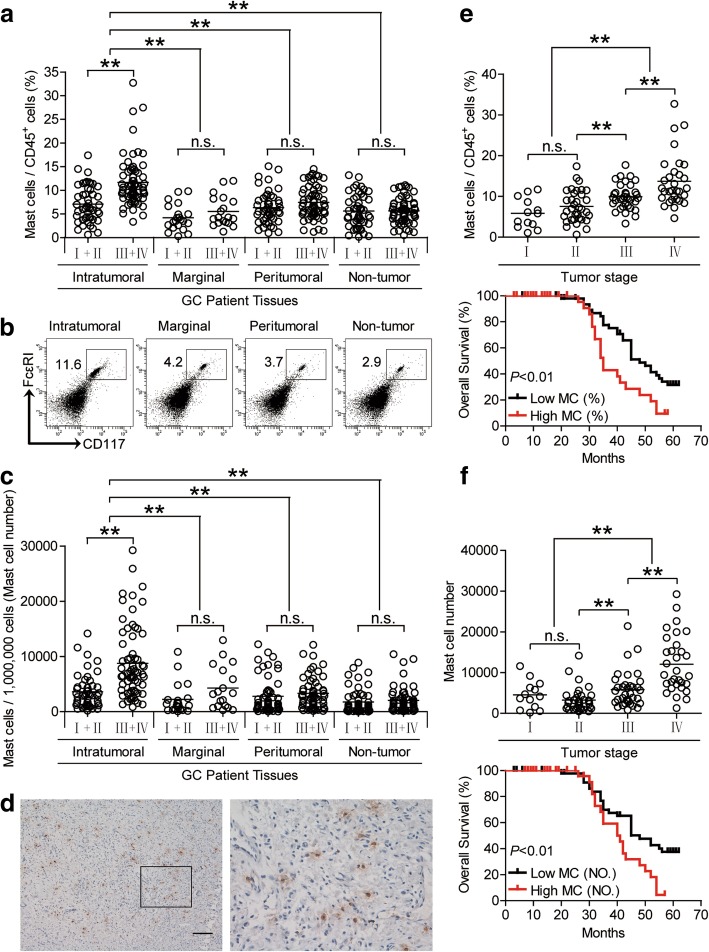
Fig. 1 Mast cells accumulate in GC tumors with disease progression and predict poor patient survival. a Mast cell percentage in CD45+ cells or (c) the total number of mast cells per million total cells among TNM stages (I + II vs III + IV) in each tissue of patients with GC by gating on CD45+CD117+FcεRI+ cells or counting. Cumulative results from 114 GC patients were shown. b Dot plots of surface molecule staining for mast cells gating on CD45+ cells. d Representative analysis of tryptase+ (brown) mast cell distributions in tumor tissues of GC patients by immunohistochemical staining. Scale bars: 100 μm. e and f Intratumoral mast cell percentage (e) or mast cell number (f) among TNM stages was compared. Kaplan-Meier plots for overall survival by median mast cell percentage (9.315%) (e) or median mast cell number (4749 per million) (f). The horizontal bars in panels a, c, e and f represent mean values. Each ring in panels a, c, e and f represents 1 patient. **, P < 0.01; n.s., P > 0.05 for groups connected by horizontal lines. MC (%), mast cell percentage; MC (NO.), mast cell number
Fig. 1 Mast cells accumulate in GC tumors with disease progression and predict poor patient survival. a Mast cell percentage in CD45+ cells or (c) the total number of mast cells per million total cells among TNM stages (I + II vs III + IV) in each tissue of patients with GC by gating on CD45+CD117+FcεRI+ cells or counting. Cumulative results from 114 GC patients were shown. b Dot plots of surface molecule staining for mast cells gating on CD45+ cells. d Representative analysis of tryptase+ (brown) mast cell distributions in tumor tissues of GC patients by immunohistochemical staining. Scale bars: 100 μm. e and f Intratumoral mast cell percentage (e) or mast cell number (f) among TNM stages was compared. Kaplan-Meier plots for overall survival by median mast cell percentage (9.315%) (e) or median mast cell number (4749 per million) (f). The horizontal bars in panels a, c, e and f represent mean values. Each ring in panels a, c, e and f represents 1 patient. **, P < 0.01; n.s., P > 0.05 for groups connected by horizontal lines. MC (%), mast cell percentage; MC (NO.), mast cell numberCC BY · PubMed Central
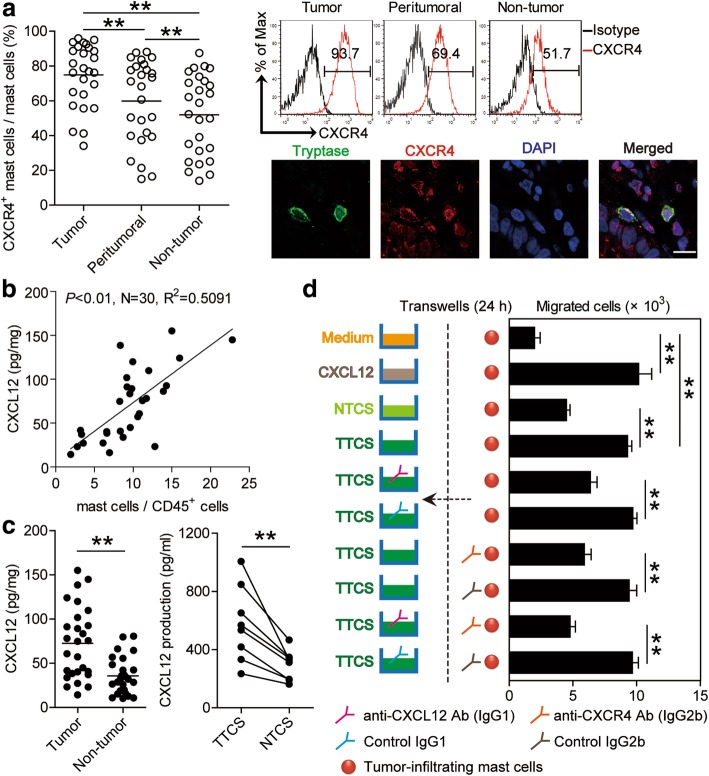
Fig. 2 CXCL12-CXCR4 chemotaxis mediates mast cell migration and accumulation in GC tumors. a Statistics analysis of CXCR4+ mast cell percentage in total mast cells in each samples of patients with GC (n = 26). Expression of molecule CXCR4 on mast cells by gating on CD45+CD117+FcεRI+ cells. Color histograms represent staining of CXCR4; black, isotype control. Tumor-infiltrating CXCR4+tryptase+ mast cells were defined by immunofluorescence staining. Green, Tryptase; red, CXCR4; and blue, DAPI-stained nuclei. Scale bars: 10 μm. b The correlations between mast cells and CXCL12 production in GC tumors were analyzed. Results were expressed as percentage of mast cells in CD45+ cells and CXCL12 concentration in tumor tissues of patients with GC. c CXCL12 concentration between autologous tumor and non-tumor tissues (n = 27) or between autologous TTCS and NTCS (n = 8) was analyzed. d Migration of tumor-infiltrating mast cells was assessed by Transwell assay as described in Materials and methods and statistically analyzed (n = 3). The horizontal bars in panels a and c represent mean values. Each ring or dot in panels a, b or c represents 1 patient. *, P < 0.05; **, P < 0.01 for groups connected by horizontal lines
Fig. 2 CXCL12-CXCR4 chemotaxis mediates mast cell migration and accumulation in GC tumors. a Statistics analysis of CXCR4+ mast cell percentage in total mast cells in each samples of patients with GC (n = 26). Expression of molecule CXCR4 on mast cells by gating on CD45+CD117+FcεRI+ cells. Color histograms represent staining of CXCR4; black, isotype control. Tumor-infiltrating CXCR4+tryptase+ mast cells were defined by immunofluorescence staining. Green, Tryptase; red, CXCR4; and blue, DAPI-stained nuclei. Scale bars: 10 μm. b The correlations between mast cells and CXCL12 production in GC tumors were analyzed. Results were expressed as percentage of mast cells in CD45+ cells and CXCL12 concentration in tumor tissues of patients with GC. c CXCL12 concentration between autologous tumor and non-tumor tissues (n = 27) or between autologous TTCS and NTCS (n = 8) was analyzed. d Migration of tumor-infiltrating mast cells was assessed by Transwell assay as described in Materials and methods and statistically analyzed (n = 3). The horizontal bars in panels a and c represent mean values. Each ring or dot in panels a, b or c represents 1 patient. *, P < 0.05; **, P < 0.01 for groups connected by horizontal linesCC BY · PubMed Central
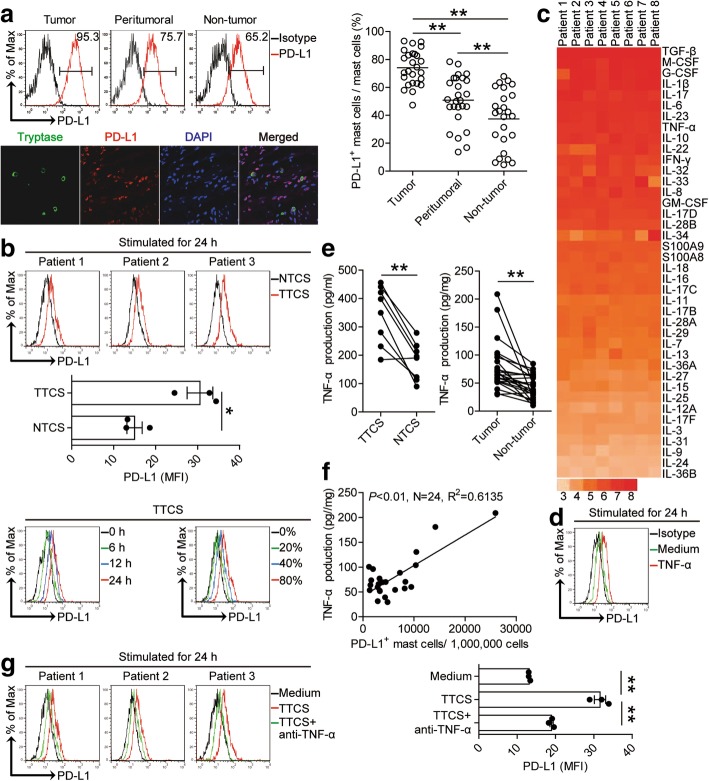
Fig. 3 Tumor-derived factor TNF-α induces mast cells to express PD-L1. a Statistics analysis of PD-L1+ mast cell percentage in total mast cells in each samples of patients with GC (n = 26). Expression of molecule PD-L1 on mast cells by gating on CD45+CD117+FcεRI+ cells. Color histograms represent staining of PD-L1; black, isotype control. Tumor-infiltrating PD-L1+tryptase+ mast cells were defined by immunofluorescence staining. Green, Tryptase; red, PD-L1; and blue, DAPI-stained nuclei. Scale bars: 50 μm. b Expression of PD-L1 on hCBMCs exposed to 50% autologous TTCS and NTCS for 24 h, or exposed to 50% TTCS for 6, 12, 24 h, or exposed to 20, 40, 80% TTCS for 24 h. black, isotype control. c Clustering of microarray data for the expression of 40 pro-inflammatory cytokine genes in human tumor tissues from 8 GC patients. d Expression of PD-L1 on hCBMCs exposed to TNF-α for 24 h. black, isotype control. e TNF-α concentration between autologous tumor and non-tumor tissues (n = 24) or between autologous TTCS and NTCS (n = 8) was analyzed. f The correlations between TNF-α and PD-L1+ mast cells in human tumors were analyzed. Results are expressed as the number of PD-L1+ mast cells per million total cells and TNF-α concentration in tumor tissues. g Expression of PD-L1 on hCBMCs exposed to TTCS with anti-TNF-α antibody for 24 h. Each ring or dot in panels a and f represents 1 patient. *, P < 0.05, **, P < 0.01 for groups connected by horizontal lines
Fig. 3 Tumor-derived factor TNF-α induces mast cells to express PD-L1. a Statistics analysis of PD-L1+ mast cell percentage in total mast cells in each samples of patients with GC (n = 26). Expression of molecule PD-L1 on mast cells by gating on CD45+CD117+FcεRI+ cells. Color histograms represent staining of PD-L1; black, isotype control. Tumor-infiltrating PD-L1+tryptase+ mast cells were defined by immunofluorescence staining. Green, Tryptase; red, PD-L1; and blue, DAPI-stained nuclei. Scale bars: 50 μm. b Expression of PD-L1 on hCBMCs exposed to 50% autologous TTCS and NTCS for 24 h, or exposed to 50% TTCS for 6, 12, 24 h, or exposed to 20, 40, 80% TTCS for 24 h. black, isotype control. c Clustering of microarray data for the expression of 40 pro-inflammatory cytokine genes in human tumor tissues from 8 GC patients. d Expression of PD-L1 on hCBMCs exposed to TNF-α for 24 h. black, isotype control. e TNF-α concentration between autologous tumor and non-tumor tissues (n = 24) or between autologous TTCS and NTCS (n = 8) was analyzed. f The correlations between TNF-α and PD-L1+ mast cells in human tumors were analyzed. Results are expressed as the number of PD-L1+ mast cells per million total cells and TNF-α concentration in tumor tissues. g Expression of PD-L1 on hCBMCs exposed to TTCS with anti-TNF-α antibody for 24 h. Each ring or dot in panels a and f represents 1 patient. *, P < 0.05, **, P < 0.01 for groups connected by horizontal linesCC BY · PubMed Central
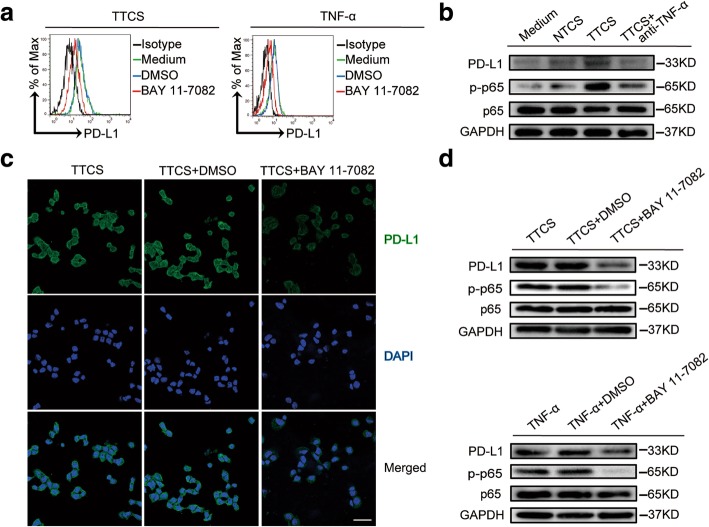
Fig. 4 Tumor-derived TNF-α activates NF-κB pathway to induce PD-L1 expression on mast cells. a Expression of PD-L1 on hCBMCs exposed to TTCS or TNF-α with or without BAY 11–7082 (an IκBα inhibitor) for 24 h. black, isotype control. b PD-L1, p65 and p-p65 on/in LAD2 cells exposed to autologous TTCS, NTCS, or TTCS with anti-TNF-α antibody for 24 h (detecting for PD-L1) or 3 h (detecting for p65 and p-p65) were analyzed by western blot. c PD-L1 on HMC-1 cells exposed to TTCS with or without BAY 11–7082 (an IκBα inhibitor) for 24 h was analyzed by immunofluorescence staining. Green, PD-L1; blue, DAPI-stained nuclei. Scale bars: 20 μm. d PD-L1, p65 and p-p65 on/in LAD2 cells exposed to TTCS with or without BAY 11–7082 (an IκBα inhibitor) were analyzed by western blot
Fig. 4 Tumor-derived TNF-α activates NF-κB pathway to induce PD-L1 expression on mast cells. a Expression of PD-L1 on hCBMCs exposed to TTCS or TNF-α with or without BAY 11–7082 (an IκBα inhibitor) for 24 h. black, isotype control. b PD-L1, p65 and p-p65 on/in LAD2 cells exposed to autologous TTCS, NTCS, or TTCS with anti-TNF-α antibody for 24 h (detecting for PD-L1) or 3 h (detecting for p65 and p-p65) were analyzed by western blot. c PD-L1 on HMC-1 cells exposed to TTCS with or without BAY 11–7082 (an IκBα inhibitor) for 24 h was analyzed by immunofluorescence staining. Green, PD-L1; blue, DAPI-stained nuclei. Scale bars: 20 μm. d PD-L1, p65 and p-p65 on/in LAD2 cells exposed to TTCS with or without BAY 11–7082 (an IκBα inhibitor) were analyzed by western blotCC BY · PubMed Central
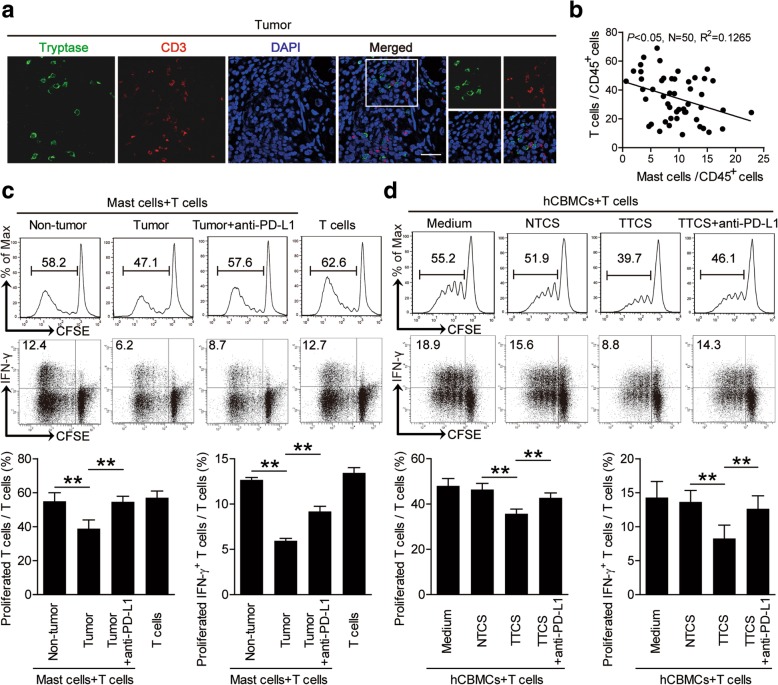
Fig. 5 Tumor-infiltrating and tumor-conditioned mast cells suppress T cell immunity through PD-L1. a Representative analysis of tryptase+ mast cell (green) and CD3+ T cell (red) interactions in tumor tissues of GC patients by immunofluorescence. Scale bars: 20 μm. b The correlations between mast cells and T cells in human GC tumors were analyzed. Results were expressed as percentage of mast cells and T cells in CD45+ cells in tumor tissues of GC patients. c CFSE (carboxyfluorescein succinimidyl amino ester)-labeled peripheral CD3+ T cells of patients with GC were co-cultured for 5 days with autologous mast cells from non-tumor or tumor tissues with or without anti-PD-L1 antibody. Representative data and statistical analysis of T cell proliferation and IFN-γ production were shown (n = 5). d CFSE-labeled peripheral CD3+ T cells of donors were co-cultured for 5 days with autologous TTCS-, or NTCS-conditioned hCBMCs with or without anti-PD-L1 antibody. Representative data and statistical analysis of T cell proliferation and IFN-γ production were shown (n = 5). Each dot in panel b represents 1 patient. **, P < 0.01 for groups connected by horizontal lines. hCBMCs, human umbilical cord blood-derived cultured mast cells
Fig. 5 Tumor-infiltrating and tumor-conditioned mast cells suppress T cell immunity through PD-L1. a Representative analysis of tryptase+ mast cell (green) and CD3+ T cell (red) interactions in tumor tissues of GC patients by immunofluorescence. Scale bars: 20 μm. b The correlations between mast cells and T cells in human GC tumors were analyzed. Results were expressed as percentage of mast cells and T cells in CD45+ cells in tumor tissues of GC patients. c CFSE (carboxyfluorescein succinimidyl amino ester)-labeled peripheral CD3+ T cells of patients with GC were co-cultured for 5 days with autologous mast cells from non-tumor or tumor tissues with or without anti-PD-L1 antibody. Representative data and statistical analysis of T cell proliferation and IFN-γ production were shown (n = 5). d CFSE-labeled peripheral CD3+ T cells of donors were co-cultured for 5 days with autologous TTCS-, or NTCS-conditioned hCBMCs with or without anti-PD-L1 antibody. Representative data and statistical analysis of T cell proliferation and IFN-γ production were shown (n = 5). Each dot in panel b represents 1 patient. **, P < 0.01 for groups connected by horizontal lines. hCBMCs, human umbilical cord blood-derived cultured mast cellsCC BY · PubMed Central
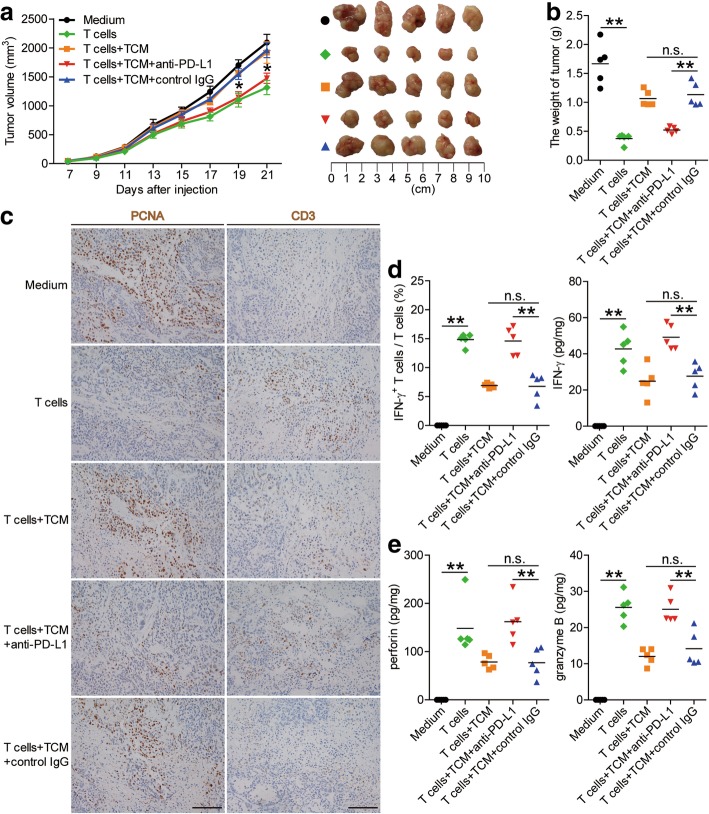
Fig. 6 Blockade of mast cell-associated PD-L1 on T cell immunity inhibits tumor growth and GC progression in vivo. a Mice were injected with human SGC-7901 cells, as described in Materials and methods. The control animals () received no further injections. The experimental treatments entailed injections with T cells () or T cells in combination with TTCS-conditioned mast cells (TCM) (), or T cells in combination with TCM pre-treated with an anti-PD-L1 antibody () or a control IgG (). The illustrated data represent tumor volumes (5 mice in each group). The day of tumor cell injection was counted as day 0. *P < 0.05, for groups injections with T cells in combination with TCM pre-treated with an anti-PD-L1 antibody (), compared with groups injections with T cells in combination with TCM pre-treated with a control IgG (). The tumors were excised and photographed 21 day after injecting the tumor cells. b The weights of tumors were compared. c-e Proliferating cell nuclear antigen (PCNA) (brown) expression, CD3+ T cell infiltration (brown) (c), or IFN-γ (d), perforin and granzyme B (e) production in tumors and IFN-γ-producing T cell response (d) in spleens of mice were compared (n = 5). Scale bars: 100 μm. The horizontal bars represent mean values. **, P < 0.01; n.s., P > 0.05 for groups connected by horizontal lines
Fig. 6 Blockade of mast cell-associated PD-L1 on T cell immunity inhibits tumor growth and GC progression in vivo. a Mice were injected with human SGC-7901 cells, as described in Materials and methods. The control animals () received no further injections. The experimental treatments entailed injections with T cells () or T cells in combination with TTCS-conditioned mast cells (TCM) (), or T cells in combination with TCM pre-treated with an anti-PD-L1 antibody () or a control IgG (). The illustrated data represent tumor volumes (5 mice in each group). The day of tumor cell injection was counted as day 0. *P < 0.05, for groups injections with T cells in combination with TCM pre-treated with an anti-PD-L1 antibody (), compared with groups injections with T cells in combination with TCM pre-treated with a control IgG (). The tumors were excised and photographed 21 day after injecting the tumor cells. b The weights of tumors were compared. c-e Proliferating cell nuclear antigen (PCNA) (brown) expression, CD3+ T cell infiltration (brown) (c), or IFN-γ (d), perforin and granzyme B (e) production in tumors and IFN-γ-producing T cell response (d) in spleens of mice were compared (n = 5). Scale bars: 100 μm. The horizontal bars represent mean values. **, P < 0.01; n.s., P > 0.05 for groups connected by horizontal linesCC BY · PubMed Central
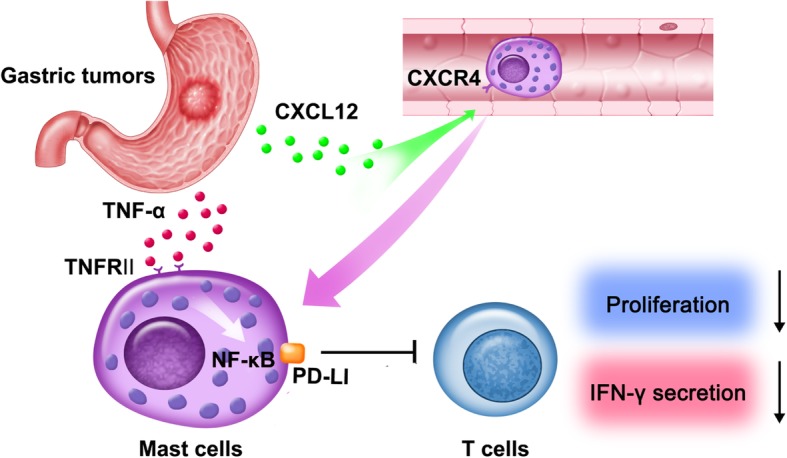
Fig. 7 A proposed model of cross-talks among mast cells, T cells, and tumor cells leading to mast cell-mediated immunosuppressive and protumorigenic effects in the GC microenvironment. CXCL12-CXCR4 chemotaxis mediates the recruitment and accumulation of mast cells into the GC microenvironment, which could be up-regulated PD-L1 expression via NF-κB signaling pathway activation by tumor-derived TNF-α. Mast cells inhibit T-cell proliferation and function in a PD-L1-dependent manner in GC, which promotes GC progression
Fig. 7 A proposed model of cross-talks among mast cells, T cells, and tumor cells leading to mast cell-mediated immunosuppressive and protumorigenic effects in the GC microenvironment. CXCL12-CXCR4 chemotaxis mediates the recruitment and accumulation of mast cells into the GC microenvironment, which could be up-regulated PD-L1 expression via NF-κB signaling pathway activation by tumor-derived TNF-α. Mast cells inhibit T-cell proliferation and function in a PD-L1-dependent manner in GC, which promotes GC progressionCC BY · PubMed Central

Verification

Claims the paper makes

The claims and statistics of this paper haven’t been checked yet.

Run the check — free, no account needed. It reads the open-access text and checks the sources it cites.

A few free checks a day · papers already verified open instantly · results are public

Claims other papers make about this one

Each is checked against this paper’s own text: does it say what the citing paper says it does?

Self-check

Percentages, sums and reported differences re-computed from the paper’s own numbers.

The self-check needs the paper’s full text.

Citations

Cites

Show all 1 references

Research works printed but not linked: 49

  1. Van Cutsem E, Sagaert X, Topal B, Haustermans K, Prenen H. Gastric cancer. Lancet. 2016;388:2654–64. · DOI
  2. Ndegwa N, Ploner A, Liu Z, Roosaar A, Axell T, Ye W. Association between poor oral health and gastric cancer: a prospective cohort study. Int J Cancer. 2018;143:2281-8. · DOI
  3. Wang F, Meng W, Wang B, Qiao L. Helicobacter pylori-induced gastric inflammation and gastric cancer. Cancer Lett. 2014;345:196–202. · DOI
  4. Choi IJ, Kook MC, Kim YI, Cho SJ, Lee JY, Kim CG, et al. Helicobacter pylori therapy for the prevention of Metachronous gastric Cancer. N Engl J Med. 2018;378:1085–95. · DOI
  5. Wen T, Wang Z, Li Y, Li Z, Che X, Fan Y, et al. A four-factor Immunoscore system that predicts clinical outcome for stage II/III gastric Cancer. Cancer Immunol Res. 2017;5:524–34. · DOI
  6. Ferrone C, Dranoff G. Dual roles for immunity in gastrointestinal cancers. J Clin Oncol. 2010;28:4045–51. · DOI
  7. Ying L, Yan F, Meng Q, Yu L, Yuan X, Gantier MP, et al. PD-L1 expression is a prognostic factor in subgroups of gastric cancer patients stratified according to their levels of CD8 and FOXP3 immune markers. Oncoimmunology. 2018;7:e1433520. · DOI
  8. Lee HE, Chae SW, Lee YJ, Kim MA, Lee HS, Lee BL, et al. Prognostic implications of type and density of tumour-infiltrating lymphocytes in gastric cancer. Br J Cancer. 2008;99:1704–11. · DOI
  9. Kalesnikoff J, Galli SJ. New developments in mast cell biology. Nat Immunol. 2008;9:1215–23. · DOI
  10. Maciel TT, Moura IC, Hermine O. The role of mast cells in cancers, F1000Prime Rep. 2015;7:9. · DOI
  11. Sammarco G, Gadaleta CD, Zuccala V, Albayrak E, Patruno R, Milella P, et al. Tumor-associated macrophages and mast cells positive to Tryptase are correlated with angiogenesis in surgically-treated gastric Cancer patients. Int J Mol Sci. 2018;19:1176-89. · DOI
  12. Liu J, Zhang Y, Zhao J, Yang Z, Li D, Katirai F, et al. Mast cell: insight into remodeling a tumor microenvironment. Cancer Metastasis Rev. 2011;30:177–84. · DOI
  13. Danelli L, Frossi B, Gri G, Mion F, Guarnotta C, Bongiovanni L, et al. Mast cells boost myeloid-derived suppressor cell activity and contribute to the development of tumor-favoring microenvironment. Cancer Immunol Res. 2015;3:85–95. · DOI
  14. Lin C, Liu H, Zhang H, Cao Y, Li R, Wu S, et al. Tryptase expression as a prognostic marker in patients with resected gastric cancer. Br J Surg. 2017;104:1037–44. · DOI
  15. Guidolin D, Ruggieri S, Annese T, Tortorella C, Marzullo A, Ribatti D. Spatial distribution of mast cells around vessels and glands in human gastric carcinoma. Clin Exp Med. 2017;17:531–9. · DOI
  16. Mushtaq MU, Papadas A, Pagenkopf A, Flietner E, Morrow Z, Chaudhary SG, et al. Tumor matrix remodeling and novel immunotherapies: the promise of matrix-derived immune biomarkers. J Immunother Cancer. 2018;6:65. · DOI
  17. Schreiber RD, Old LJ, Smyth MJ. Cancer immunoediting: integrating immunity's roles in cancer suppression and promotion. Science. 2011;331:1565–70. · DOI · Paper page
  18. Stromnes IM, Hulbert A, Pierce RH, Greenberg PD, Hingorani SR. T-cell localization, activation, and clonal expansion in human pancreatic ductal adenocarcinoma. Cancer Immunol Res. 2017;5:978–91. · DOI
  19. Ammendola M, Sacco R, Donato G, Zuccala V, Russo E, Luposella M, et al. Mast cell positivity to tryptase correlates with metastatic lymph nodes in gastrointestinal cancer patients treated surgically. Oncology-Basel. 2013;85:111–6. · DOI
  20. Gaudenzio N, Espagnolle N, Mars LT, Liblau R, Valitutti S, Espinosa E. Cell-cell cooperation at the T helper cell/mast cell immunological synapse. Blood. 2009;114:4979–88. · DOI
  21. Kambayashi T, Allenspach EJ, Chang JT, Zou T, Shoag JE, Reiner SL, et al. Inducible MHC class II expression by mast cells supports effector and regulatory T cell activation. J Immunol. 2009;182:4686–95. · DOI
  22. Stelekati E, Bahri R, D'Orlando O, Orinska Z, Mittrucker HW, Langenhaun R, et al. Mast cell-mediated antigen presentation regulates CD8+ T cell effector functions. Immunity. 2009;31:665–76. · DOI
  23. Wang TT, Zhao YL, Peng LS, Chen N, Chen W, Lv YP, et al. Tumour-activated neutrophils in gastric cancer foster immune suppression and disease progression through GM-CSF-PD-L1 pathway. Gut. 2017;66:1900–11. · DOI
  24. Giannou AD, Marazioti A, Spella M, Kanellakis NI, Apostolopoulou H, Psallidas I, et al. Mast cells mediate malignant pleural effusion formation. J Clin Invest. 2015;125:2317–34. · DOI
  25. Huang B, Lei Z, Zhang GM, Li D, Song C, Li B, et al. SCF-mediated mast cell infiltration and activation exacerbate the inflammation and immunosuppression in tumor microenvironment. Blood. 2008;112:1269–79. · DOI
  26. Varricchi G, Galdiero MR, Loffredo S, Marone G, Iannone R, Marone G, et al. Are mast cells MASTers in Cancer? Front Immunol. 2017;8:424.
  27. Xiang Z, Zhou ZJ, Xia GK, Zhang XH, Wei ZW, Zhu JT, et al. A positive crosstalk between CXCR4 and CXCR2 promotes gastric cancer metastasis. Oncogene. 2017;36:5122–33. · DOI
  28. Yang J, Kumar A, Vilgelm AE, Chen SC, Ayers GD, Novitskiy SV, et al. Loss of CXCR4 in myeloid cells enhances antitumor immunity and reduces melanoma growth through NK cell and FASL mechanisms. Cancer Immunol Res. 2018;6:1186–98. · DOI
  29. Zhuang Y, Peng LS, Zhao YL, Shi Y, Mao XH, Chen W, et al. CD8(+) T cells that produce interleukin-17 regulate myeloid-derived suppressor cells and are associated with survival time of patients with gastric cancer. Gastroenterology. 2012;143:951–62. · DOI
  30. Cheng Y, Song Y, Qu J, Che X, Song N, Fan Y, et al. The chemokine receptor CXCR4 and c-MET cooperatively promote epithelial-mesenchymal transition in gastric Cancer cells. Transl Oncol. 2018;11:487–97. · DOI
  31. Seubert B, Grunwald B, Kobuch J, Cui H, Schelter F, Schaten S, et al. Tissue inhibitor of metalloproteinases (TIMP)-1 creates a premetastatic niche in the liver through SDF-1/CXCR4-dependent neutrophil recruitment in mice. Hepatology. 2015;61:238–48. · DOI
  32. Kuang DM, Zhao Q, Peng C, Xu J, Zhang JP, Wu C, et al. Activated monocytes in peritumoral stroma of hepatocellular carcinoma foster immune privilege and disease progression through PD-L1. J Exp Med. 2009;206:1327–37. · DOI
  33. Siska PJ, Johnpulle R, Zhou A, Bordeaux J, Kim JY, Dabbas B, et al. Deep exploration of the immune infiltrate and outcome prediction in testicular cancer by quantitative multiplexed immunohistochemistry and gene expression profiling. Oncoimmunology. 2017;6:e1305535. · DOI · Paper page
  34. Lv YP, Peng LS, Wang QH, Chen N, Teng YS, Wang TT, et al. Degranulation of mast cells induced by gastric cancer-derived adrenomedullin prompts gastric cancer progression. Cell Death Dis. 2018;9:1034. · DOI
  35. Marichal T, Tsai M, Galli SJ. Mast cells: potential positive and negative roles in tumor biology. Cancer Immunol Res. 2013;1:269–79. · DOI
  36. Johnson C, Huynh V, Hargrove L, Kennedy L, Graf-Eaton A, Owens J, et al. Inhibition of mast cell-derived histamine decreases human cholangiocarcinoma growth and differentiation via c-kit/stem cell factor-dependent signaling. Am J Pathol. 2016;186:123–33. · DOI
  37. Melillo RM, Guarino V, Avilla E, Galdiero MR, Liotti F, Prevete N, et al. Mast cells have a protumorigenic role in human thyroid cancer. Oncogene. 2010;29:6203–15. · DOI
  38. Ma Y, Hwang RF, Logsdon CD, Ullrich SE. Dynamic mast cell-stromal cell interactions promote growth of pancreatic cancer. Cancer Res. 2013;73:3927–37. · DOI · Paper page
  39. Kim K, Skora AD, Li Z, Liu Q, Tam AJ, Blosser RL, et al. Eradication of metastatic mouse cancers resistant to immune checkpoint blockade by suppression of myeloid-derived cells. Proc Natl Acad Sci U S A. 2014;111:11774–9. · DOI · Paper page
  40. Marvel D, Gabrilovich DI. Myeloid-derived suppressor cells in the tumor microenvironment: expect the unexpected. J Clin Invest. 2015;125:3356–64. · DOI
  41. Kamran N, Kadiyala P, Saxena M, Candolfi M, Li Y, Moreno-Ayala MA, et al. Immunosuppressive myeloid Cells' blockade in the glioma microenvironment enhances the efficacy of immune-stimulatory gene therapy. Mol Ther. 2017;25:232–48. · DOI
  42. Kusmartsev S, Nagaraj S, Gabrilovich DI. Tumor-associated CD8+ T cell tolerance induced by bone marrow-derived immature myeloid cells. J Immunol. 2005;175:4583–92. · DOI
  43. Tsukamoto H, Fujieda K, Miyashita A, Fukushima S, Ikeda T, Kubo Y, et al. Combined blockade of IL-6 and PD-1/PD-L1 signaling abrogates mutual regulation of their immunosuppressive effects in the tumor microenvironment. Cancer Res. 2018;78(17):5011-22. · DOI · Paper page
  44. Xie QK, Zhao YJ, Pan T, Lyu N, Mu LW, Li SL, et al. Programmed death ligand 1 as an indicator of pre-existing adaptive immune responses in human hepatocellular carcinoma. Oncoimmunology. 2016;5:e1181252. · DOI
  45. Noman MZ, Chouaib S. Targeting hypoxia at the forefront of anticancer immune responses. Oncoimmunology. 2014;3:e954463. · DOI · Paper page
  46. Cristescu R, Mogg R, Ayers M, Albright A, Murphy E, Yearley J, et al. Pan-tumor genomic biomarkers for PD-1 checkpoint blockade-based immunotherapy. Science. 2018;362:eaar3593. · DOI · Paper page
  47. Goodman AM, Kato S, Bazhenova L, Patel SP, Frampton GM, Miller V, et al. Tumor mutational burden as an independent predictor of response to immunotherapy in diverse cancers. Mol Cancer Ther. 2017;16:2598–608. · DOI · Paper page
  48. Singh AK, Stock P, Akbari O. Role of PD-L1 and PD-L2 in allergic diseases and asthma. Allergy. 2011;66:155–62. · DOI
  49. Bertolini M, Zilio F, Rossi A, Kleditzsch P, Emelianov VE, Gilhar A, et al. Abnormal interactions between perifollicular mast cells and CD8+ T-cells may contribute to the pathogenesis of alopecia areata. PLoS One. 2014;9:e94260. · DOI

Cited by

Sorted by citations

See all 154

Metadata

Authors
Lv, Y., Zhao, Y., Wang, X., Chen, N., Mao, F., Teng, Y., Wang, T., Peng, L., Zhang, J., Cheng, P., Liu, Y., Kong, H., Chen, W., Hao, C., Han, B., Ma, Q., Zou, Q., Chen, J., & Zhuang, Y.
Venue
Journal for ImmunoTherapy of Cancer
Publisher
BMJ
Published
2019-02-26
Volume
7
Issue
1
ISSN
2051-1426
Cited by
154
References
1
Language
en
Funders
  • the National Key Research and Development Program of China (2016YFC1302200)
  • National Natural Science Foundation of China (81670510, 81872016)
  • Southwest Hospital (SWH2017YBXM-07)

About these checks

Registry, retraction, Cites and statistics results are computed, not judged, with one exception: a printed reference that no index lists is read once by a model before it counts as a citation error. Claims are extracted by a model and kept only when their quote appears verbatim in the text; each cited source is then checked, with a model’s help, for whether it says what the claim relies on. Those verdicts can be wrong — read the claim’s quote and the cited source before relying on one.

Statistics and arithmetic are recomputed, not judged.

Confidence bands are shown only for fields calibrated on our annotated test set. None is calibrated yet, so no band is shown.

What counts as a claim ›How we measure confidence ›How we check this ›

Are you an author, or do you see a problem with this page? Request a review

How to cite

Cite CoChat for the checks on this page, and the paper for its own findings.

This page
CoChat. (2026). Citation check: Increased intratumoral mast cells foster immune suppression and gastric cancer progression through TNF‐α‐PD‐L1 pathway. https://app.cochat.ai/papers/10.1186/s40425-019-0530-3
The paper
Lv, Y., Zhao, Y., Wang, X., Chen, N., Mao, F., Teng, Y., Wang, T., Peng, L., Zhang, J., Cheng, P., Liu, Y., Kong, H., Chen, W., Hao, C., Han, B., Ma, Q., Zou, Q., Chen, J., & Zhuang, Y. (2019). Increased intratumoral mast cells foster immune suppression and gastric cancer progression through TNF‐α‐PD‐L1 pathway. Journal for ImmunoTherapy of Cancer. https://doi.org/10.1186/s40425-019-0530-3