

The DOI matches its Crossref record; 65 of the 66 references it cites were found in a registry or an index.
Decreased mTOR signaling pathway in human idiopathic autism and in rats exposed to valproic acid
Open accessAbstract
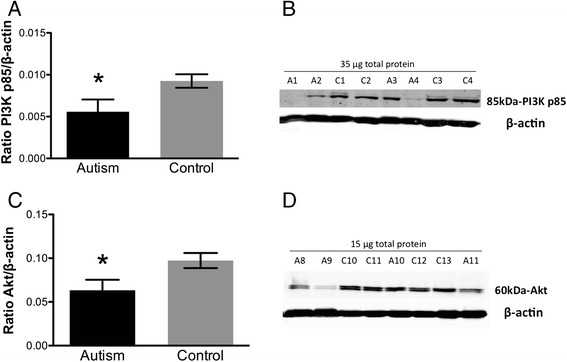
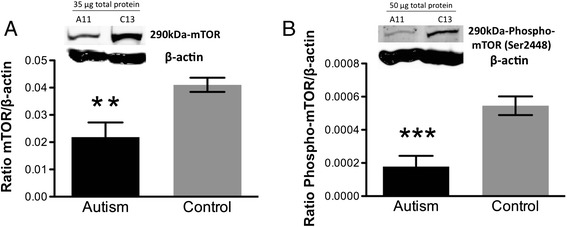
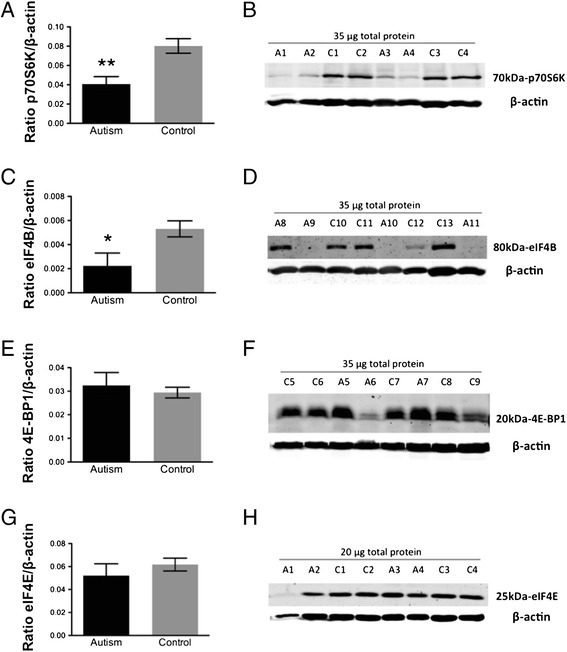
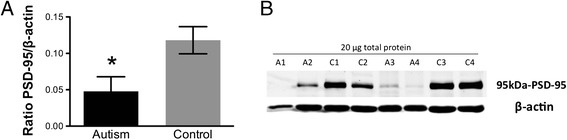
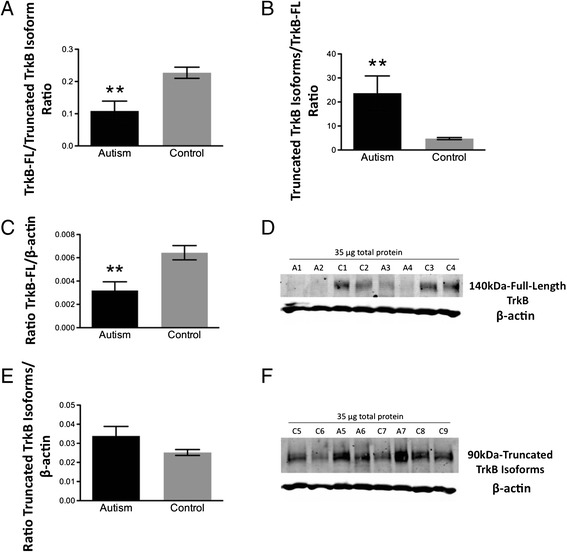
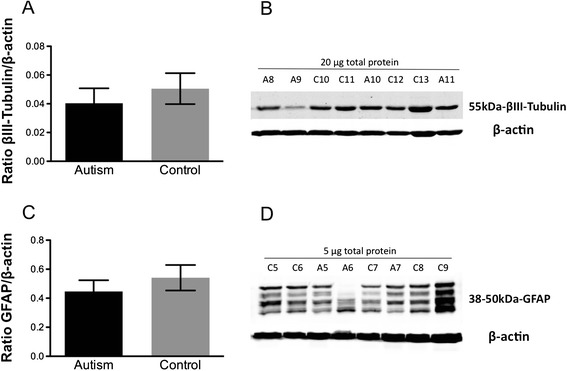
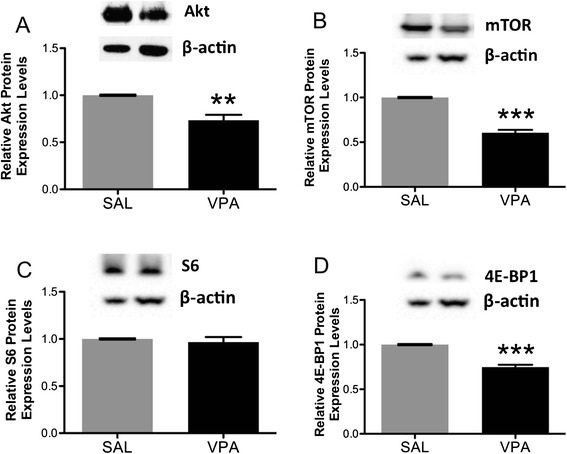
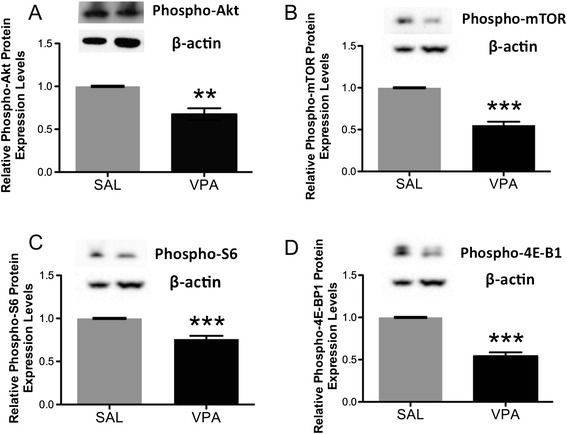
BACKGROUND: The molecular mechanisms underlying autistic behaviors remain to be elucidated. Mutations in genes linked to autism adversely affect molecules regulating dendritic spine formation, function and plasticity, and some increase the mammalian target of rapamycin, mTOR, a regulator of protein synthesis at spines. Here, we investigated whether the Akt/mTOR pathway is disrupted in idiopathic autism and in rats exposed to valproic acid, an animal model exhibiting autistic-like behavior. METHODS: Components of the mTOR pathway were assayed by Western blotting in postmortem fusiform gyrus samples from 11 subjects with idiopathic autism and 13 controls and in valproic acid versus saline-exposed rat neocortex. Additionally, protein levels of brain-derived neurotrophic factor receptor (TrkB) isoforms and the postsynaptic organizing molecule PSD-95 were measured in autistic versus control subjects. RESULTS: Full-length TrkB, PI3K, Akt, phosphorylated and total mTOR, p70S6 kinase, eIF4B and PSD-95 were reduced in autistic versus control fusiform gyrus. Similarly, phosphorylated and total Akt, mTOR and 4E-BP1 and phosphorylated S6 protein were decreased in valproic acid- versus saline-exposed rats. However, no changes in 4E-BP1 or eIF4E were found in autistic brains. CONCLUSIONS: In contrast to some monogenic disorders with high rates of autism, our data demonstrate down-regulation of the Akt/mTOR pathway, specifically via p70S6K/eIF4B, in idiopathic autism. These findings suggest that disruption of this pathway in either direction is widespread in autism and can have adverse consequences for synaptic function. The use of valproic acid, a histone deacetylase inhibitor, in rats successfully modeled these changes, implicating an epigenetic mechanism in these pathway disruptions.
Overview
The claims and statistics of this paper haven’t been checked yet.
Run the check — free, no account needed. It reads the open-access text and checks the sources it cites.
Integrity signals
Registry
Cites
Statistics
Figures
Verification
Claims the paper makes
The claims and statistics of this paper haven’t been checked yet.
Run the check — free, no account needed. It reads the open-access text and checks the sources it cites.
Claims other papers make about this one
Each is checked against this paper’s own text: does it say what the citing paper says it does?
In the citing paper
“Thus, these results further add to the literature supporting the idea that dysregulation of mTOR in either direction is likely important in ASD.104”
From Maternal immune activation dysregulation of the fetal brain transcriptome and relevance to the pathophysiology of autism spectrum disorder (2018) · cites this paper as [104]
Self-check
Percentages, sums and reported differences re-computed from the paper’s own numbers.
The self-check needs the paper’s full text.
Citations
Cites
Diagnostic and Statistical Manual of Mental Disorders
Williams, J. B. W., & First, M. B. (2013) · Oxford University Press eBooks · doi:10.1093/acrefore/9780199975839.013.104 · Cited by 109,845
Lord, C., Rutter, M., & Le Couteur, A. (1994) · Journal of Autism and Developmental Disorders · doi:10.1007/bf02172145 · Cited by 9,065
Upstream and downstream of mTOR
Hay, N., & Sonenberg, N. (2004) · Genes & Development · doi:10.1101/gad.1212704 · Cited by 4,181
Diagnostic and Statistical Manual of Mental Disorders
Raber, G., & Spokas, M. (2024) · doi:10.4135/9781071886229.n145 · Cited by 2,806
Autism Diagnostic Interview-Revised
Rutter, M., LeCouteur, A., & Lord, C. (2016) · PsycTESTS Dataset · doi:10.1037/t18128-000 · Cited by 1,627
Prenatal Valproate Exposure and Risk of Autism Spectrum Disorders and Childhood Autism
Christensen, J., Grønborg, T. K., Sørensen, M. J., Schendel, D., Parner, E. T., Pedersen, L. H., & Vestergaard, M. (2013) · JAMA · doi:10.1001/jama.2013.2270 · Cited by 1,357
mTOR signaling: At the crossroads of plasticity, memory and disease
Hoeffer, C. A., & Klann, E. (2010) · Trends in Neurosciences · doi:10.1016/j.tins.2009.11.003 · Cited by 1,128
Schultz, R. T., Gauthier, I., Klin, A., Fulbright, R. K., Anderson, A. W., Volkmar, F., Skudlarski, P., Lacadie, C., Cohen, D. J., & Gore, J. C. (2000) · Archives of General Psychiatry · doi:10.1001/archpsyc.57.4.331 · Cited by 1,000
Behavioral Alterations in Rats Prenatally Exposed to Valproic Acid: Animal Model of Autism
Schneider, T., & Przewłocki, R. (2005) · Neuropsychopharmacology · doi:10.1038/sj.npp.1300518 · Cited by 959
Klein, R., Nanduri, V., Jing, S., Lamballe, F., Tapley, P., Bryant, S., Cordon-Cardo, C., Jones, K. R., Reichardt, L. F., & Barbacid, M. (1991) · Cell · doi:10.1016/0092-8674(91)90628-c · Cited by 958
Zoghbi, H. Y., & Bear, M. F. (2012) · Cold Spring Harbor Perspectives in Biology · doi:10.1101/cshperspect.a009886 · Cited by 797
Increased dendritic spine densities on cortical projection neurons in autism spectrum disorders
Hutsler, J. J., & Zhang, H. (2010) · Brain Research · doi:10.1016/j.brainres.2009.09.120 · Cited by 765
Postsynaptic BDNF‐TrkB signaling in synapse maturation, plasticity, and disease
Yoshii, A., & Constantine‐Paton, M. (2010) · Developmental Neurobiology · doi:10.1002/dneu.20765 · Cited by 744
Basic Pharmacology of Valproate
̈scher, W. L. (2002) · CNS Drugs · doi:10.2165/00023210-200216100-00003 · Cited by 667
Bourgeron, T. (2009) · Current Opinion in Neurobiology · doi:10.1016/j.conb.2009.06.003 · Cited by 637 · cited 1×
“Studies of single-gene disorders with a high prevalence of autism such as Rett syndrome (mutations in MeCP2), fragile X syndrome (mutations in FMR1), tuberous sclerosis (mutations in TSC1/TSC2), neurofibromatosis (mutations in NF1), and macrocephaly (mutations in PTEN), point to the Akt/mTOR pathway as a good candidat…”
BackgroundtrkB, a novel tyrosine protein kinase receptor expressed during mouse neural development.
Klein, R., Parada, L. F., Coulier, F., & Barbacid, M. (1989) · The EMBO Journal · doi:10.1002/j.1460-2075.1989.tb08545.x · Cited by 598
The Autistic Neuron: Troubled Translation?
Kelleher, R. J., & Bear, M. F. (2008) · Cell · doi:10.1016/j.cell.2008.10.017 · Cited by 598
Jaworski, J., Spangler, S. A., Seeburg, D. P., Hoogenraad, C. C., & Sheng, M. (2005) · Journal of Neuroscience · doi:10.1523/jneurosci.2270-05.2005 · Cited by 597
Klein, R., Conway, D., Parada, L. F., & Barbacid, M. (1990) · Cell · doi:10.1016/0092-8674(90)90476-u · Cited by 590
Face recognition in human extrastriate cortex.
Allison, T., Ginter, H., McCarthy, G., Nobre, A. C., Puce, A., Luby, M., & Spencer, D. D. (1994) · Journal of Neurophysiology · doi:10.1152/jn.1994.71.2.821 · Cited by 567
A clinical study of 57 children with fetal anticonvulsant syndromes
Moore, S. J., Turnpenny, P., Quinn, A., Glover, S., Lloyd, D. J., Montgomery, T., & Dean, J. C. S. (2000) · Journal of Medical Genetics · doi:10.1136/jmg.37.7.489 · Cited by 562
Autism-related deficits via dysregulated eIF4E-dependent translational control
Gkogkas, C. G., Khoutorsky, A., Ran, I., Rampakakis, E., Nevarko, T., Weatherill, D. B., Vasuta, C., Yee, S., Truitt, M., Dallaire, P., et al. (2013) · Nature · doi:10.1038/nature11628 · Cited by 522
Eide, F. F., Vining, E. R., Eide, B. L., Zang, K., Wang, X., & Reichardt, L. F. (1996) · Journal of Neuroscience · doi:10.1523/jneurosci.16-10-03123.1996 · Cited by 473
The intense world syndrome-an alternative hypothesis for autism
Markram, H. (2007) · Frontiers in Neuroscience · doi:10.3389/neuro.01.1.1.006.2007 · Cited by 394
Abnormal Fear Conditioning and Amygdala Processing in an Animal Model of Autism
Markram, H., Barkat, T. R., Mendola, D. L., Sandi, C., & Markram, H. (2007) · Neuropsychopharmacology · doi:10.1038/sj.npp.1301453 · Cited by 392
Ingram, J. L., Peckham, S. M., Tisdale, B., & Rodier, P. M. (2000) · Neurotoxicology and Teratology · doi:10.1016/s0892-0362(99)00083-5 · Cited by 381
Truncated TrkB-T1 mediates neurotrophin-evoked calcium signalling in glia cells
Rose, C. R., Blum, R., Pichler, B., Lepier, A., Kafitz, K. W., & Konnerth, A. (2003) · Nature · doi:10.1038/nature01983 · Cited by 374
Unfamiliar Face Recognition in Relatively Able Autistic Children
Boucher, J., & LEWIS, V. A. (1992) · Journal of Child Psychology and Psychiatry · doi:10.1111/j.1469-7610.1992.tb01960.x · Cited by 363
New insights into the role of brain-derived neurotrophic factor in synaptic plasticity
Waterhouse, E. G., & Xu, B. (2009) · Molecular and Cellular Neuroscience · doi:10.1016/j.mcn.2009.06.009 · Cited by 352
Epigenetics of autism spectrum disorders
Schanen, N. C. (2006) · Human Molecular Genetics · doi:10.1093/hmg/ddl213 · Cited by 341
Kataoka, S., Takuma, K., Hara, Y., Maeda, Y., Ago, Y., & Matsuda, T. (2013) · International Journal of Neuropsychopharmacology · doi:10.1017/s1461145711001714 · Cited by 341
Fetal Valproate Syndrome: Clinical and Neuro‐developmental Features in Two Sibling Pairs
Christianson, A. L., Chester, N., & Kromberg, J. G. R. (1994) · Developmental Medicine & Child Neurology · doi:10.1111/j.1469-8749.1994.tb11858.x · Cited by 337
Wong, C. C. Y., Meaburn, E. L., Ronald, A., Price, T. S., Jeffries, A. R., Schalkwyk, L. C., Plomin, R., & Mill, J. (2014) · Molecular Psychiatry · doi:10.1038/mp.2013.41 · Cited by 327
Williams, R. S. (1980) · Archives of Neurology · doi:10.1001/archneur.1980.00500610029003 · Cited by 318
Linking etiologies in humans and animal models: Studies of autism
Rodier, P. M., Ingram, J. L., Tisdale, B., & Croog, V. J. (1997) · Reproductive Toxicology · doi:10.1016/s0890-6238(97)80001-u · Cited by 248
Levitt, P., & Campbell, D. B. (2009) · Journal of Clinical Investigation · doi:10.1172/jci37934 · Cited by 234 · cited 2×
“Indeed, mutations in genes encoding Akt-mTOR cascade components cause disorders with high rates of autism [2-5].”
BackgroundEffect of sodium valproate on mania
Emrich, H. M., Zerssen, D. V., Kissling, W., M�ller, H.-J., & Windorfer, A. (1980) · European Archives of Psychiatry and Clinical Neuroscience · doi:10.1007/bf00343800 · Cited by 232
Levels of categorization in visual recognition studied using functional magnetic resonance imaging
Gauthier, L., Anderson, A. W., Tarr, M. J., Skudlarski, P., & Gore, J. C. (1997) · Current Biology · doi:10.1016/s0960-9822(06)00291-0 · Cited by 230
Rapamycin for treating Tuberous sclerosis and Autism spectrum disorders
Ehninger, D., & Silva, A. J. (2010) · Trends in Molecular Medicine · doi:10.1016/j.molmed.2010.10.002 · Cited by 223
Reduced AKT/mTOR signaling and protein synthesis dysregulation in a Rett syndrome animal model
Ricciardi, S., Boggio, E. M., Grosso, S., Lonetti, G., Forlani, G., Stefanelli, G., Calcagno, E., Morello, N., Landsberger, N., Biffo, S., et al. (2011) · Human Molecular Genetics · doi:10.1093/hmg/ddq563 · Cited by 223
Roullet, F., Wollaston, L., deCatanzaro, D., & Foster, J. A. (2010) · Neuroscience · doi:10.1016/j.neuroscience.2010.06.069 · Cited by 213
Rinaldi, T. (2008) · Frontiers in Neural Circuits · doi:10.3389/neuro.04.004.2008 · Cited by 210
Narita, N., Kato, M., Tazoe, M., Miyazaki, K., Narita, M., & Okado, N. (2002) · Pediatric Research · doi:10.1203/00006450-200210000-00018 · Cited by 203
Reductions in neurotrophin receptor mRNAs in the prefrontal cortex of patients with schizophrenia
Weickert, C. S., Ligons, D. L., Romanczyk, T. B., Ungaro, G., Hyde, T. M., Herman, M. M., Weinberger, D. R., & Kleinman, J. E. (2005) · Molecular Psychiatry · doi:10.1038/sj.mp.4001678 · Cited by 199
Stoilov, P., Ċastrén, E., & Stamm, S. (2002) · Biochemical and Biophysical Research Communications · doi:10.1006/bbrc.2001.6301 · Cited by 191
Hyperconnectivity of Local Neocortical Microcircuitry Induced by Prenatal Exposure to Valproic Acid
Rinaldi, T., Silberberg, G., & Markram, H. (2008) · Cerebral Cortex · doi:10.1093/cercor/bhm117 · Cited by 184
Correia, C., Coutinho, A. M., Sequeira, A. F., Sousa, I., Venda, L. L., Almeida, J. P., Abreu, R., Lobo, C., Miguel, T. S., Conroy, J., et al. (2010) · Genes Brain & Behavior · doi:10.1111/j.1601-183x.2010.00627.x · Cited by 147
Deregulation of EIF4E: a novel mechanism for autism
Neves-Pereira, M., Müller, B., Massie, D., Williams, J. H. G., O’Brien, P. C. M., Hughes, A., Shen, S.-B., Clair, D. S., & Miedzybrodzka, Z. (2009) · Journal of Medical Genetics · doi:10.1136/jmg.2009.066852 · Cited by 142
Truncated trkB.T1 Is Dominant Negative Inhibitor of trkB.TK+-Mediated Cell Survival
Haapasalo, A., Koponen, E., Hoppe, E., Wong, G., & Ċastrén, E. (2001) · Biochemical and Biophysical Research Communications · doi:10.1006/bbrc.2001.4296 · Cited by 126
BDNF‐Akt‐Bcl2 antiapoptotic signaling pathway is compromised in the brain of autistic subjects
Sheikh, A. M., Malik, M. N., Wen, G. Y., Chauhan, A., Chauhan, V. P. S., Gong, C., Liu, F., Brown, W. T., & Li, X. (2010) · Journal of Neuroscience Research · doi:10.1002/jnr.22416 · Cited by 122
Regulation of local translation at the synapse by BDNF
Santos, A. R., Comprido, D., & Duarte, C. B. (2010) · Progress in Neurobiology · doi:10.1016/j.pneurobio.2010.08.004 · Cited by 122
Kolozsi, E., Mackenzie, R. N., Roullet, F. I., Decatanzaro, D., & Foster, J. A. (2009) · Neuroscience · doi:10.1016/j.neuroscience.2009.07.021 · Cited by 110
Deregulated mTOR-mediated translation in intellectual disability
Troca-Marín, J. A., Alves-Sampaio, A., & Montesinos, M. L. (2012) · Progress in Neurobiology · doi:10.1016/j.pneurobio.2012.01.005 · Cited by 109
Altered Balance of Proteolytic Isoforms of Pro-Brain-Derived Neurotrophic Factor in Autism
Garcia, K. L. P., Yu, G., Nicolini, C., Michalski, B., Garzon, D. J., Chiu, V. S., Tongiorgi, E., Szatmári, P., & Fahnestock, M. L. (2012) · Journal of Neuropathology & Experimental Neurology · doi:10.1097/nen.0b013e31824b27e4 · Cited by 99
Self-citationAlterations in trkB mRNA in the human prefrontal cortex throughout the lifespan
Romanczyk, T. B., Weickert, C. S., Webster, M. J., Herman, M. M., Akil, M., & Kleinman, J. E. (2002) · European Journal of Neuroscience · doi:10.1046/j.0953-816x.2001.01858.x · Cited by 91
Fatemi, S. H., & Folsom, T. D. (2011) · Molecular Autism · doi:10.1186/2040-2392-2-6 · Cited by 84
Increases in Two Truncated TrkB Isoforms in the Prefrontal Cortex of People With Schizophrenia
Wong, J., Rothmond, D. A., Webster, M. J., & Weickert, C. S. (2011) · Schizophrenia Bulletin · doi:10.1093/schbul/sbr070 · Cited by 69
Eps8 controls dendritic spine density and synaptic plasticity through its actin‐capping activity
Menna, E., Zambetti, S., Morini, R., Donzelli, A., Disanza, A., Calvigioni, D., Braida, D., Nicolini, C., Orlando, M., Fossati, G., et al. (2013) · The EMBO Journal · doi:10.1038/emboj.2013.107 · Cited by 68
Self-citationDistribution of Glial Fibrillary Acidic Protein in Gliosed Human White Matter
Newcombe, J., Woodroofe, M. N., & Cuzner, M. L. (1986) · Journal of Neurochemistry · doi:10.1111/j.1471-4159.1986.tb13079.x · Cited by 64
Discrimination learning and reversal of the conditioned eyeblink reflex in a rodent model of autism
Stanton, M. E., Peloso, E. D., BROWN, K., & Rodier, P. M. (2006) · Behavioural Brain Research · doi:10.1016/j.bbr.2006.10.022 · Cited by 61
Chomiak, T., Karnik, V., Block, E. W., & Hu, B. (2010) · BMC Neuroscience · doi:10.1186/1471-2202-11-102 · Cited by 51
Expression of TrkB subtypes in the adult monkey cerebellar cortex
Ohira, K., & Hayashi, M. (2003) · Journal of Chemical Neuroanatomy · doi:10.1016/s0891-0618(02)00096-0 · Cited by 39
Pillai, A., & Mahadik, S. P. (2008) · Schizophrenia Research · doi:10.1016/j.schres.2007.11.030 · Cited by 37
Dysregulated mTORC1-Dependent Translational Control: From Brain Disorders to Psychoactive Drugs
Santini, E., & Klann, E. (2011) · Frontiers in Behavioral Neuroscience · doi:10.3389/fnbeh.2011.00076 · Cited by 34
[Dipropylacetamide in the treatment of manic-depressive psychosis].
Lambert, P. A., Carraz, G., Borselli, S., & Bouchardy, M. (1975) · PubMed · Cited by 28
Research works printed but not linked: 1
- Ahn Y, Narous M, Tobias R, Hu B, Rho JM (2012) Alterations in social behavior and mTOR signaling in the valproic acid-induced model of autism spectrum disorder, Program No. 861.21. 2012 Neuroscience Meeting Planner. Society for Neuroscience, New Orleans, LA, Online
Cited by
Sorted by citations
Filipello, F., Morini, R., Corradini, I., Zerbi, V., Canzi, A., Michalski, B., Erreni, M., Markicevic, M., Starvaggi-Cucuzza, C., Otero, K., et al. (2018) · Immunity · doi:10.1016/j.immuni.2018.04.016 · Cited by 695
Self-citationThe valproic acid-induced rodent model of autism
Nicolini, C., & Fahnestock, M. L. (2017) · Experimental Neurology · doi:10.1016/j.expneurol.2017.04.017 · Cited by 622
Self-citationWang, X., Wang, B., Wu, C., Wang, J., & Sun, M. (2023) · International Journal of Molecular Sciences · doi:10.3390/ijms24031819 · Cited by 305
Environmental toxicology: Sensitive periods of development and neurodevelopmental disorders
Heyer, D. B., & Meredith, R. M. (2016) · NeuroToxicology · doi:10.1016/j.neuro.2016.10.017 · Cited by 247
Abnormal mTOR Activation in Autism
Winden, K. D., Ebrahimi‐Fakhari, D., & Şahin, M. (2018) · Annual Review of Neuroscience · doi:10.1146/annurev-neuro-080317-061747 · Cited by 232
Metadata
- Authors
- Nicolini, C., Ahn, Y., Michalski, B., Rho, J. M., & Fahnestock, M.
- Affiliations
- McMaster University (CA)
- University of Calgary (CA)
- Corresponding author
- Fahnestock, Margaret
- Venue
- Acta Neuropathologica Communications
- Published
- 2015-01-20
- Volume
- 3
- Issue
- 1
- Pages
- 3-3
- ISSN
- 2051-5960 (ISSN-L)
- PMC
- PMC4307681
- OpenAlex
- W2118513080
- Cited by
- 109
- References
- 66
- Citations by year
- 2026: 13 · 2025: 12 · 2024: 9 · 2023: 10 · 2022: 10 · 2021: 9 · 2020: 8 · 2019: 6 · 2018: 12 · 2017: 9 · 2016: 8 · 2015: 3
- FWCI
- 7.29
- Type
- journal article
- Language
- en
- Open access
- gold
- doi.org
- Locations
- Acta Neuropathologica Communications (publishedVersion, cc-by)
- Europe PMC (PubMed Central) (publishedVersion, cc-by)
- PubMed Central (publishedVersion, cc-by)
- PubMed (publishedVersion)
- eScholarship (California Digital Library) (submittedVersion)
- eScholarship (California Digital Library) (submittedVersion, cc-by)
- Funders
- Autism Speaks
- Alberta Children's Hospital Research Institute
- Canadian Institutes of Health Research
- Topics
- Life Sciences › Biochemistry, Genetics and Molecular Biology › Genetics › Genetics and Neurodevelopmental Disorders
- Life Sciences › Neuroscience › Cognitive Neuroscience › Autism Spectrum Disorder Research
- Life Sciences › Biochemistry, Genetics and Molecular Biology › Molecular Biology › PI3K/AKT/mTOR signaling in cancer
- Keywords
- idiopathic autism, mTOR signaling, Akt/mTOR signaling, valproic acid, animal models of autism, p70 S6 kinase, eIF4B, 4E-BP1, PSD-95, TrkB, phosphatidylinositol 3-kinase, synaptic plasticity, dendritic spines, histone deacetylase inhibition, epigenetics, fusiform gyrus, neocortex
- MeSH terms
- Disks Large Homolog 4 Protein, Adolescent, Adult, Animals, Anticonvulsants, Autistic Disorder, Child, Child, Preschool, Disease Models, Animal, Female, Gene Expression Regulation, Humans, Male, Membrane Proteins, Middle Aged, Postmortem Changes, Pregnancy, Prenatal Exposure Delayed Effects, RNA, Messenger, Temporal Lobe, Valproic Acid, Signal Transduction, Intracellular Signaling Peptides and Proteins, Rats, Young Adult, TOR Serine-Threonine Kinases
About these checks
Registry, retraction, Cites and statistics results are computed, not judged, with one exception: a printed reference that no index lists is read once by a model before it counts as a citation error. Claims are extracted by a model and kept only when their quote appears verbatim in the text; each cited source is then checked, with a model’s help, for whether it says what the claim relies on. Those verdicts can be wrong — read the claim’s quote and the cited source before relying on one.
Statistics and arithmetic are recomputed, not judged.
Confidence bands are shown only for fields calibrated on our annotated test set. None is calibrated yet, so no band is shown.
What counts as a claim ›How we measure confidence ›How we check this ›
Are you an author, or do you see a problem with this page? Request a review
