

The DOI matches its Crossref record; 62 of the 62 references it cites were found in a registry or an index.
Multiplex proteomics identifies novel CSF and plasma biomarkers of early Alzheimer’s disease
Open accessAbstract
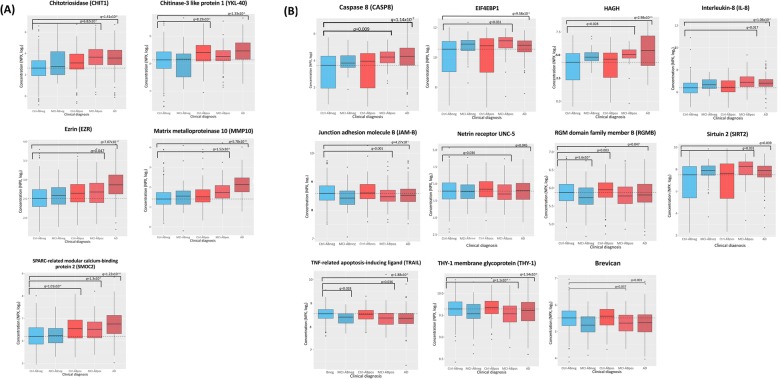
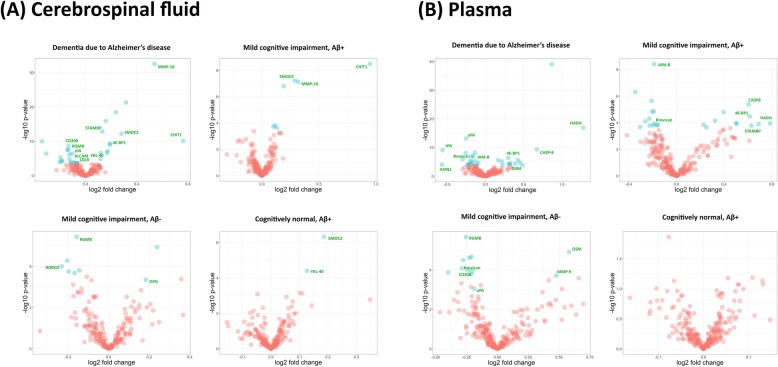
To date, the development of disease-modifying therapies for Alzheimer’s disease (AD) has largely focused on the removal of amyloid beta Aβ fragments from the CNS. Proteomic profiling of patient fluids may help identify novel therapeutic targets and biomarkers associated with AD pathology. Here, we applied the Olink™ ProSeek immunoassay to measure 270 CSF and plasma proteins across 415 Aβ- negative cognitively normal individuals (Aβ- CN), 142 Aβ-positive CN (Aβ+ CN), 50 Aβ- mild cognitive impairment (MCI) patients, 75 Aβ+ MCI patients, and 161 Aβ+ AD patients from the Swedish BioFINDER study. A validation cohort included 59 Aβ- CN, 23 Aβ- + CN, 44 Aβ- MCI and 53 Aβ+ MCI. To compare protein concentrations in patients versus controls, we applied multiple linear regressions adjusting for age, gender, medications, smoking and mean subject-level protein concentration, and corrected findings for false discovery rate (FDR, q < 0.05). We identified, and replicated, altered levels of ten CSF proteins in Aβ+ individuals, including CHIT1, SMOC2, MMP-10, LDLR, CD200, EIF4EBP1, ALCAM, RGMB, tPA and STAMBP (− 0.14 < d < 1.16; q < 0.05). We also identified and replicated alterations of six plasma proteins in Aβ+ individuals OSM, MMP-9, HAGH, CD200, AXIN1, and uPA (− 0.77 < d < 1.28; q < 0.05). Multiple analytes associated with cognitive performance and cortical thickness ( q < 0.05). Plasma biomarkers could distinguish AD dementia (AUC = 0.94, 95% CI = 0.87–0.98) and prodromal AD (AUC = 0.78, 95% CI = 0.68–0.87) from CN. These findings reemphasize the contributions of immune markers, phospholipids, angiogenic proteins and other biomarkers downstream of, and potentially orthogonal to, Aβ- and tau in AD, and identify candidate biomarkers for earlier detection of neurodegeneration.
Overview
The claims and statistics of this paper haven’t been checked yet.
Run the check — free, no account needed. It reads the open-access text and checks the sources it cites.
Integrity signals
Registry
Cites
Statistics
Figures
Verification
Claims the paper makes
The claims and statistics of this paper haven’t been checked yet.
Run the check — free, no account needed. It reads the open-access text and checks the sources it cites.
Claims other papers make about this one
Each is checked against this paper’s own text: does it say what the citing paper says it does?
The cited source says what the claim attributes to it.
In the citing paper
“Most proteins were measured using validated, highly sensitive and specific PEA developed by Olink Proteomics (Uppsala, Sweden) as described before (Whelan et al, 2019).”
From The genetic regulation of protein expression in cerebrospinal fluid (2023) · cites this paper as Whelan et al, 2019
Self-check
Percentages, sums and reported differences re-computed from the paper’s own numbers.
The self-check needs the paper’s full text.
Citations
Cites
Regression shrinkage and selection via the lasso
Tibshirani, R. (1996) · Journal of the Royal Statistical Society Series B: Statistical Methodology · doi:10.1111/j.2517-6161.1996.tb02080.x · Cited by 51,482
McKhann, G. M., Knopman, D. S., Chertkow, H., Hyman, B. T., Jack, C. R., Kawas, C. H., Klunk, W. E., Koroshetz, W. J., Manly, J. J., Mayeux, R., et al. (2011) · Alzheimer's & Dementia · doi:10.1016/j.jalz.2011.03.005 · Cited by 18,657
Blood–brain barrier breakdown in Alzheimer disease and other neurodegenerative disorders
Sweeney, M. D., Sagare, A. P., & Zlokovic, B. V. (2018) · Nature Reviews Neurology · doi:10.1038/nrneurol.2017.188 · Cited by 3,076
Olsson, B., Lautner, R., Andreasson, U., Öhrfelt, A., Portelius, E., Bjerke, M., Hölttä, M., Rosén, C., Olsson, C., Strobel, G., et al. (2016) · The Lancet Neurology · doi:10.1016/s1474-4422(16)00070-3 · Cited by 2,049
Assarsson, E., Lundberg, M., Holmquist, G., Björkesten, J., Bucht Thorsen, S., Ekman, D., Eriksson, A., Rennel Dickens, E., Ohlsson, S., Edfeldt, G., et al. (2014) · PLoS ONE · doi:10.1371/journal.pone.0095192 · Cited by 1,874
Lessons learned from the fate of AstraZeneca's drug pipeline: a five-dimensional framework
Cook, D., Brown, D., Alexander, R., March, R., Morgan, P., Satterthwaite, G., & Pangalos, M. N. (2014) · Nature Reviews Drug Discovery · doi:10.1038/nrd4309 · Cited by 1,344
ARUK Consortium, Sims, R., GERAD/PERADES, C., van der Lee, S. J., Naj, A. C., Bellenguez, C., Badarinarayan, N., Jakobsdottir, J., Kunkle, B. W., Boland, A., et al. (2017) · Nature Genetics · doi:10.1038/ng.3916 · Cited by 1,012 · cited 2×
“However, recent evidence from human genetics [45, 52], neuroimaging [14], and in-vivo modeling [9] has strongly implicated additional disease mechanisms in AD, not reflected by the established Aβ and tau biomarkers.”
BackgroundPalmqvist, S., Schöll, M., Strandberg, O., Mattsson, N., Stomrud, E., Zetterberg, H., Blennow, K., Landau, S., Jagust, W., & Hansson, O. (2017) · Nature Communications · doi:10.1038/s41467-017-01150-x · Cited by 911
Self-citationAlzheimer's disease drug development pipeline: 2017
Cummings, J., Lee, G., Mortsdorf, T., Ritter, A., & Zhong, K. (2017) · Alzheimer's & Dementia: Translational Research & Clinical Interventions · doi:10.1016/j.trci.2017.05.002 · Cited by 549
YKL-40: A Novel Prognostic Fluid Biomarker for Preclinical Alzheimer's Disease
Craig-Schapiro, R., Perrin, R. J., Roe, C. M., Xiong, C., Carter, D., Cairns, N. J., Mintun, M. A., Peskind, E. R., Li, G., Galasko, D. R., et al. (2010) · Biological Psychiatry · doi:10.1016/j.biopsych.2010.08.025 · Cited by 504
Plasma tau in Alzheimer disease
Mattsson, N., Zetterberg, H., Janelidze, S., Insel, P. S., Andreasson, U., Stomrud, E., Palmqvist, S., Baker, D., Tan Hehir, C. A., Jeromin, A., et al. (2016) · Neurology · doi:10.1212/wnl.0000000000003246 · Cited by 502
Self-citationThe role of junctional adhesion molecules in vascular inflammation
Weber, C., Fraemohs, L., & Dejana, E. (2007) · Nature reviews. Immunology · doi:10.1038/nri2096 · Cited by 501
CSF A β 42/A β 40 and A β 42/A β 38 ratios: better diagnostic markers of Alzheimer disease
Janelidze, S., Zetterberg, H., Mattsson, N., Palmqvist, S., Vanderstichele, H., Lindberg, O., van Westen, D., Stomrud, E., Minthon, L., Blennow, K., et al. (2016) · Annals of Clinical and Translational Neurology · doi:10.1002/acn3.274 · Cited by 456
Self-citationAn early and late peak in microglial activation in Alzheimer’s disease trajectory
Fan, Z., Brooks, D. J., Okello, A., & Edison, P. (2017) · Brain · doi:10.1093/brain/aww349 · Cited by 438
Palmqvist, S., Janelidze, S., Stomrud, E., Zetterberg, H., Karl, J., Zink, K., Bittner, T., Mattsson, N., Eichenlaub, U., Blennow, K., et al. (2019) · JAMA Neurology · doi:10.1001/jamaneurol.2019.1632 · Cited by 435
Self-citationBlood-Based Protein Biomarkers for Diagnosis of Alzheimer Disease
Doecke, J. D. (2012) · Archives of Neurology · doi:10.1001/archneurol.2012.1282 · Cited by 422
Miners, J. S., Baig, S., Palmer, J. C., Palmer, L. E., Kehoe, P. G., & Love, S. (2008) · Brain Pathology · doi:10.1111/j.1750-3639.2008.00132.x · Cited by 393
Palmqvist, S., Zetterberg, H., Blennow, K., Vestberg, S., Andreasson, U., Brooks, D. J., Owenius, R., Hägerström, D., Wollmer, P., Minthon, L., et al. (2014) · JAMA Neurology · doi:10.1001/jamaneurol.2014.1358 · Cited by 368
Self-citationCSF biomarkers of neuroinflammation and cerebrovascular dysfunction in early Alzheimer disease
Janelidze, S., Mattsson, N., Stomrud, E., Lindberg, O., Palmqvist, S., Zetterberg, H., Blennow, K., & Hansson, O. (2018) · Neurology · doi:10.1212/wnl.0000000000006082 · Cited by 359
Self-citationA Review of Fluid Biomarkers for Alzheimer’s Disease: Moving from CSF to Blood
Blennow, K. (2017) · Neurology and Therapy · doi:10.1007/s40120-017-0073-9 · Cited by 295
Cho, S.-H., Sun, B., Zhou, Y., Kauppinen, T. M., Halabisky, B., Wes, P., Ransohoff, R. M., & Gan, L. (2011) · Journal of Biological Chemistry · doi:10.1074/jbc.m111.254268 · Cited by 268
Jack, C. R., Wiste, H. J., Weigand, S. D., Knopman, D. S., Mielke, M. M., Vemuri, P., Lowe, V. J., Senjem, M. L., Gunter, J. L., Reyes, D. A., et al. (2015) · Brain · doi:10.1093/brain/awv283 · Cited by 258
CSF biomarkers for Alzheimer disease correlate with cortical brain biopsy findings
Seppälä, T. T., Nerg, O., Koivisto, A. M., Rummukainen, J., Puli, L., Zetterberg, H., Pyykkö, O. T., Helisalmi, S., Alafuzoff, I., Hiltunen, M., et al. (2012) · Neurology · doi:10.1212/wnl.0b013e3182563bd0 · Cited by 236
Dysregulation of lipids in Alzheimer’s disease and their role as potential biomarkers
Wong, M. W., Braidy, N., Poljak, A., Pickford, R., Thambisetty, M., & Sachdev, P. S. (2017) · Alzheimer's & Dementia · doi:10.1016/j.jalz.2017.01.008 · Cited by 223
Mormino, E. C., Papp, K. V., Rentz, D. M., Donohue, M., Amariglio, R. E., Quiroz, Y. T., Chhatwal, J. P., Marshall, G. A., Donovan, N. J., Jackson, J., et al. (2017) · Alzheimer s & Dementia · doi:10.1016/j.jalz.2017.01.018 · Cited by 205
Plasma proteins predict conversion to dementia from prodromal disease
Hye, A., Riddoch‐Contreras, J., Baird, A. L., Ashton, N. J., Bazenet, C. E., Leung, R., Westman, E., Simmons, A., Dobson, R., Sattlecker, M., et al. (2014) · Alzheimer s & Dementia · doi:10.1016/j.jalz.2014.05.1749 · Cited by 201
Chitinase 3-like 1: prognostic biomarker in clinically isolated syndromes
Cantó, E., Tintoré, M., Villar, L. M., Costa, C., Nurtdinov, R., Álvarez-Cermeño, J. C., Arrambide, G., Reverter, F., Deisenhammer, F., Hegen, H., et al. (2015) · Brain · doi:10.1093/brain/awv017 · Cited by 193
Amyloid β Oligomers Disrupt Blood–CSF Barrier Integrity by Activating Matrix Metalloproteinases
Brkić, M., Balusu, S., Wonterghem, E. V., Gorlé, N., Benilova, I., Kremer, A., Hove, I. V., Moons, L., Strooper, B. D., Kanazir, S., et al. (2015) · Journal of Neuroscience · doi:10.1523/jneurosci.0006-15.2015 · Cited by 192
Ramanan, V. K., & Saykin, A. J. (2013) · Europe PMC (PubMed Central) · Cited by 190
Junctional adhesion molecule-2 (JAM-2) promotes lymphocyte transendothelial migration
Johnson‐Léger, C., Aurrand‐Lions, M., Beltraminelli, N., Fasel, N. J., & Imhof, B. A. (2002) · Blood · doi:10.1182/blood-2001-11-0098 · Cited by 182
Cerebrospinal fluid neurogranin and YKL ‐40 as biomarkers of Alzheimer's disease
Janelidze, S., Hertze, J., Zetterberg, H., Landqvist Waldö, M., Santillo, A., Blennow, K., & Hansson, O. (2016) · Annals of Clinical and Translational Neurology · doi:10.1002/acn3.266 · Cited by 179
Self-citationActivation of Caspase-8 in the Alzheimer's Disease Brain
Rohn, T. T., Head, E., Nesse, W. H., Cotman, C. W., & Cribbs, D. H. (2001) · Neurobiology of Disease · doi:10.1006/nbdi.2001.0449 · Cited by 171
Amyloid precursor protein metabolism and inflammation markers in preclinical Alzheimer disease
Alcolea, D., Martínez-Lage, P., Sánchez-Juan, P., Olazarán, J., Antúnez, C., Izagirre, A., Ecay-Torres, M., Estanga, A., Clerigué, M., Guisasola, M. C., et al. (2015) · Neurology · doi:10.1212/wnl.0000000000001859 · Cited by 163
Genetic Susceptibility for Alzheimer Disease Neuritic Plaque Pathology
Shulman, J. M., Chen, K., Keenan, B. T., Chibnik, L. B., Fleisher, A., Thiyyagura, P., Roontiva, A., Aubin, C., Patsopoulos, N. A., Corneveaux, J. J., et al. (2013) · JAMA Neurology · doi:10.1001/jamaneurol.2013.2815 · Cited by 162
O’Bryant, S. E., Xiao, G., Barber, R. C., Huebinger, R. M., Wilhelmsen, K. C., Edwards, M., Graff‐Radford, N. R., Doody, R. S., Diaz-Arrastia, R. R., & Initiative, A. D. N. (2011) · PLoS ONE · doi:10.1371/journal.pone.0028092 · Cited by 156
Abeta 17-42 in Alzheimer's disease activates JNK and caspase-8 leading to neuronal apoptosis
Wei, W. (2002) · Brain · doi:10.1093/brain/awf205 · Cited by 155
Advanced glycation end product level, diabetes, and accelerated cognitive aging
Yaffe, K. S., Lindquist, K. J., Schwartz, A. V., Vitartas, C., Vittinghoff, E., Satterfield, S., Simonsick, E. M., Launer, L. J., Rosano, C., Cauley, J. A., et al. (2011) · Neurology · doi:10.1212/wnl.0b013e3182315a56 · Cited by 153
Alzheimer's Disease Genetics Consortium, Wetzel-Smith, M. K., Hunkapiller, J., Bhangale, T. R., Srinivasan, K., Maloney, J. A., Atwal, J. K., Sa, S. M., B Yaylaoglu, M., Foreman, O., et al. (2014) · Nature Medicine · doi:10.1038/nm.3736 · Cited by 153
Robo1 and Robo2 Are Homophilic Binding Molecules That Promote Axonal Growth
Hivert, B. (2002) · Molecular and Cellular Neuroscience · doi:10.1006/mcne.2002.1193 · Cited by 140
A genome-wide study of common SNPs and CNVs in cognitive performance in the CANTAB
Need, A. C., Attix, D. K., McEvoy, J. M., Cirulli, E. T., Linney, K. L., Hunt, P., Ge, D., Heinzen, E. L., Maia, J. M., Shianna, K. V., et al. (2009) · Human Molecular Genetics · doi:10.1093/hmg/ddp413 · Cited by 135
OPG/RANKL/RANK axis is a critical inflammatory signaling system in ischemic brain in mice
Shimamura, M., Nakagami, H., Osako, M. K., Kurinami, H., Koriyama, H., Zhengda, P., Tomioka, H., Tenma, A., Wakayama, K., & Morishita, R. (2014) · Proceedings of the National Academy of Sciences · doi:10.1073/pnas.1400544111 · Cited by 134
Ramanan, V. K., Risacher, S. L., Nho, K., Kim, S., Shen, L., McDonald, B. C., Yoder, K. K., Hutchins, G. D., West, J. D., Tallman, E. F., et al. (2015) · Brain · doi:10.1093/brain/awv231 · Cited by 133
Steinacker, P., Verde, F., Fang, L., Feneberg, E., Oeckl, P., Roeber, S., Anderl-Straub, S., Danek, A., Diehl-Schmid, J., Fassbender, K., et al. (2018) · Journal of Neurology, Neurosurgery & Psychiatry · doi:10.1136/jnnp-2017-317138 · Cited by 129
Mattsson, N., Tabatabaei, S., Johansson, P., Hansson, O., Andreasson, U., Månsson, J.-E., Johansson, J.-O., Olsson, B., Wallin, A., Svensson, J., et al. (2011) · NeuroMolecular Medicine · doi:10.1007/s12017-011-8147-9 · Cited by 118
Self-citationChitinase enzyme activity in CSF is a powerful biomarker of Alzheimer disease
Watabe‐Rudolph, M., Song, Z., Lausser, L. M., Schnack, C., Begus‐Nahrmann, Y., Scheithauer, M.-O., Rettinger, G., Otto, M., Tumani, H., Thal, D. R., et al. (2012) · Neurology · doi:10.1212/wnl.0b013e318247caa1 · Cited by 115
Tissue plasminogen activator mediates amyloid‐induced neurotoxicity via Erk1/2 activation
Medina, M. G., Ledesma, M. D., Domínguez, J. E., Medina, M., Zafra, D., Alameda, F., Dotti, C. G., & Navarro, P. (2005) · The EMBO Journal · doi:10.1038/sj.emboj.7600650 · Cited by 114
Alcolea, D. A., Vilaplana, E., Pegueroles, J., Montal, V., Sánchez‐Juan, P., González‐Suárez, A., Pozueta, A., Rodríguez‐Rodríguez, E., Bartrés‐Faz, D., Dídac Vidal-piñeiro, A., et al. (2015) · Neurobiology of Aging · doi:10.1016/j.neurobiolaging.2015.03.001 · Cited by 90
Ma, C. H. E., Brenner, G. J., Omura, T., Samad, O. A., Costigan, M., Inquimbert, P., Niederkofler, V., Salie, R., Sun, C. C., Lin, H. Y.-F., et al. (2011) · Journal of Neuroscience · doi:10.1523/jneurosci.4550-11.2011 · Cited by 79
Self-citationVarnum, M. M., Kiyota, T., Dixie, K. L. I., Ikezu, S., & Ikezu, T. (2015) · Neurobiology of Aging · doi:10.1016/j.neurobiolaging.2015.07.027 · Cited by 77
Merino, P., Díaz, A., Jeanneret, V., Wu, F., Torre, E. R., Cheng, L., & Yepes, M. (2016) · Journal of Biological Chemistry · doi:10.1074/jbc.m116.761650 · Cited by 75
Kuhla, A., Ludwig, S. C., Kuhla, B., Münch, G. W., & Vollmar, B. (2014) · Neurobiology of Aging · doi:10.1016/j.neurobiolaging.2014.09.025 · Cited by 70
SPARC Regulates Microgliosis and Functional Recovery following Cortical Ischemia
Lloyd-Burton, S. M., York, E. M., Anwar, M. A., Vincent, A. J., & Roskams, A. J. (2013) · Journal of Neuroscience · doi:10.1523/jneurosci.3585-12.2013 · Cited by 67
Paterson, R. W., Heywood, W., Heslegrave, A., Magdalinou, N. K., Andréasson, U., Sirka, E., Bliss, E., Slattery, C. F., Toombs, J., Svensson, J., et al. (2016) · Translational Psychiatry · doi:10.1038/tp.2016.194 · Cited by 65
Targeting caspase-6 and caspase-8 to promote neuronal survival following ischemic stroke
Shabanzadeh, A. P., D’Onofrio, P. M., Monnier, P. P., & Koeberle, P. D. (2015) · Cell Death and Disease · doi:10.1038/cddis.2015.272 · Cited by 62
Increased amyloidogenic APP processing in APOE ɛ4-negative individuals with cerebral β-amyloidosis
Mattsson, N., Insel, P. S., Palmqvist, S., Stomrud, E., van Westen, D., Minthon, L., Zetterberg, H., Blennow, K., & Hansson, O. (2016) · Nature Communications · doi:10.1038/ncomms10918 · Cited by 60
Self-citationTucker, H. M., Kihiko‐Ehmann, M., & Estus, S. (2002) · Journal of Neuroscience Research · doi:10.1002/jnr.10417 · Cited by 54
Caspase-8, association with Alzheimer’s Disease and functional analysis of rare variants
Rehker, J., Rodhe, J., Nesbitt, R., Boyle, E. A., Martin, B., Lord, J., Karaca, I., Naj, A. C., Jessen, F., Helisalmi, S., et al. (2017) · PLoS ONE · doi:10.1371/journal.pone.0185777 · Cited by 51
Tissue plasminogen activator arrests Alzheimer's disease pathogenesis
Oh, S. B., Byun, C. J., Yun, J.-H., Jo, D., Carmeliet, P., Koh, J., & Lee, J. (2013) · Neurobiology of Aging · doi:10.1016/j.neurobiolaging.2013.09.020 · Cited by 47
Self-citationPedrini, S., Gupta, V. B., Hone, E., Doecke, J. D., O’Bryant, S. E., JAMES, I. R., Bush, A. I., Rowe, C. C., Villemagne, V. L., Ames, D. J., et al. (2017) · Scientific Reports · doi:10.1038/s41598-017-14020-9 · Cited by 33
Niekisch, H., Steinhardt, J., Berghäuser, J., Bertazzoni, S., Kaschinski, E., Kasper, J., Kisse, M., Mitlöhner, J., Singh, J. B., Weber, J., et al. (2019) · The Journal of Neuroscience · doi:10.1523/jneurosci.2499-18.2019 · Cited by 22
Knopman, D. S., Siemers, E., Bain, L. J., Hendrix, J. A., & Carrillo, M. C. (2018) · Alzheimer s & Dementia · doi:10.1016/j.jalz.2018.01.001 · Cited by 9
Serum level of MMP-2, MMP-9 and Ox-LDL in Alzheimer's disease with hyperlipoidemia
Cai, Z., Yan, Y., Yan, L., Wang, F., Huang, H., Wang, Y.-L., & Zhao, Y. C. (2007) · 中国人民解放军军医大学学报:英文版 · doi:10.1016/s1000-1948(08)60017-9 · Cited by 8
Research works printed but not linked: 1
- Alzheimer's Association, 2017. 2017 Alzheimer's disease facts and figures. Alzheimer’s & Dementia. Elsevier; 2017; 13(4): 325-373
Cited by
Sorted by citations
Wik, L., Nordberg, N., Broberg, J., Björkesten, J., Assarsson, E., Henriksson, S., Grundberg, I., Pettersson, E., Westerberg, C., Liljeroth, E., et al. (2021) · Molecular & Cellular Proteomics · doi:10.1016/j.mcpro.2021.100168 · Cited by 455
Peripheral and central immune system crosstalk in Alzheimer disease — a research prospectus
Bettcher, B. M., Tansey, M. G., Dorothée, G., & Heneka, M. T. (2021) · Nature Reviews Neurology · doi:10.1038/s41582-021-00549-x · Cited by 427
Plasma proteomic profiles predict future dementia in healthy adults
Guo, Y., You, J., Zhang, Y., Liu, W., Huang, Y., Zhang, Y.-R., Zhang, W., Dong, Q., Feng, J., Cheng, W., et al. (2024) · Nature Aging · doi:10.1038/s43587-023-00565-0 · Cited by 327
Advances in the development of new biomarkers for Alzheimer’s disease
Klyucherev, T. O., Olszewski, P., Shalimova, A. A., Chubarev, V. N., Tarasov, V. V., Attwood, M. M., Syvänen, S., & Schiöth, H. B. (2022) · Translational Neurodegeneration · doi:10.1186/s40035-022-00296-z · Cited by 241
Herdy, J. R., Traxler, L., Agarwal, R. K., Karbacher, L., Schlachetzki, J. C. M., Boehnke, L., Zangwill, D., Galasko, D., Glass, C. K., Mertens, J., et al. (2022) · Cell Stem Cell · doi:10.1016/j.stem.2022.11.010 · Cited by 208
Metadata
- Authors
- Whelan, C. D., Mattsson, N., Nagle, M. W., Vijayaraghavan, S., Hyde, C., Janelidze, S., Stomrud, E., Lee, J., Fitz, L., Samad, T. A., Ramaswamy, G., Margolin, R. A., Malarstig, A., & Hansson, O.
- Affiliations
- Biogen (United States) (US)
- Lund University (SE)
- Pfizer (United States) (US)
- Karolinska Institutet (SE)
- Sanofi (United States) (US)
- Corresponding author
- Hansson, Oskar
- ORCID
- Venue
- Acta Neuropathologica Communications
- Published
- 2019-11-06
- Volume
- 7
- Issue
- 1
- Pages
- 169-169
- ISSN
- 2051-5960 (ISSN-L)
- PMC
- PMC6836495
- OpenAlex
- W2985460727
- Cited by
- 262
- References
- 62
- Citations by year
- 2026: 29 · 2025: 38 · 2024: 50 · 2023: 42 · 2022: 46 · 2021: 39 · 2020: 18
- FWCI
- 20.28
- Type
- journal article
- Language
- en
- Open access
- gold
- doi.org
- Locations
- Acta Neuropathologica Communications (publishedVersion, cc-by)
- PubMed Central (publishedVersion, cc-by)
- PubMed (publishedVersion)
- DOAJ (DOAJ: Directory of Open Access Journals) (submittedVersion, cc-by-sa)
- Funders
- H2020 European Research Council (__)
- Swedish Research Council (___)
- Knut och Alice Wallenbergs Stiftelse (___)
- Marianne and Marcus Wallenberg Foundation (____)
- MultiPark (___)
- Swedish Alzheimer Foundation (__)
- Pfizer (Digital Data Innovation)
- Topics
- Health Sciences › Medicine › Psychiatry and Mental health › Dementia and Cognitive Impairment Research
- Life Sciences › Neuroscience › Cellular and Molecular Neuroscience › Alzheimer's disease research and treatments
- Life Sciences › Neuroscience › Neurology › Neuroinflammation and Neurodegeneration Mechanisms
- Keywords
- Alzheimer's disease, early detection, biomarkers, cerebrospinal fluid protein, plasma proteins, amyloid-beta, mild cognitive impairment, prodromal Alzheimer's disease, CHIT1, SMOC2, MMP-10, CD200, MMP-9, uPA, tissue plasminogen activator, OSM, AXIN1, 4E-BP1
- MeSH terms
- Aged, Alzheimer Disease, Female, Humans, Immunoassay, Male, Middle Aged, Cohort Studies, Amyloid beta-Peptides, Proteomics
About these checks
Registry, retraction, Cites and statistics results are computed, not judged, with one exception: a printed reference that no index lists is read once by a model before it counts as a citation error. Claims are extracted by a model and kept only when their quote appears verbatim in the text; each cited source is then checked, with a model’s help, for whether it says what the claim relies on. Those verdicts can be wrong — read the claim’s quote and the cited source before relying on one.
Statistics and arithmetic are recomputed, not judged.
Confidence bands are shown only for fields calibrated on our annotated test set. None is calibrated yet, so no band is shown.
What counts as a claim ›How we measure confidence ›How we check this ›
Are you an author, or do you see a problem with this page? Request a review
