

The DOI matches its Crossref record; 55 of the 55 references it cites were found in a registry or an index; 9 of the 62 sources its claims cite were checked for support.
Fostering computational thinking through educational robotics: a model for creative computational problem solving
Open accessAbstract
Educational robotics is increasingly used in classrooms to implement activities aimed at fostering the development of students’ computational thinking skills.
Overview
CoChat Summary
TL;DR
The paper proposes the Creative Computational Problem Solving (CCPS) model to guide educational robotics activities for computational thinking and tests it in a Thymio lawnmower mission. With 29 primary students, scheduled blocking/partial blocking of the programming interface reduced the trial-and-error PROG-EVAL loop and promoted more balanced CT phase use.
Key findings
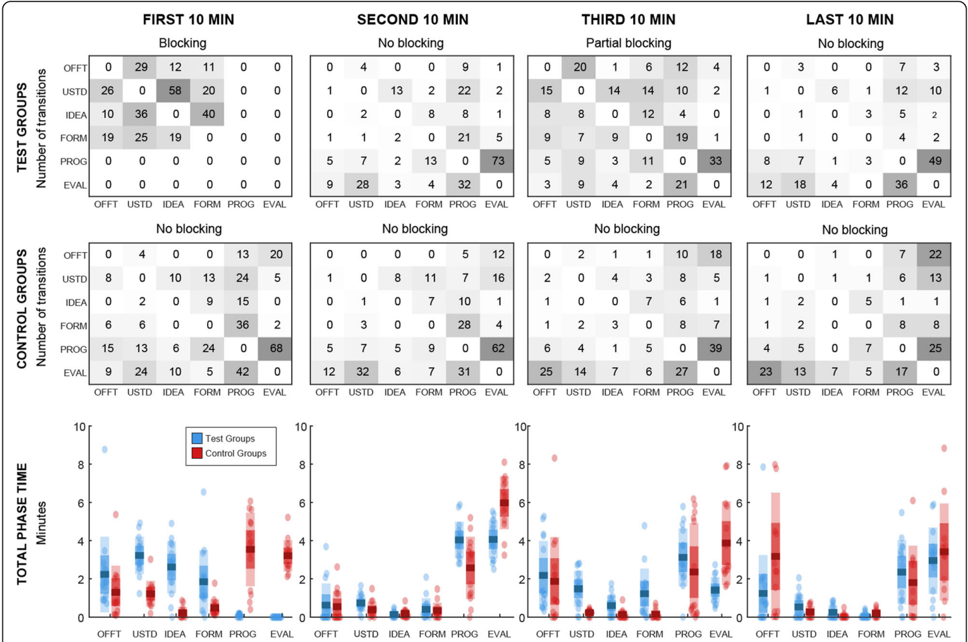
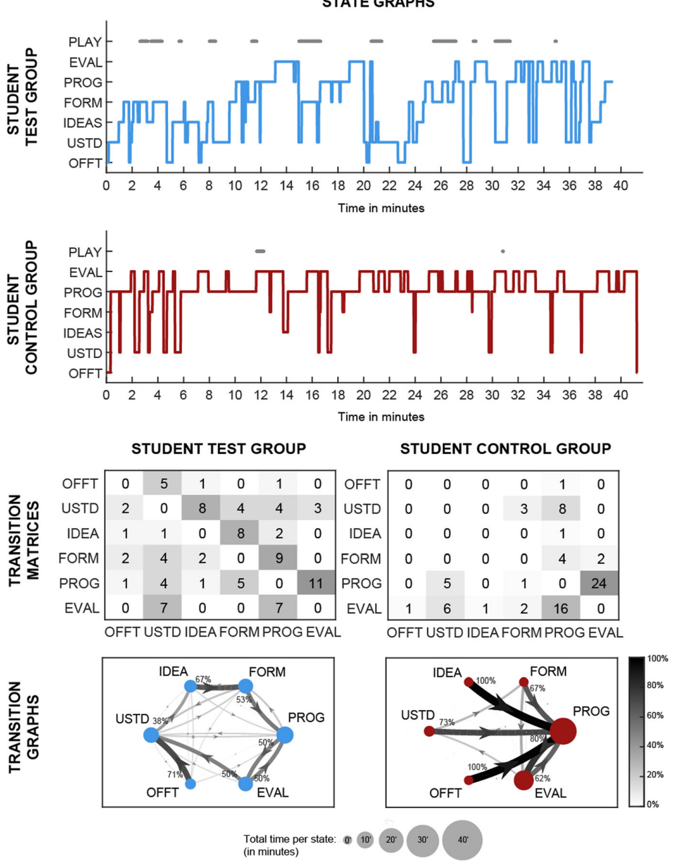
- Control groups with unlimited programming access stayed largely in PROG-EVAL: first three quarters averaged 22/30 min in PROG/EVAL vs. 8/30 min in USTD/IDEA/FORM/OFFT; off-task behavior rose in the last quarter (3/10 min).
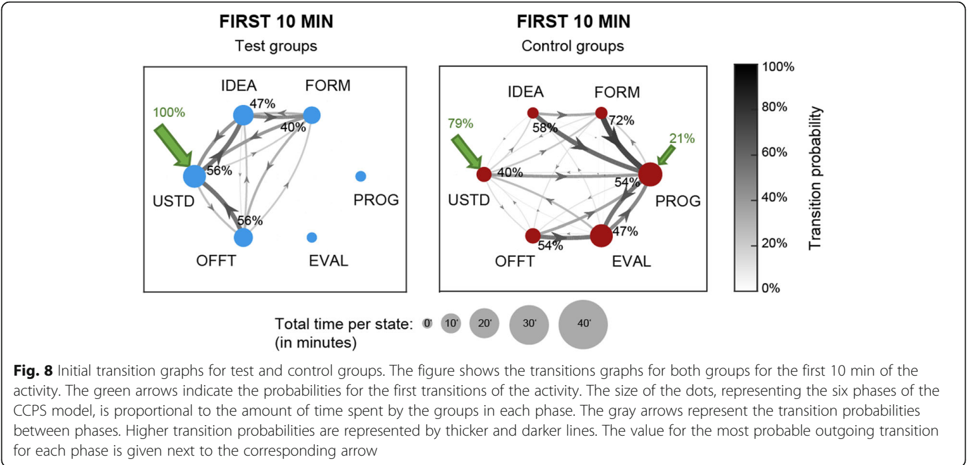
- Test groups with blocking distributed time more evenly: first three quarters averaged 13/30 min in PROG/EVAL and 12/30 min in USTD/IDEA/FORM; all 15 test students started with USTD, and off-task behavior did not increase in the last quarter.
- Partial blocking supported gradual progression and debugging: high PROG-EVAL transitions occurred without executing code; test groups had more playground interactions (93 vs. 59 total).
- Task performance: all five test groups covered at least six lawn squares and two completed all eight; control groups included two that covered only four squares and two that covered six, with one completing all eight.
Methods
- Experimental study with two conditions: control groups had 40 min free access to playground, Thymio, and VPL; test groups had 10 min full VPL blocking, 10 min free, 10 min partial blocking (VPL but no code execution), and 10 min free.
- Sample: 29 primary school students (13 girls, 16 boys, ages 9–10), randomly assigned to groups of 2–3 and to test/control; all had prior Thymio/VPL lessons (1 h/week for 12 weeks).
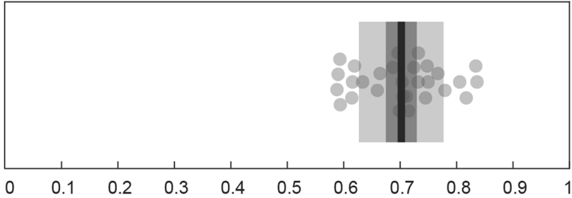
- Video analysis: two independent evaluators mapped behavior to CCPS phases (USTD, IDEA, FORM, PROG, EVAL, OFFT); inter-rater Cohen’s kappa was 0.59 < k < 0.84; 2162 transitions were mapped over 400 min (1072 test, 1090 control), with transition matrices and time-per-phase analyses.
Limitations
- Paper states small sample due to limited classroom access, though 2162 mapped transitions were considered sufficient for model verification; future work should test teacher-perceived value, other intervention hypotheses, and longitudinal learning gains.
- Evident from text: short experimental duration (two 45-min sessions/40-min activity) and no delayed learning-outcome measure beyond lawnmower task performance; findings may be limited to this age group and context (9–10-year-olds in one Swiss canton with prior Thymio/VPL experience).
- Evident from text: behavioral coding relies on evaluator interpretation despite substantial agreement; data are not publicly available due to sensitivity of under-age participants’ data.
Model-written summary. Check it against the paper before relying on it.
Integrity signals
Registry
Cites
Statistics
Figures
Verification
Claims the paper makes
9 Valid · 2 Not valid · 27 Not checked · 104 Own results and interpretations
The cited sources support only part of this claim — read each source’s verdict below.
In the paper
“The programming activity is thus not the only one that is important for CT skills development.Instead, evaluating (i.e., testing and observing) can be considered equally important.”
§ Fostering computational thinking through educational robotics: a model for creative computational problem solving > CT development with ER is more than just programming a robot
What the sources say
- Partly supportedcites Romero et al., 2017 sourceExperimental — accuracy not yet measured
The ‘Computational thinking components within the #5c21’ section treats programming and evaluation as separate components of computational thinking, and ‘From code writing to creative programming’ describes testing models. The paper does not say that evaluation is equally important to programming for CT development or specifically equate evaluation with ‘testing and observing.’ (LLM, conf=0.78)
plain- Asserted: passes — The authors put it forward as true.
- Checkable: passes — It can be checked against evidence.
- Load-bearing: passes — The paper’s conclusions depend on it.
- Based: passes — The paper gives a reason why it holds.
- Partly supported
The sources with a verdict support this claim; the rest weren’t checked yet, have no full text we could read, or their verdicts aren’t rated yet.
In the paper
“In many different learning situations, however, researchers have shown that a pure trial-and-error-approach may limit skill development (Antle, 2013;Sadik, Leftwich, & Nadiruzzaman, 2017;Tsai, Hsu, & Tsai, 2012).”
§ Fostering computational thinking through educational robotics: a model for creative computational problem solving > CT development with ER is more than just programming a robot
What the sources say
- Supportedcites Antle, 2013 source
The Recommendations for design (section 8) say that a static trial-and-error approach may support task completion but not skills development. This directly supports the hedged claim. (LLM, conf=0.92)
- Not checked — no full text of the sourcecites Sadik, Leftwich, & Nadiruzzaman, 2017 source
- Not checked — no full text of the sourcecites Tsai, Hsu, & Tsai, 2012 source
hedgedstates a possible cause- Asserted: passes — The authors put it forward as true.
- Checkable: passes — It can be checked against evidence.
- Load-bearing: passes — The paper’s conclusions depend on it.
- Based: passes — The paper gives a reason why it holds.
- Supported
The cited sources support only part of this claim — read each source’s verdict below.
In the paper
“The latest meta-analyses carried out on ER and CT (Hsu, Chang, & Hung, 2018;Jung & Won, 2018;Shute et al., 2017) have mentioned only four works between 2006 and 2018 that elaborated how ER activities should be implemented in order to foster CT skills in K-5 education (particularly for grades 3 and 4, i.e., for students of age between 8 and 10 years old).”
§ Fostering computational thinking through educational robotics: a model for creative computational problem solving > Introduction
What the sources say
- Not checked — no full text of the sourcecites Hsu, Chang, & Hung, 2018 source
- Partly supportedcites Jung & Won, 2018 sourceExperimental — accuracy not yet measured
Section 3.2.1 (p. 8) reports that kindergarten children learned computational-thinking concepts through robotics, supporting the general connection between educational robotics and computational thinking. It does not say that only four works from 2006–2018 described how to implement such activities for grades 3–4; the review mainly targets preschool and kindergarten children (Data Collection, p. 2). (LLM, conf=0.84)
- Not checked — no full text of the sourcecites Shute et al., 2017 source
plain- Asserted: passes — The authors put it forward as true.
- Checkable: passes — It can be checked against evidence.
- Load-bearing: passes — The paper’s conclusions depend on it.
- Based: passes — The paper gives a reason why it holds.
A result the paper reports from its own data — it cites no other source for it, so there is none to check. The quote shows it is in the paper.
In the paper
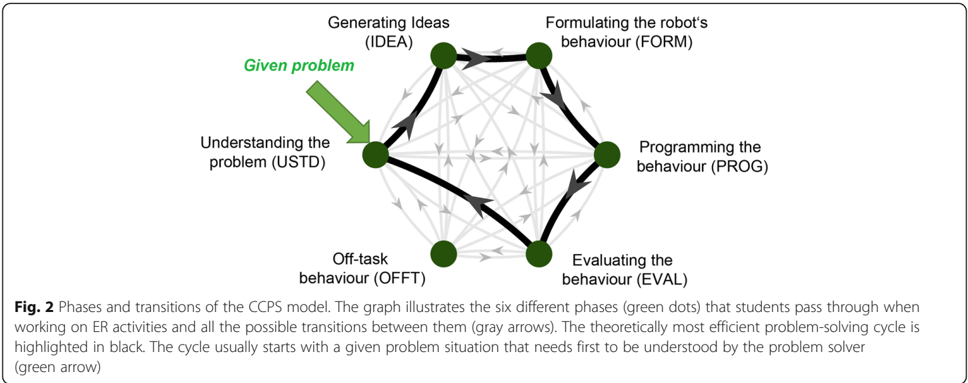
“This phase was not considered a priori, however, the experiments with students showed that offtask behavior is part of the reality in classrooms and should therefore be included in the model.”
§ Fostering computational thinking through educational robotics: a model for creative computational problem solving > Formulating the behavior (FORM)
plain- Asserted: passes — The authors put it forward as true.
- Checkable: passes — It can be checked against evidence.
- Load-bearing: passes — The paper’s conclusions depend on it.
- Based: passes — The paper gives a reason why it holds.
A result the paper reports from its own data — it cites no other source for it, so there is none to check. The quote shows it is in the paper.
In the paper
“The results suggest that (i) a non-instructional approach for educational robotics activities (i.e., unlimited access to the programming interface) promotes a trial-and-error behavior;”
§ Fostering computational thinking through educational robotics: a model for creative computational problem solving > Abstract
hedgedstates a cause- Asserted: passes — The authors put it forward as true.
- Checkable: passes — It can be checked against evidence.
- Load-bearing: passes — The paper’s conclusions depend on it.
- Based: passes — The paper gives a reason why it holds.
63 more claims
Create a free account to see all 142 claims and to verify the 1 reference still open.
- Probably not a substantial claim. 49
- It may state two separate claims as one. 39
- The quote only partly states this claim. 3
Self-check
Percentages, sums and reported differences re-computed from the paper’s own numbers.
Each contradiction between two passages listed here was confirmed by an independent check.
Rated minor: it would not touch a result — a value no result rests on, a p-value that stays on the same side of the significance level, or a conflict that is clerical, resolved elsewhere in the paper, or outside its own findings.
In the paper
§ Fostering computational thinking through educational robotics: a model for creative computational problem solving > Limitations and future work
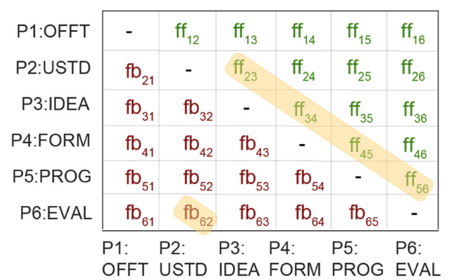
“The theoretically most efficient problemsolving cycle is highlighted in yellow (ff 23 -ff 34 -ff 45 -ff 56 -ff 62 )”
§ Fostering computational thinking through educational robotics: a model for creative computational problem solving > Formulating the behavior (FORM)
“In this model, special emphasis is therefore placed on the cycle considering the transitions ff 23 -ff 34ff 45 -ff 56 -fb 62 (highlighted in yellow in Fig. 3)”
Citations
Cites
The Measurement of Observer Agreement for Categorical Data
Landis, J. R., & Koch, G. G. (1977) · Biometrics · doi:10.2307/2529310 · Cited by 81,148
Wing, J. M. (2006) · Communications of the ACM · doi:10.1145/1118178.1118215 · Cited by 8,102
Observing Interaction: An Introduction to Sequential Analysis
Willson, V. L., Bakeman, R., & Gottman, J. M. (1988) · Journal of Educational Statistics · doi:10.2307/1164658 · Cited by 2,301
Barr, V., & Stephenson, C. (2011) · ACM Inroads · doi:10.1145/1929887.1929905 · Cited by 1,692
Defining Computational Thinking for Mathematics and Science Classrooms
Weintrop, D., Beheshti, E., Horn, M., Orton, K., Jona, K., Trouille, L., & Wilensky, U. (2016) · Journal of Science Education and Technology · doi:10.1007/s10956-015-9581-5 · Cited by 1,609
Demystifying computational thinking
Shute, V. J., Sun, C., & Asbell-Clarke, J. (2017) · Educational Research Review · doi:10.1016/j.edurev.2017.09.003 · Cited by 1,466
Observing Interaction: An Introduction to Sequential Analysis
Bakeman, R., & Gottman, J. M. (1997) · doi:10.1017/cbo9780511527685 · Cited by 1,439
Computational thinking and tinkering: Exploration of an early childhood robotics curriculum
Bers, M. U., Flannery, L., Kazakoff, E. R., & Sullivan, A. (2014) · Computers & Education · doi:10.1016/j.compedu.2013.10.020 · Cited by 959
Hsu, T.-C., Chang, S.-C., & Hung, Y.-T. (2018) · Computers & Education · doi:10.1016/j.compedu.2018.07.004 · Cited by 788
Atmatzidou, S., & Demetriadis, S. (2016) · Robotics and Autonomous Systems · doi:10.1016/j.robot.2015.10.008 · Cited by 630
Research works printed but not linked: 2
- Eguchi, A. (2014). Robotics as a learning tool for educational transformation. In D. Alimisis, G. Granosik, & M. Moro (Eds.), 4th International Workshop Teaching Robotics, Teaching with Robotics & 5th International Conference Robotics in Education, (pp. 27–34). Padova: RIE ISBN 978-88-95872-06-3. Available at http://www.terecop.eu/TRTWR-RIE2014/files/00_WFr1/00_WFr1_04.pdf. Accessed 6 June 2020.
- Papert, S. (1980). Mindstorms: Computers, children, and powerful ideas. New York: Basic Books.
Cited by
On Computational Thinking and STEM Education
Li, Y., Schoenfeld, A. H., diSessa, A. A., Graesser, A. C., Benson, L. C., English, L. D., & Duschl, R. A. (2020) · Journal for STEM Education Research · doi:10.1007/s41979-020-00044-w · Cited by 184
“Thus, some researchers proposed alternative approaches to develop problem-solving-oriented CT such as, “ systematic CT ” (Michaelson 2018) and “ creative computational problem solving ” (Chevalier et al. 2020).”
BackgroundSun, D., Boudouaia, A., Zhu, C., & Li, Y. (2024) · International Journal of Educational Technology in Higher Education · doi:10.1186/s41239-024-00446-5 · Cited by 190
Yang, Q.-F., Lian, L.-W., & Zhao, J.-H. (2023) · International Journal of Educational Technology in Higher Education · doi:10.1186/s41239-023-00391-9 · Cited by 152
Chen, P., Yang, D., Metwally, A. H. S., Lavonen, J., & Wang, X. (2023) · International Journal of STEM Education · doi:10.1186/s40594-023-00434-7 · Cited by 275
“Therefore, tangible materials should be used to cultivate CT and problem-solving skills (Chevalier et al., 2020).”
BackgroundEducational Robotics for Developing Computational Thinking in Young Learners: A Systematic Review
Ching, Y., & Hsu, Y. (2023) · TechTrends · doi:10.1007/s11528-023-00841-1 · Cited by 194
“Only a handful of studies (e.g., Baek et al., 2019; Chevalier et al., 2020; Chiazzese et al., 2019; Shen et al., 2022) adopted a more macro view and measured CT in terms of a set of problem-solving processes such as understanding the problem, generating ideas, formulating the behavior, programming…”
Influential
Metadata
- Authors
- Chevalier, M., Giang, C., Piatti, A., & Mondada, F.
- Affiliations
- Haute École Pédagogique du Canton de Vaud (CH)
- University of Applied Sciences and Arts of Southern Switzerland (CH)
- Corresponding author
- Chevalier, Morgane
- Venue
- International Journal of STEM Education
- Published
- 2020-08-03
- Volume
- 7
- Issue
- 1
- ISSN
- 2196-7822 (ISSN-L)
- OpenAlex
- W3046440829
- Cited by
- 223
- References
- 55
- Citations by year
- 2026: 36 · 2025: 37 · 2024: 47 · 2023: 41 · 2022: 36 · 2021: 25 · 2020: 1
- FWCI
- 23.95
- Type
- journal article
- Language
- en
- Open access
- gold
- doi.org
- Licence
- cc-by
- creativecommons.org/licenses/by/4.0 (tdm)
- creativecommons.org/licenses/by/4.0 (vor)
- Locations
- International Journal of STEM Education (publishedVersion, cc-by)
- DOAJ (DOAJ: Directory of Open Access Journals) (submittedVersion, cc-by-sa)
- Infoscience (Ecole Polytechnique Fédérale de Lausanne) (submittedVersion, cc-by-nc-nd)
- Funders
- National Centre of Competence in Research Robotics (51NF40-185543)
- Topics
- Physical Sciences › Computer Science › Computer Science Applications › Teaching and Learning Programming
- Social Sciences › Education › Educational Robotics and Engineering
- Physical Sciences › Engineering › Mechanical Engineering › Design Education and Practice
- Keywords
- educational robotics, computational thinking, teaching model, scaffolding, elementary school students, creative problem solving, problem understanding, idea generation, solution formulation
About these checks
Registry, retraction, Cites and statistics results are computed, not judged, with one exception: a printed reference that no index lists is read once by a model before it counts as a citation error. Claims are extracted by a model and kept only when their quote appears verbatim in the text; each cited source is then checked, with a model’s help, for whether it says what the claim relies on. Those verdicts can be wrong — read the claim’s quote and the cited source before relying on one.
The claim verdicts this report counts are experimental: their accuracy is not yet measured.
A language model drew the claims from the paper on 2026-10-10, under version 3 of the claim definition (model deepseek-v4.1-flash, prompt extract-v3).
A second model labelled each claim on 2026-10-10 (model jev-1.13-20260917, definition revision gold-guideline-v0.2).
Cited sources are checked with a language model’s help (gpt-6-sol).
Statistics and arithmetic are recomputed, not judged.
Confidence bands are shown only for fields calibrated on our annotated test set. None is calibrated yet, so no band is shown.
What counts as a claim ›How we measure confidence ›How we check this ›
Are you an author, or do you see a problem with this page? Request a review
How to cite
Cite CoChat for the checks on this page, and the paper for its own findings.
- This page
- CoChat. (2026). Citation check: Fostering computational thinking through educational robotics: a model for creative computational problem solving. https://app.cochat.ai/papers/10.1186/s40594-020-00238-z
- The paper
- Chevalier, M., Giang, C., Piatti, A., & Mondada, F. (2020). Fostering computational thinking through educational robotics: a model for creative computational problem solving. International Journal of STEM Education. https://doi.org/10.1186/s40594-020-00238-z
Data sources
Bibliographic data: Semantic Scholar, OpenAlex, Crossref.
Contains information from the Semantic Scholar Academic Graph Datasets, made available under the ODC Attribution License (ODC-BY 1.0).
Semantic Scholar’s data is described in: Kinney, R., et al. (2023). The Semantic Scholar Open Data Platform. arXiv:2301.10140.
