

The DOI matches its Crossref record; 195 of the 198 references it cites were found in a registry or an index, and 1 are not checked yet.
Clinical applications of fundus autofluorescence in retinal disease
Open accessAbstract
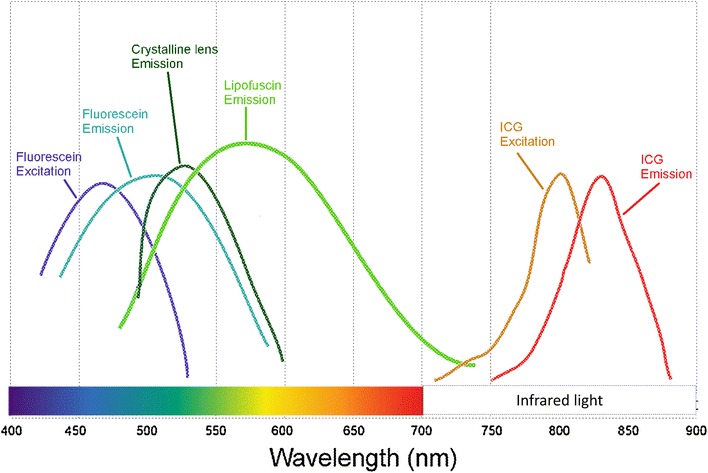
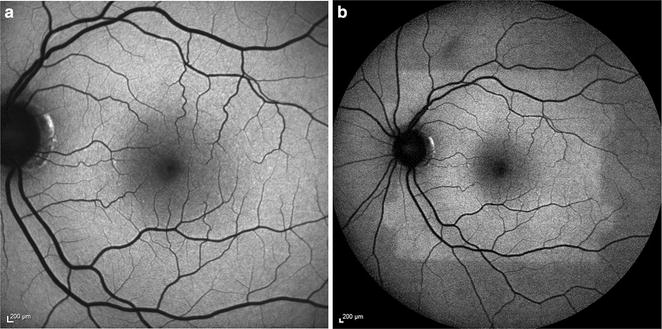
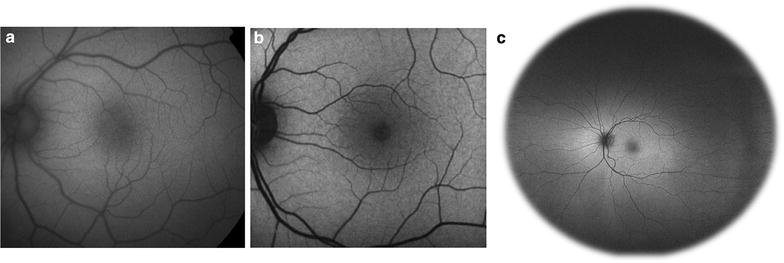
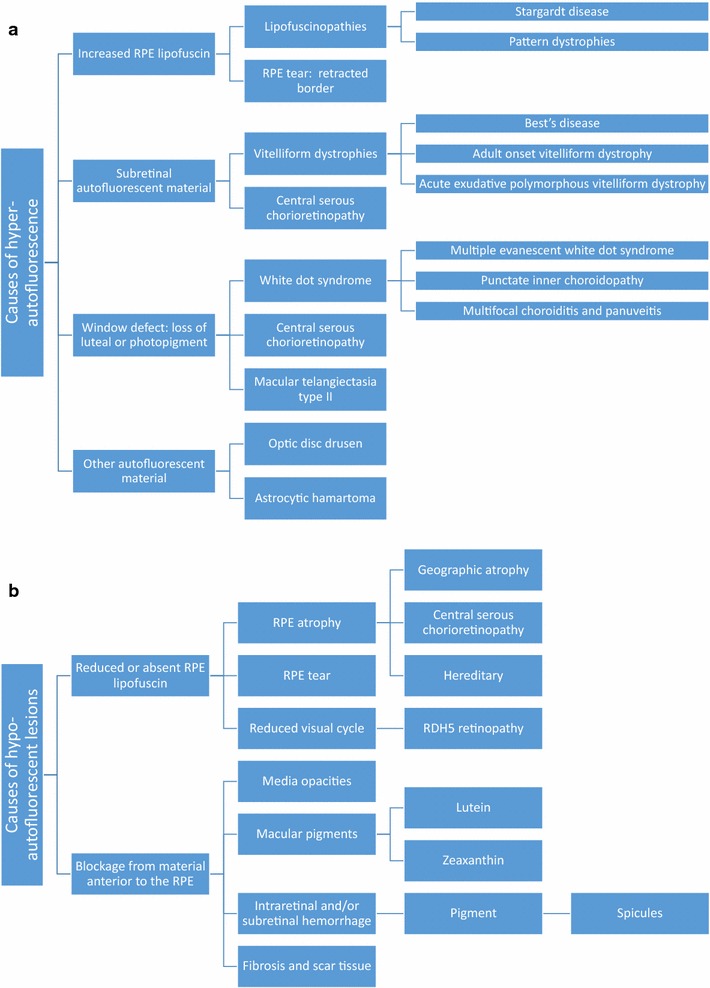
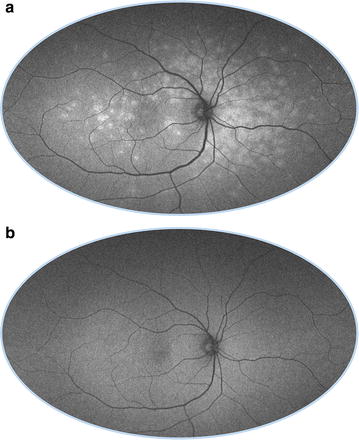
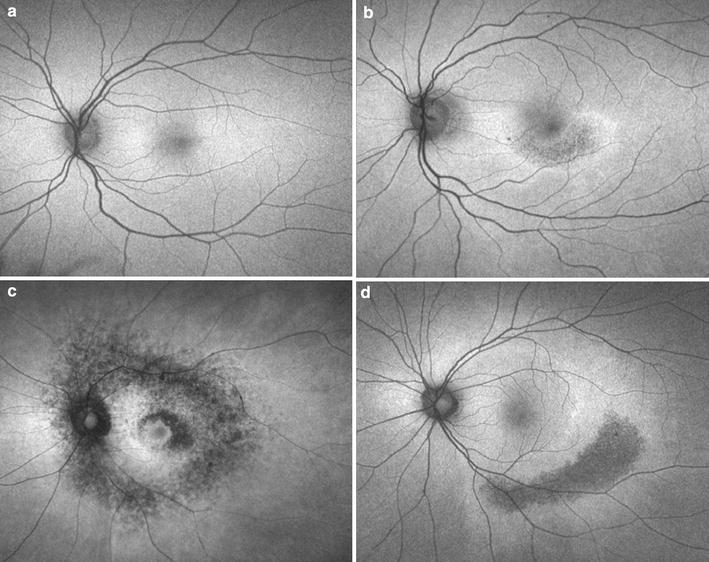
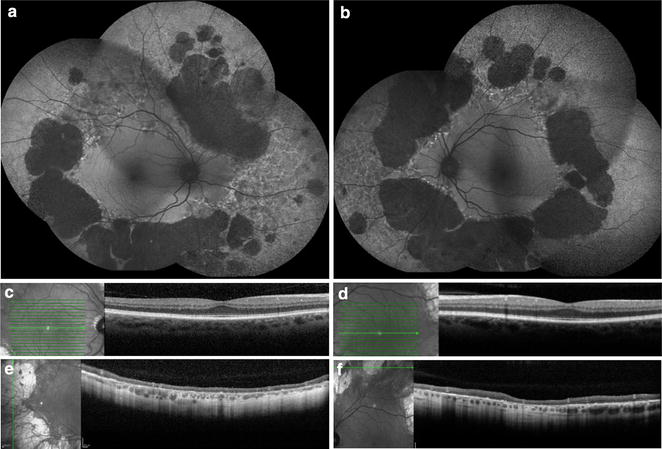
Fundus autofluorescence (FAF) is a non-invasive retinal imaging modality used in clinical practice to provide a density map of lipofuscin, the predominant ocular fluorophore, in the retinal pigment epithelium. Multiple commercially available imaging systems, including the fundus camera, the confocal scanning laser ophthalmoscope, and the ultra-widefield imaging device, are available to the clinician. Each offers unique advantages for evaluating various retinal diseases. The clinical applications of FAF continue to expand. It is now an essential tool for evaluating age related macular degeneration, macular dystrophies, retinitis pigmentosa, white dot syndromes, retinal drug toxicities, and various other retinal disorders. FAF may detect abnormalities beyond those detected on funduscopic exam, fluorescein angiography, or optical coherence tomography, and can be used to elucidate disease pathogenesis, form genotype-phenotype correlations, diagnose and monitor disease, and evaluate novel therapies. Given its ease of use, non-invasive nature, and value in characterizing retinal disease, FAF enjoys increasing clinical relevance. This review summarizes common ocular fluorophores, imaging modalities, and FAF findings for a wide spectrum of retinal disorders.
Overview
The claims and statistics of this paper haven’t been checked yet.
Run the check — free, no account needed. It reads the open-access text and checks the sources it cites.
Integrity signals
Registry
Cites
Statistics
Figures
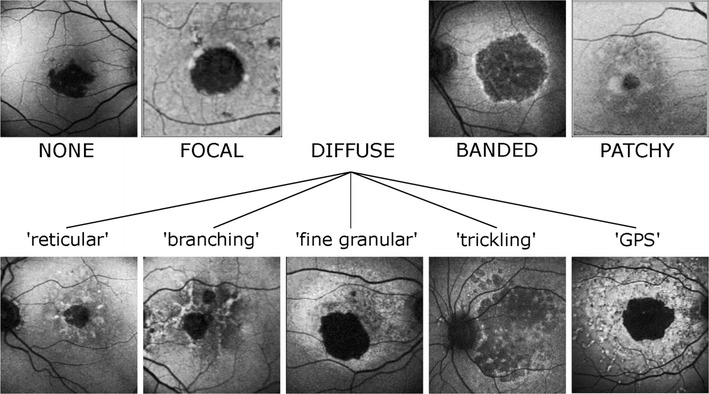
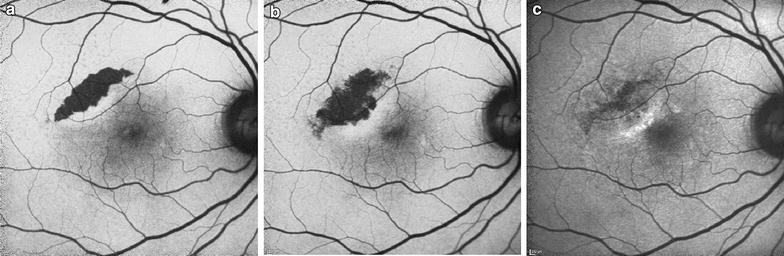
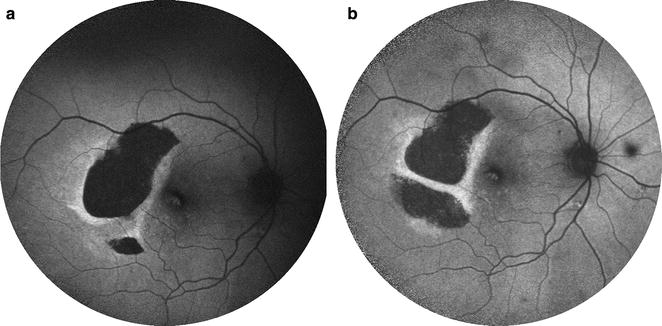
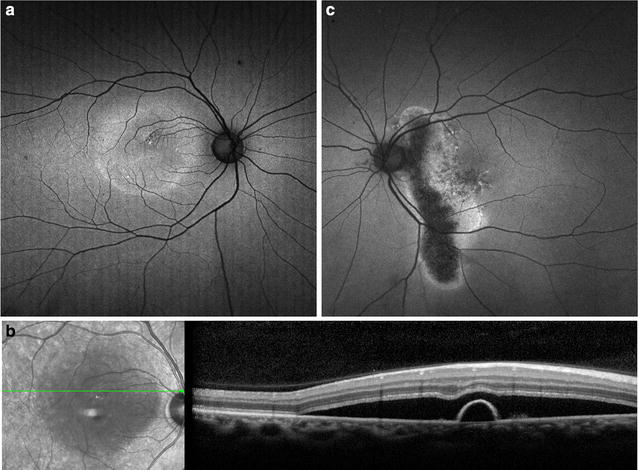
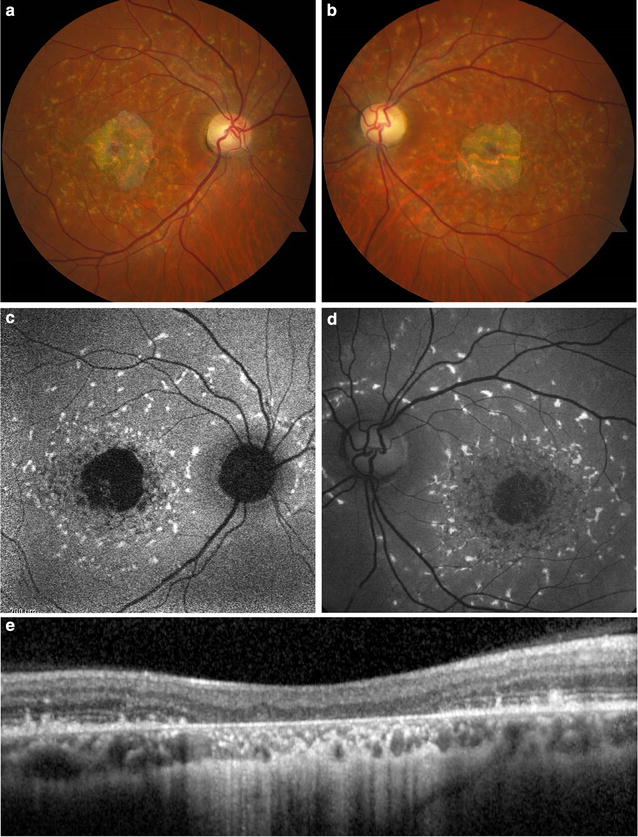
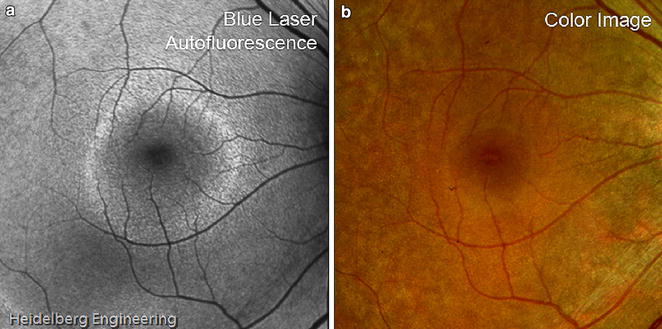
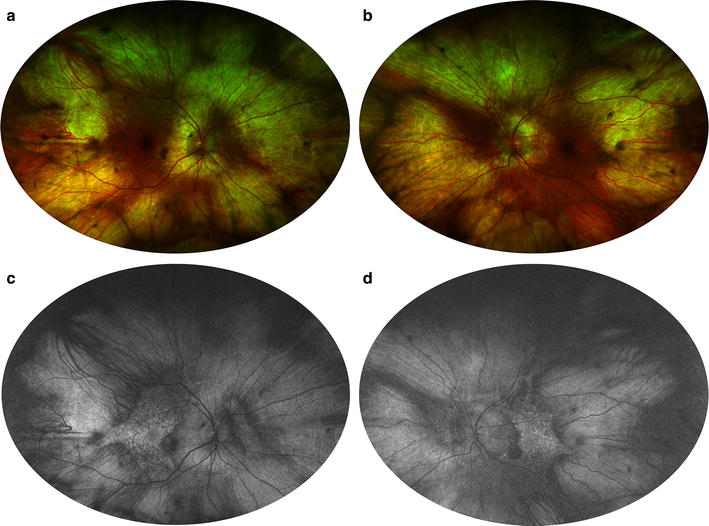
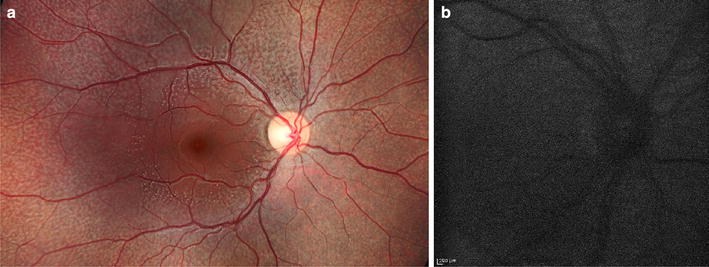
Verification
Claims the paper makes
The claims and statistics of this paper haven’t been checked yet.
Run the check — free, no account needed. It reads the open-access text and checks the sources it cites.
Claims other papers make about this one
Each is checked against this paper’s own text: does it say what the citing paper says it does?
The source backs part of the claim, not all of it — or backs it for a different population, condition or comparison.
In the citing paper
“As A2E can not be further metabolized and as RPE cells are postmitotic, A2E and related bisretinoids accumulate in the RPE in the form of lipofuscin deposits.”
From The Role of Vitamin A in Retinal Diseases (2022) · cites this paper as [75]
Experimental — accuracy not yet measuredThe source backs part of the claim, not all of it — or backs it for a different population, condition or comparison.
In the citing paper
“Although abundant lipofuscin accumulation is involved in the aetiology of certain retinal diseases (e.g., AMD, Best disease and ABCA4-retinopathy), it accumulates at a lower level also with age in the RPE of healthy eyes [9,72,73,74,75].”
From The Role of Vitamin A in Retinal Diseases (2022) · cites this paper as [75]
Experimental — accuracy not yet measuredThe source backs part of the claim, not all of it — or backs it for a different population, condition or comparison.
In the citing paper
“Lipofuscin is an autofluorescent cellular waste product that compromises the function and viability of RPE cells and ultimately results in photoreceptor degeneration and a loss of vision [54,69,73,74,75].”
From The Role of Vitamin A in Retinal Diseases (2022) · cites this paper as [75]
Experimental — accuracy not yet measured
Self-check
Percentages, sums and reported differences re-computed from the paper’s own numbers.
The self-check needs the paper’s full text.
Citations
Cites
Clinical Classification of Age-related Macular Degeneration
Ferris, F. L., Wilkinson, C. P., Bird, A. C., Chakravarthy, U., Chew, E. Y., Csaky, K. G., & Sadda, S. R. (2013) · Ophthalmology · doi:10.1016/j.ophtha.2012.10.036 · Cited by 1,868
Stereoscopic Atlas of Macular Diseases: Diagnosis and Treatment
(1990) · Archives of Ophthalmology · doi:10.1001/archopht.1990.01070060042026 · Cited by 1,014
Delori, F. C., Dorey, C. K., Staurenghi, G., Arend, O., Goger, D. G., & Weiter, J. J. (1995) · PubMed · Cited by 938
Revised Recommendations on Screening for Chloroquine and Hydroxychloroquine Retinopathy
Marmor, M. F., Kellner, U., Lai, T. Y. Y., Lyons, J. S., & Mieler, W. F. (2011) · Ophthalmology · doi:10.1016/j.ophtha.2010.11.017 · Cited by 703
Holz, F. G., Bindewald-Wittich, A., Fleckenstein, M., Dreyhaupt, J., Scholl, H. P. N., & Schmitz-Valckenberg, S. (2007) · American Journal of Ophthalmology · doi:10.1016/j.ajo.2006.11.041 · Cited by 619
Sparrow, J. R., Nakanishi, K., & Parish, C. A. (2000) · PubMed · Cited by 566
Retinal pigment epithelial lipofuscin and melanin and choroidal melanin in human eyes.
Weiter, J. J., Delori, F. C., Wing, G. L., & Fitch, K. A. (1986) · PubMed · Cited by 565
Aging human RPE: morphometric analysis of macular, equatorial, and peripheral cells.
Feeney-Burns, L., Hilderbrand, E. S., & Eldridge, S. (1984) · PubMed · Cited by 561
RPE65 is the isomerohydrolase in the retinoid visual cycle
Moiseyev, G., Chen, Y., Takahashi, Y., Wu, B. X., & Ma, J.-X. (2005) · Proceedings of the National Academy of Sciences · doi:10.1073/pnas.0503460102 · Cited by 536
Prevalence of Age-Related Macular Degeneration in the US Population
Klein, R. (2011) · Archives of Ophthalmology · doi:10.1001/archophthalmol.2010.318 · Cited by 523
Research works printed but not linked: 2
- Park SP, Siringo FS, Pensec N, et al. Comparison of fundus autofluorescence between fundus camera and confocal scanning laser ophthalmoscope-based systems. Ophthalmic Surgery Lasers Imaging Retina. 2013;44(6):536–43. · DOI
- Espina M, Barteselli G, Ma F, et al. Noncontact ultra-wide field lens system by Heidelberg spectralis. Invest Ophthalmol Vis Sci. 2014;55(13):1615.
Cited by
Sorted by citations
Items 101–200 of 236
Peripheral Manifestations in Age Related Macular Degeneration: A Review of Imaging and Findings
Pivovar, A., & Oellers, P. R. (2021) · Journal of Clinical Medicine · doi:10.3390/jcm10173993 · Cited by 8
Krytkowska, E., Olejnik-Wojciechowska, J., Grabowicz, A., Safranow, K., & Machalińska, A. (2023) · Journal of Clinical Medicine · doi:10.3390/jcm12247728 · Cited by 7
The march to harmonized imaging standards for retinal imaging
Gim, N., Ferguson, A. N., Blazes, M. S., Lee, C. S., & Lee, A. (2025) · Progress in Retinal and Eye Research · doi:10.1016/j.preteyeres.2025.101363 · Cited by 9
Autofluorescence of choroidal vessels in Bietti’s crystalline dystrophy
Ameri, H., Su, E. H., & Dowd-Schoeman, T. J. (2020) · BMJ Open Ophthalmology · doi:10.1136/bmjophth-2020-000592 · Cited by 7
Model Structure Uncertainty in the Characterization and Growth of Geographic Atrophy
Arslan, J., Benke, K. K., Samarasinghe, G., Sowmya, A., Guymer, R. H., & Baird, P. N. (2021) · Translational Vision Science & Technology · doi:10.1167/tvst.10.6.2 · Cited by 7
Al‐Khuzaei, S., Shah, M., Foster, C. R., Yu, J., Broadgate, S., Halford, S., & Downes, S. M. (2021) · Therapeutic Advances in Ophthalmology · doi:10.1177/25158414211056384 · Cited by 7
Giansanti, F., Mercuri, S., Vannozzi, L., Govetto, A., Minnella, A. M., Caporossi, T., Savastano, A., Savastano, M. C., Gambini, G., Rizzo, S., et al. (2022) · Life · doi:10.3390/life12091361 · Cited by 7
Chen, Q., Zhang, T., Chen, Z., Zeng, J., O’Connor, A., Zhu, M., Gillies, M. C., Lu, F., & Zhu, L. (2025) · Biomolecules · doi:10.3390/biom15081167 · Cited by 6
Chandran, K., Anantharaman, G., Desai, S., Gopalakrishnan, M., Indu, V., & Sivaprasad, S. (2023) · Indian Journal of Ophthalmology · doi:10.4103/ijo.ijo_78_23 · Cited by 6
Ramakrishnan, M. S., Kovach, J. L., Wykoff, C. C., Berrocal, A. M., & Modi, Y. S. (2024) · Journal of VitreoRetinal Diseases · doi:10.1177/24741264241237012 · Cited by 6
Lee, D. M. W., Zhang, M., Snyder, V. C., & Rossi, E. A. (2024) · Scientific Reports · doi:10.1038/s41598-024-81433-8 · Cited by 6
Deitch, I., Ferenchak, K., & Miller, J. B. (2021) · Seminars in Ophthalmology · doi:10.1080/08820538.2021.1908570 · Cited by 6
A model eye for fluorescent characterization of retinal cultures and tissues
Ferraro, G., Gigante, Y., Pitea, M., Mautone, L., Ruocco, G., Angelantonio, S. D., & Leonetti, M. (2023) · Scientific Reports · doi:10.1038/s41598-023-37806-6 · Cited by 6
BULL'S EYE MACULOPATHY WITH MUTATIONS IN RDS/PRPH2 AND ROM-1
Essilfie, J. O., Sanfilippo, C. J., & Sarraf, D. (2017) · Retinal Cases & Brief Reports · doi:10.1097/icb.0000000000000669 · Cited by 6
Self-citationHussnain, S. A., Dolz‐Marco, R., Dunaief, J. L., Curcio, C. A., & Freund, K. B. (2018) · Retina · doi:10.1097/iae.0000000000002367 · Cited by 6
Management of Diabetic Eye Disease Using Carotenoids and Nutrients
Lem, D. W., Gierhart, D. L., & Davey, P. G. (2021) · IntechOpen eBooks · doi:10.5772/intechopen.96064 · Cited by 6
Applications of Vision Transformers in Retinal Imaging: A Systematic ReviewPreprint
Ye, E. Z., Ye, E. H., & Ye, E. H. (2023) · doi:10.22541/au.167528318.80645903/v1 · Cited by 6
Kim, Y. H., Chung, Y.-R., Oh, J., Kim, S., Lee, C. S., Yun, C., Lee, B., Ahn, S. M., Choi, E. Y., Jang, S., et al. (2021) · Ophthalmic Epidemiology · doi:10.1080/09286586.2021.1872088 · Cited by 5
Wang, L., Shao, J., Chen, S., & Yang, J. (2023) · Frontiers in Bioengineering and Biotechnology · doi:10.3389/fbioe.2023.1133039 · Cited by 5
Lee, J. H., Ahn, J., & Shin, J. Y. (2023) · Graefe s Archive for Clinical and Experimental Ophthalmology · doi:10.1007/s00417-023-06022-3 · Cited by 5
Classification of fundus autofluorescence abnormal patterns in diabetic macular edema
Mota, S. E. H.-D., Lima-Gómez, V., Rodríguez-Ayala, E., Fromow-Guerra, J., & Melo-Granados, E. A. R. (2020) · Gaceta Médica de México · doi:10.24875/gmm.m20000332 · Cited by 5
Early onset of age-related changes in the retina of cystine/glutamate antiporter knockout mice
Martis, R. M., Knight, L. J., Acosta, M. L., Black, J. M., Ng, R. J., Ji, L. C. L., Donaldson, P. J., & Lim, J. C.-H. (2022) · Experimental Eye Research · doi:10.1016/j.exer.2022.109364 · Cited by 5
Mohabati, D., Boon, C. J. F., Hoyng, C. B., Purtskhvanidze, K., Roider, J. B., & van Dijk, E. H. C. (2023) · Graefe s Archive for Clinical and Experimental Ophthalmology · doi:10.1007/s00417-023-06042-z · Cited by 5
Wang, Z., Zhou, J., Hu, X., Ding, J., Zhang, X., Wei, R., 秦秀虹, & Li, Z. (2025) · Frontiers in Medicine · doi:10.3389/fmed.2025.1726962 · Cited by 4
Dinah, C., Enoch, J., Ghulakhszian, A., Sekhon, M., Crabb, D. P., & Taylor, D. J. (2024) · BMJ Open · doi:10.1136/bmjopen-2023-075713 · Cited by 4
Santarossa, M., Beyer, T. T., Scharf, A., Tatli, A., von der Burchard, C. C., Nazarenus, J., Roider, J. B., & Koch, R. (2024) · Journal of Imaging · doi:10.3390/jimaging10050116 · Cited by 4
Özkaya, A., Garip, R., Alkın, Z., & Taşkapılı, M. (2017) · International Journal of Retina and Vitreous · doi:10.1186/s40942-017-0073-z · Cited by 4
Hydroxychloroquine Retinopathy in the Era of Advanced Imaging Modalities
Dahrouj, M., & YOUNG, L. H. Y. (2019) · International Ophthalmology Clinics · doi:10.1097/iio.0000000000000294 · Cited by 4
Mota, S. E. H.-D., Cornejo, F. B., Esquivel‐Velázquez, M., Lima-Gómez, V., González-Saldívar, G., Ayala, E. R., & Vélez-Montoya, R. (2020) · Therapeutic Advances in Ophthalmology · doi:10.1177/2515841420942662 · Cited by 4
Radun, V., Berlin, A., Tarau, I., Kleefeldt, N., Reichel, C., Hillenkamp, J., Holz, F. G., Sloan, K. R., Saßmannshausen, M., & Ach, T. (2023) · Translational Vision Science & Technology · doi:10.1167/tvst.12.7.8 · Cited by 4
Automation of Cluster Extraction in Fundus Autofluorescence Images of Geographic Atrophy
Arslan, J., & Benke, K. K. (2023) · Applied Biosciences · doi:10.3390/applbiosci2030025 · Cited by 4
Nassisi, M., & Sadda, S. R. (2021) · Advances in experimental medicine and biology · doi:10.1007/978-3-030-66014-7_2 · Cited by 4
Milam, R. W., & Daniels, A. B. (2018) · Springer eBooks · doi:10.1007/978-3-319-78310-9_16 · Cited by 4
Retinal autofluorescence findings after COVID-19
Marinho, P. M., Marcos, A. A. A., Branco, A. M. C., Mourad, W. M., Sakamoto, V., Romano, A., Farah, M. E., Rosen, R. B., Schor, P., Abraao, P., et al. (2021) · International Journal of Retina and Vitreous · doi:10.1186/s40942-021-00341-5 · Cited by 4
Pu, J., He, G., Zhang, X., Li, M., Hao, X., Zhuang, X., Su, Y., & Wen, F. (2025) · Photodiagnosis and Photodynamic Therapy · doi:10.1016/j.pdpdt.2025.104595 · Cited by 3
Advances in imaging retinal inflammation
Uddin, M. J. (2025) · Experimental Eye Research · doi:10.1016/j.exer.2025.110537 · Cited by 3
Lack of Pnpla2 Accelerates Progression of AMD-Like Features in Mice
Yang, J., Bernardo‐Colón, A., & Becerra, S. P. (2025) · Investigative Ophthalmology & Visual Science · doi:10.1167/iovs.66.12.11 · Cited by 3
Pseudoretinitis pigmentosa due to syphilis: a case report and literature review
Paiva, A. D. C. M., de Britto, V. S., Criado, G. G., Simões, K. M. P., & Motta, M. M. D. S. (2021) · Revista Brasileira de Oftalmologia · doi:10.37039/1982.8551.20210025 · Cited by 3
Sultan, P., Demir, U., Sonmezay, S. E., & Güngel, H. (2022) · Journal of Binocular Vision and Ocular Motility · doi:10.1080/2576117x.2022.2114385 · Cited by 3
Early Events in Diabetic Retinopathy and Intervention Strategies
Tsin, A. T. C., & Grigsby, J. G. (2018) · InTech eBooks · doi:10.5772/intechopen.69906 · Cited by 3
Peculiar Clinical Findings in Young Choroideremia Patients: A Retrospective Case Review
Mucciolo, D. P., Murro, V., Sodi, A., Passerini, I., Giorgio, D., Virgili, G., & Rizzo, S. (2019) · Ophthalmologica · doi:10.1159/000501282 · Cited by 3
Richardson, Q. R., Zhang, Y., Deiner, M. S., Wang, S. T., Bhisitkul, J. M., Arnold, B. F., & Bhisitkul, R. B. (2022) · Ophthalmic surgery, lasers & imaging retina · doi:10.3928/23258160-20220914-01 · Cited by 2
Zhang, P., Manna, S. K., Goswami, M., Zawadzki, R. J., & Pugh, E. N. (2025) · Investigative Ophthalmology & Visual Science · doi:10.1167/iovs.66.4.29 · Cited by 2
Fundus autofluorescence in detection of embolus in retinal artery occlusion
Sagar, P., Biswal, S., & Ravishankar, H. N. (2022) · Indian Journal of Ophthalmology - Case Reports · doi:10.4103/ijo.ijo_1769_21 · Cited by 2
Health Promotion for AMD and the Role of Nutrition
Martinez, A., Pizzimenti, J. J., Lem, D. W., & Davey, P. G. (2022) · IntechOpen eBooks · doi:10.5772/intechopen.103835 · Cited by 2
Maślanka, R., Przywara, M., Janeczko, A., & Zadrąg‐Tęcza, R. (2023) · International Journal for Vitamin and Nutrition Research · doi:10.1024/0300-9831/a000796 · Cited by 2
Ranetti, A.-E., Stanca, H. T., Munteanu, M., Radulescu, R. B., & Stanca, S. (2025) · Diagnostics · doi:10.3390/diagnostics15131688 · Cited by 2
Manne, S. R., Vupparaboina, K. K., Gudapati, G. C., Peddoju, R. A., Konkimalla, C. P., Bashar, S. B., Goud, A., Chhablani, J. K., & Jana, S. (2021) · IEEE-EMBS International Conference on Biomedical and Health Informatics (BHI ...) · doi:10.1109/bhi50953.2021.9508560 · Cited by 1
Fundusautofluoreszenz: Klinische Anwendung und diagnostische Bedeutung
Bindewald-Wittich, A., & Kellner, U. (2019) · Klinische Monatsblätter für Augenheilkunde · doi:10.1055/a-1090-5733 · Cited by 2
Intraoperative multimodal imaging
Karuna, A., Meyer, T., Schmitt, M. P., & Popp, J. (2022) · Elsevier eBooks · doi:10.1016/b978-0-323-85158-9.00039-7 · Cited by 2
Foveal hypoplasia in a patient with achromatopsia
Aydın, R., Özbek, M., Erdur, S. K., & Şentürk, F. (2018) · Journal Français d Ophtalmologie · doi:10.1016/j.jfo.2017.08.023 · Cited by 2
Kurnia, K. H., Elvioza, Sidik, M., Sari, T. T., Prihartono, J., & Sitorus, R. S. (2021) · Graefe s Archive for Clinical and Experimental Ophthalmology · doi:10.1007/s00417-021-05141-z · Cited by 2
Deep Vascular Imaging in the Eye with Flow-Enhanced Ultrasound
Damsgaard, C., & Lauridsen, H. (2021) · Journal of Visualized Experiments · doi:10.3791/62986 · Cited by 2
Recent Advances and New Perspectives in Managing Macular Degeneration
Davey, P. G. (2021) · IntechOpen eBooks · doi:10.5772/intechopen.91530 · Cited by 2
Shortwave infrared imaging and its translation to clinically-relevant designs
Carr, J. A. (2018) · DSpace@MIT (Massachusetts Institute of Technology) · Cited by 2
Gallego-Pinazo, R., Dolz‐Marco, R., Yzer, S., López, I., García-Lallana, I., Ciriano, J. P. M., & López-Garrido, J. A. (2019) · Elsevier eBooks · doi:10.1016/b978-0-12-816800-4.00007-3 · Cited by 2
Lorenzana-Blanco, N., Jimenez‐Rolando, B., García‐Sandoval, B., Blanco‐Kelly, F., Ávila‐Fernández, A., Martín-Mérida, I., Garcia-Ferreira, M., Campos-Seco, S., Ayuso, C., & Carreño, E. (2022) · European Journal of Ophthalmology · doi:10.1177/11206721221138891 · Cited by 1
Evaluation of maximal dosing volume for intravitreal injections in cynomolgus monkeys
Sakata, M., Araki, T., & Tomohiro, M. (2023) · Fundamental Toxicological Sciences · doi:10.2131/fts.10.157 · Cited by 1
Role of fundus autofluorescence imaging in the management of submacular hemorrhage
Venkatesh, R., Joshi, A., Chitturi, S. P., Choudhary, A., Prabhu, V., Bavaskar, S., Acharya, I., Mangla, R., Kathare, R., Yadav, N. K., et al. (2024) · BMC Ophthalmology · doi:10.1186/s12886-024-03715-z · Cited by 1
Retinopathy associated with thrombotic microangiopathy of mixed origin (case report)
Yusef, Y., Шелудченко, В. М., Budzinskaya, M. V., Tv, S., Kozlovskaya, N. L., Durzhinskaya, M. H., Krasnolutskaya, E. I., & Мэлсовна, К. А. (2024) · Russian Annals of Ophthalmology · doi:10.17116/oftalma202414006190 · Cited by 1
Akhtar, H. N., Lam, C. F. J., Lin, S., Arno, G., Pulido, J. S., Webster, A. R., Michaelides, M., & Mahroo, O. A. (2025) · Translational Vision Science & Technology · doi:10.1167/tvst.14.5.24 · Cited by 1
Mordà, D., Alibrandi, S., Scimone, C., Rinaldi, C., Scalinci, S. Z., Abate, G., D’Angelo, R., Sidoti, A., & Donato, L. (2025) · Progress in Retinal and Eye Research · doi:10.1016/j.preteyeres.2025.101405 · Cited by 2
Automated measurement of macular neovascularization lesion size in nAMD using AI segmentation
Vahldiek, A., Heine, L., Vahldiek, B., Schröter, J., Wolf, J.-N., Swora, M., Reissberg, L., Pauleikhoff, L. J. B., Kleesiek, J., & Pauleikhoff, D. (2025) · Graefe s Archive for Clinical and Experimental Ophthalmology · doi:10.1007/s00417-025-07007-0 · Cited by 1
Xu, X., Sprogyte, L., Richardson, A., Nureen, L., Goldys, E. M., Girolamo, N. D., & Habibalahi, A. (2025) · Experimental Eye Research · doi:10.1016/j.exer.2025.110829 · Cited by 1
Interphotoreceptor Retinoid-Binding Protein Implications in Diabetic Retinopathy
Bermea, K. C. (2018) · InTech eBooks · doi:10.5772/intechopen.72835 · Cited by 1
Retinal disease in the neurology clinic
Tauscher, R. G., Simon, S. S., & Volpe, N. J. (2020) · Current Opinion in Neurology · doi:10.1097/wco.0000000000000883 · Cited by 1
Gene Therapy, Diet and Drug Approaches to Treating Inherited Retinal Disease
Simunovic, M. P., Mack, H. G., Ayton, L. N., & Hassall, M. (2021) · Elsevier eBooks · doi:10.1016/b978-0-12-820472-6.00154-7 · Cited by 1
Feature Extraction and Quantification in Retinal Fundus Autofluorescence Images of CSR Patients
Bino., N., Haris, P. A., & Sheeba, O. (2022) · International Conference on Innovations in Science and Technology for Sustainable Development (ICISTSD) · doi:10.1109/icistsd55159.2022.10010533 · Cited by 1
Rabinovich, M., Mehanna, C.-J., López, J. M., & Souied, E. H. (2023) · European Journal of Ophthalmology · doi:10.1177/11206721231199635 · Cited by 1
Macular Degeneration, Geographic Atrophy, and Inherited Retinal Disorders
Gupta, A., Bansal, R., Sharma, A., & Kapil, A. (2023) · Springer eBooks · doi:10.1007/978-981-99-7923-3_13 · Cited by 1
Kulkarni, A., Lai, T. Y. Y., Szeto, S., & Sahoo, N. K. (2024) · Springer eBooks · doi:10.1007/978-981-97-0138-4_25 · Cited by 1
Al-Dwairi, R. A., Altal, O. F., Fares, M., Adi, S., Said, S. A., Shurair, A., Al-Bataineh, R., Aljarrah, I. A., Beiruti, S. A., Sharie, A. H. A., et al. (2024) · Life · doi:10.3390/life14121596 · Cited by 1
Utility of multimodal imaging in the clinical diagnosis of inherited retinal degenerations
Lee, B. J. H., Sun, C., Ong, C., Jain, K., Tan, T., Chan, C. M., Mathur, R. S., Tang, R. W. C., Bylstra, Y. M., Kam, S., et al. (2024) · Taiwan Journal of Ophthalmology · doi:10.4103/tjo.tjo-d-24-00066 · Cited by 1
Huang, S. J., & Bitencourt, F. N. (2024) · Springer eBooks · doi:10.1007/978-3-031-29358-0_7-1 · Cited by 1
Anatomy, physiology, and imaging of the normal retina
Yanık, Ö., Beğar, P. G., Bousyf, S., & Demirel, S. (2025) · Elsevier eBooks · doi:10.1016/b978-0-443-29084-8.00002-x · Cited by 1
Fundus autofluorescence in the evaluation of diabetic macular edema treatment response
Mota, S. E. H.-D., Béjar-Cornejo, F., Lima-Gómez, V., & Rodríguez-Ayala, E. (2022) · Gaceta Médica de México · doi:10.24875/gmm.m21000581 · Cited by 1
Harel, I. D., Garg, I., & Delori, F. C. (2022) · Springer eBooks · doi:10.1007/978-3-030-42634-7_143 · Cited by 1
Recent Trends in Retinal and Choroidal Imaging
El-Maamon, T. A., Salman, A. G., & Mahmoud, S. S. (2017) · The Egyptian Journal of Hospital Medicine · doi:10.12816/0038193
Discriminators for Optic Neuropathy and Maculopathy
Turgut, B. (2017) · Advances in Ophthalmology & Visual System · doi:10.15406/aovs.2017.07.00249
Clinical Features of a Pediatric Case with Cone Dystrophy
Balyen, L., & Küsbeci, T. (2018) · Van Medical Journal · doi:10.5505/vtd.2018.74436
Posterior Uveitis: Role of Imaging Modalities
Le, P. V. (2019) · Essentials in ophthalmology/Essentials ophthalmology · doi:10.1007/978-3-030-03140-4_1
Imagerie multimodale en choriorétinopathie séreuse centrale aiguë et chronique
Vo, A., & Haynes, J. (2019) · Canadian journal of optometry/CJO. Canadian journal of optometry · doi:10.15353/cjo.v81i2.1342
Multimodal Imaging in Acute and Chronic Central Serous Chorioretinopathy
Vo, A., & Haynes, J. (2019) · Canadian journal of optometry/CJO. Canadian journal of optometry · doi:10.15353/cjo.v81i2.732
Clasificación de patrones anormales de autofluorescencia retiniana en el edema macular diabético
Mota, S. E. H.-D., Lima-Gómez, V., Rodríguez-Ayala, E., Fromow-Guerra, J., & Melo-Granados, E. A. R. (2019) · Gaceta Médica de México · doi:10.24875/gmm.19004992
Fundusautofluoreszenz: Klinische Anwendung und diagnostische Bedeutung
Bindewald-Wittich, A., & Kellner, U. (2020) · Augenheilkunde up2date · doi:10.1055/a-0917-2091
Dry Age-Related Macular Degeneration
Makhijani, V. S., Ung, C., & Husain, D. (2020) · Retina atlas · doi:10.1007/978-981-15-3001-2_1
Autofluorescencia de retina en la evaluación del edema macular diabético
Mota, S. E. H.-D., Rodríguez-Ayala, E., Fromow-Guerra, J., & Melo-Granados, E. A. R. (2020) · Revista Mexicana de Oftalmología · doi:10.24875/rmo.m20000114
Die fibrovaskuläre Umwandlung der CNV bei nAMD unter lang andauernder Anti-VEGF-Therapie
Book, M., Ziegler, M., Rothaus, K., Faatz, H., Gunnemann, M., Spital, G., Gutfleisch, M., Lommatzsch, A. P., & Pauleikhoff, D. (2020) · Der Ophthalmologe · doi:10.1007/s00347-020-01261-9
Takkar, B., & Jalali, S. (2021) · Medical Hypotheses · doi:10.1016/j.mehy.2021.110511
Optical Imaging in Biology: Basics and Applications
Singh, S., & Siddhanta, S. (2021) · Progress in optical science and photonics · doi:10.1007/978-981-33-6084-6_23
Hassanpoor, N., Mirshahi, A., & Niyousha, M. R. (2021) · Journal of Ophthalmic and Vision Research · doi:10.18502/jovr.v16i2.9093
Nafar, Z. (2020) · FIU - Digital Commons (Florida International University) · doi:10.25148/etd.fidc008936
Diagnosis of age-related macular degeneration
Li, W. (2021) · Elsevier eBooks · doi:10.1016/b978-0-12-822061-0.00012-8
Multimodal Imaging Findings in Two Children With Microphthalmos
Acón, D., Hussain, R. M., Quan, A. V., Mendoza‐Santiesteban, C. E., & Berrocal, A. M. (2021) · Ophthalmic surgery, lasers & imaging retina · doi:10.3928/23258160-20210727-06
Book, M., Ziegler, M., Rothaus, K., Faatz, H., Gunnemann, M., Spital, G., Gutfleisch, M., Lommatzsch, A. P., & Pauleikhoff, D. (2021) · Der Ophthalmologe
Mota, S. E. H.-D., Béjar-Cornejo, F., Lima-Gómez, V., & Rodríguez-Ayala, E. (2021) · Gaceta Médica de México · doi:10.24875/gmm.20000844
Beketova, T., & Landa, G. (2021) · IntechOpen eBooks · doi:10.5772/intechopen.101490
Diagnosis and Complementary Examinations
Lew, Y. J., & Duncan, J. L. (2019) · Stem cell biology and regenerative medicine · doi:10.1007/978-3-030-05222-5_11
Effects of systemic drugs on the development of drug-induced retinopathy
Bikbov, M. M., Gizzatov, A. V., & Zainullin, R. M. (2022) · Russian Annals of Ophthalmology · doi:10.17116/oftalma202213802194
Metadata
- Authors
- Yung, M., Klufas, M. A., & Sarraf, D.
- Affiliations
- University of California, Los Angeles (US)
- Corresponding author
- Sarraf, David
- Venue
- International Journal of Retina and Vitreous
- Published
- 2016-04-08
- Volume
- 2
- Issue
- 1
- Pages
- 12-12
- ISSN
- 2056-9920 (ISSN-L)
- PMC
- PMC5088473
- OpenAlex
- W2329521208
- Cited by
- 236
- References
- 198
- Citations by year
- 2026: 15 · 2025: 23 · 2024: 22 · 2023: 20 · 2022: 29 · 2021: 40 · 2020: 31 · 2019: 24 · 2018: 22 · 2017: 8 · 2016: 1
- FWCI
- 3.58
- Type
- journal article
- Language
- en
- Open access
- gold
- doi.org
- Licence
- cc-by
- Locations
- International Journal of Retina and Vitreous (publishedVersion, cc-by)
- PubMed Central (publishedVersion, cc-by)
- PubMed (publishedVersion)
- Funders
- Regeneron Pharmaceuticals
- Genentech
- Topics
- Health Sciences › Medicine › Ophthalmology › Retinal Diseases and Treatments
- Health Sciences › Medicine › Radiology, Nuclear Medicine and Imaging › Retinal Imaging and Analysis
- Health Sciences › Medicine › Ophthalmology › Retinal Development and Disorders
- Keywords
- fundus autofluorescence, lipofuscin, retinal pigment epithelium, age-related macular degeneration, macular dystrophy, retinitis pigmentosa, white dot syndromes, ultra-widefield imaging, confocal scanning laser ophthalmoscopy, genotype-phenotype correlation
About these checks
Registry, retraction, Cites and statistics results are computed, not judged, with one exception: a printed reference that no index lists is read once by a model before it counts as a citation error. Claims are extracted by a model and kept only when their quote appears verbatim in the text; each cited source is then checked, with a model’s help, for whether it says what the claim relies on. Those verdicts can be wrong — read the claim’s quote and the cited source before relying on one.
Statistics and arithmetic are recomputed, not judged.
Confidence bands are shown only for fields calibrated on our annotated test set. None is calibrated yet, so no band is shown.
What counts as a claim ›How we measure confidence ›How we check this ›
Are you an author, or do you see a problem with this page? Request a review
