

The DOI matches its Crossref record; 39 of the 39 references it cites were found in a registry or an index.
Urine Steroid Metabolomics as a Biomarker Tool for Detecting Malignancy in Adrenal Tumors
Open accessAbstract
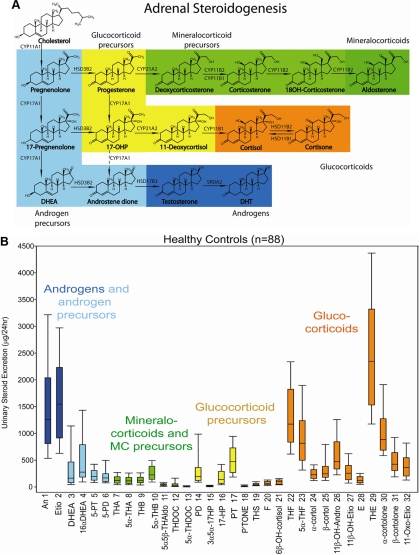
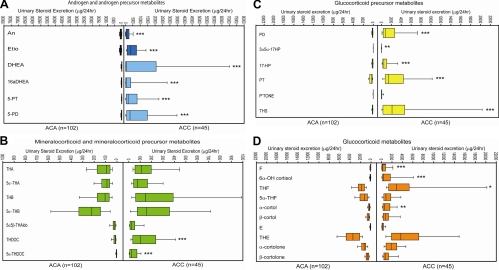
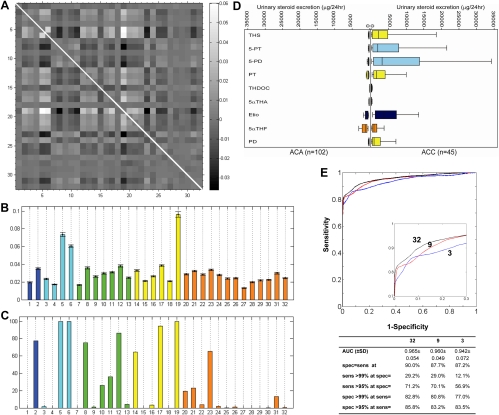
CONTEXT: Adrenal tumors have a prevalence of around 2% in the general population. Adrenocortical carcinoma (ACC) is rare but accounts for 2-11% of incidentally discovered adrenal masses. Differentiating ACC from adrenocortical adenoma (ACA) represents a diagnostic challenge in patients with adrenal incidentalomas, with tumor size, imaging, and even histology all providing unsatisfactory predictive values. OBJECTIVE: Here we developed a novel steroid metabolomic approach, mass spectrometry-based steroid profiling followed by machine learning analysis, and examined its diagnostic value for the detection of adrenal malignancy. DESIGN: Quantification of 32 distinct adrenal derived steroids was carried out by gas chromatography/mass spectrometry in 24-h urine samples from 102 ACA patients (age range 19-84 yr) and 45 ACC patients (20-80 yr). Underlying diagnosis was ascertained by histology and metastasis in ACC and by clinical follow-up [median duration 52 (range 26-201) months] without evidence of metastasis in ACA. Steroid excretion data were subjected to generalized matrix learning vector quantization (GMLVQ) to identify the most discriminative steroids. RESULTS: Steroid profiling revealed a pattern of predominantly immature, early-stage steroidogenesis in ACC. GMLVQ analysis identified a subset of nine steroids that performed best in differentiating ACA from ACC. Receiver-operating characteristics analysis of GMLVQ results demonstrated sensitivity = specificity = 90% (area under the curve = 0.97) employing all 32 steroids and sensitivity = specificity = 88% (area under the curve = 0.96) when using only the nine most differentiating markers. CONCLUSIONS: Urine steroid metabolomics is a novel, highly sensitive, and specific biomarker tool for discriminating benign from malignant adrenal tumors, with obvious promise for the diagnostic work-up of patients with adrenal incidentalomas.
Overview
The claims and statistics of this paper haven’t been checked yet.
Run the check — free, no account needed. It reads the open-access text and checks the sources it cites.
Integrity signals
Registry
Cites
Statistics
Figures
Verification
Claims the paper makes
The claims and statistics of this paper haven’t been checked yet.
Run the check — free, no account needed. It reads the open-access text and checks the sources it cites.
Claims other papers make about this one
Each is checked against this paper’s own text: does it say what the citing paper says it does?
The cited source says what the claim attributes to it.
In the citing paper
“Particularly, the reoccurrence of presurgical steroid profiles may raise concern of relapse (95).”
From Adrenocortical carcinoma (2014) · cites this paper as [95]
The cited source says what the claim attributes to it.
In the citing paper
“The combination of mass spectrometry–based steroid profiling with machine learning–based data analysis has created a powerful discovery tool, steroid metabolomics, highly suited as a diagnostic biomarker approach (1–4).”
From Steroid Metabolome Analysis in Disorders of Adrenal Steroid Biosynthesis and Metabolism (2019) · cites this paper as [1]
In the citing paper
“Adrenal steroid production and metabolism are affected by sex, age, and BMI (342,345,346).”
From Adrenal incidentaloma (2020) · cites this paper as [342]
In the citing paper
“Twenty-four-hour urine steroid excretion analysis represents a more accurate estimate of total corticosteroid production and of adrenal precursor steroids and metabolites (342, 343) and therefore has significant potential in the assessment of adrenal diseases.”
From Adrenal incidentaloma (2020) · cites this paper as [342]
In the citing paper
“Twenty-four-hour urine steroid excretion analysis represents a more accurate estimate of total corticosteroid production and of adrenal precursor steroids and metabolites (342, 343) and therefore has significant potential in the assessment of adrenal diseases.”
From Adrenal incidentaloma (2020) · cites this paper as [342]
In the citing paper
“In particular, the cosecretion of a distinct combination of glucocorticoid and androgen metabolites is emerging as a sensitive diagnostic tool for ACC (342,348,349).”
From Adrenal incidentaloma (2020) · cites this paper as [342]
In the citing paper
“The majority of ACC patients (69%) showed androgen precursor excess, either combined with increased excretion of glucocorticoid precursors (36%) or both glucocorticoid and mineralocorticoid precursors (33%).”
From Adrenal incidentaloma (2020) · cites this paper as [342]
In the citing paper
“Using machine learning, the authors were able to identify that tetrahydro-11-deoxycortisol (THS), pregnenetriol (5-PT), and pregnenediol (5-PD) were the most discriminatory between ACC and ACA.”
From Adrenal incidentaloma (2020) · cites this paper as [342]
In the citing paper
“Urinary steroid profiling revealed distinct differences between adrenocortical adenomas and ACC patients (Fig. 10).”
From Adrenal incidentaloma (2020) · cites this paper as [342]
In the citing paper
“There was no effect of age, sex, tumor size, or presence of metastasis on the characteristics of the urine steroid metabolomes in ACC and ACA patients.”
From Adrenal incidentaloma (2020) · cites this paper as [342]
In the citing paper
“Studies have shown that ACCs have a distinct pattern of urinary corticosteroids, characterized by an excess of precursor steroid metabolites (Fig. 10 (342)).”
From Adrenal incidentaloma (2020) · cites this paper as [342]
In the citing paper
“Even when analyzing the ACC patients without evidence of hormone excess on routine biochemistry, urinary excretion of androgen, and glucocorticoid precursor metabolites remained significantly increased.”
From Adrenal incidentaloma (2020) · cites this paper as [342]
In the citing paper
“They reported that 27% of patients with ACC had no hormonal excess on routine biochemical testing.”
From Adrenal incidentaloma (2020) · cites this paper as [342]
In the citing paper
“By contrast, steroid precursor metabolite excretion in nonmalignant AI did not differ from healthy controls.”
From Adrenal incidentaloma (2020) · cites this paper as [342]
In the citing paper
“ACC patients had a significantly higher excretion of androgen precursor metabolites, metabolites of active androgens, deoxycorticosterone, and glucocorticoid precursor metabolites were significantly higher in ACC, as was free cortisol.”
From Adrenal incidentaloma (2020) · cites this paper as [342]
In the citing paper
“All studies identified THS as the most informative steroid marker indicative of ACC.”
From Adrenal incidentaloma (2020) · cites this paper as [342]
In the citing paper
“As an example, this approach has been used for automating differentiation of adrenocortical carcinoma (ACC) from benign adrenocortical tumors based on the detection of a “malignant steroid fingerprint”, a distinct set of urine steroid metabolites characteristically increased in ACC [348].”
From Human steroid biosynthesis, metabolism and excretion are differentially reflected by serum and urine steroid metabolomes: a comprehensive review (2019) · cites this paper as [348]
In the citing paper
“The urinary steroid metabolome represents the total of all steroid biosynthetic and metabolising pathways and has proven to be a specific and sensitive biomarker for the diagnosis of steroidogenic disease (Arlt et al., 2011).”
From Intracrine androgen biosynthesis, metabolism and action revisited (2018) · cites this paper as Arlt et al., 2011
In the citing paper
“AST and ETIO are measured as representatives of active androgens, while DHEA and 16αOH-DHEA are measured as representatives of direct androgen precursors (Arlt et al., 2011, Krone et al., 2010).”
From Intracrine androgen biosynthesis, metabolism and action revisited (2018) · cites this paper as Arlt et al., 2011
In the citing paper
“The combination of mass spectrometry–based steroid profiling with machine learning–driven analysis of the urinary steroid excretion data allowed for rapid detection of a “malignant steroid fingerprint” (Fig. 8E) (1) that can differentiate ACC from ACA with high sensitivity and specificity.”
From Steroid Metabolome Analysis in Disorders of Adrenal Steroid Biosynthesis and Metabolism (2019) · cites this paper as [1]
In the citing paper
“The steroid biomarkers that are most helpful at distinguishing ACCs from ACAs include the glucocorticoid precursor metabolite THS, and the androgen precursor metabolites of Preg and 17OHPreg, 5PD, and 5PT (1).”
From Steroid Metabolome Analysis in Disorders of Adrenal Steroid Biosynthesis and Metabolism (2019) · cites this paper as [1]
In the citing paper
“Additionally, recent retrospective studies employing GC-MS–based urine steroid profiling revealed that ACCs present a unique steroidogenic “signature” characterized by accumulation of steroid hormone precursors (1, 154, 155) (Fig. 8E).”
From Steroid Metabolome Analysis in Disorders of Adrenal Steroid Biosynthesis and Metabolism (2019) · cites this paper as [1]
In the citing paper
“Isolated autonomous androgen excess from the adrenal gland can very rarely occur in the context of benign ACAs (1).”
From Steroid Metabolome Analysis in Disorders of Adrenal Steroid Biosynthesis and Metabolism (2019) · cites this paper as [1]
In the citing paper
“Routine serum biochemistry detects steroid hormone excess in 60% to 70% of ACC patients, with glucocorticoid and androgen excess dominating (1, 188); however, urine GC-MS profiling demonstrated steroid excess in >90% (1).”
From Steroid Metabolome Analysis in Disorders of Adrenal Steroid Biosynthesis and Metabolism (2019) · cites this paper as [1]
In the citing paper
“Routine serum biochemistry detects steroid hormone excess in 60% to 70% of ACC patients, with glucocorticoid and androgen excess dominating (1, 188); however, urine GC-MS profiling demonstrated steroid excess in >90% (1).”
From Steroid Metabolome Analysis in Disorders of Adrenal Steroid Biosynthesis and Metabolism (2019) · cites this paper as [1]
Self-check
Percentages, sums and reported differences re-computed from the paper’s own numbers.
The self-check needs the paper’s full text.
Citations
Cites
(2005) · Springer eBooks · doi:10.1007/0-387-27255-0_9 · Cited by 20,333
McCullagh, P., & Nelder, J. A. (1989) · doi:10.1007/978-1-4899-3242-6 · Cited by 16,836
Kohonen, T. (1995) · Springer series in information sciences · doi:10.1007/978-3-642-56927-2 · Cited by 16,032
The Incidentally Discovered Adrenal Mass
Young, W. F. (2007) · New England Journal of Medicine · doi:10.1056/nejmcp065470 · Cited by 1,090
Management of the clinically inapparent adrenal mass ("incidentaloma")
Grumbach, M. M., Biller, B. M. K., Braunstein, G. D., Campbell, K. K., Carney, J. A., Godley, P. A., Harris, E. L., Lee, J. K. T., Oertel, Y. C., Posner, M. C., et al. (2003) · Annals of Internal Medicine · doi:10.7326/0003-4819-138-5-200303040-00013 · Cited by 945 · cited 4×
“The risk of malignancy increases with the diameter of the adrenal mass (1, 2, 8).”
BackgroundMethodInfluentialA Survey on Adrenal Incidentaloma in Italy
Mantero, F. (2000) · The Journal of Clinical Endocrinology & Metabolism · doi:10.1210/jc.85.2.637 · Cited by 907
Self-citationPathologic features of prognostic significance in adrenocortical carcinoma
Weiss, L. M., Medeiros, L. J., & Vickery, A. L. (1989) · The American Journal of Surgical Pathology · doi:10.1097/00000478-198903000-00004 · Cited by 818 · cited 2×
“a The Weiss system scores the presence or absence of nine histopathological features (Weiss score range 0–9); scores under 3 are indicative of a benign adrenal tumor, scores of 3 are borderline, and scores of 4 and above are indicative of malignancy (14).”
BackgroundThe clinically inapparent adrenal mass: update in diagnosis and management
Mansmann, G., Lau, J., Balk, E., Rothberg, M., Miyachi, Y., & Bornstein, S. R. (2004) · Endocrine Reviews · doi:10.1210/er.2002-0031 · Cited by 781
Adrenocortical Carcinoma: Clinical Update
Allolio, B., & Fassnacht, M. (2006) · The Journal of Clinical Endocrinology & Metabolism · doi:10.1210/jc.2005-2639 · Cited by 775
Self-citationFassnacht, M., Johanssen, S., Quinkler, M., Bucsky, P., Willenberg, H. S., Beuschlein, F., Terzolo, M., Mueller, H., Hahner, S., Allolio, B., et al. (2009) · Cancer · doi:10.1002/cncr.24030 · Cited by 695
Self-citation
Research works printed but not linked: 1
- Shackleton, 2011, GC/MS steroid profiling: diagnosis of disorders affecting steroid synthesis and metabolism, 789
Cited by
Sorted by citations
Lacroix, A., Feelders, R. A., Stratakis, C. A., & Nieman, L. K. (2015) · The Lancet · doi:10.1016/s0140-6736(14)61375-1 · Cited by 1,777
Fassnacht, M., Arlt, W., Bancos, I., Dralle, H., Newell-Price, J., Sahdev, A., Tabarin, A., Terzolo, M., Tsagarakis, S., & Dekkers, O. M. (2016) · European Journal of Endocrinology · doi:10.1530/eje-16-0467 · Cited by 1,566
Self-citationGlobal Disorders of Sex Development Update since 2006: Perceptions, Approach and Care
Lee, P. A., Nordenström, A., Houk, C. P., Ahmed, S. F., Auchus, R. J., Baratz, A. B., Dalke, K. B., Liao, L., Lin‐Su, K., Looijenga, L. H. J., et al. (2016) · Hormone Research in Paediatrics · doi:10.1159/000442975 · Cited by 1,292
Faßnacht, M., Dekkers, O. M., Else, T., Baudin, É., Berruti, A., de Krijger, R. R., Haak, H. R., Mihai, R., Assié, G., & Terzolo, M. (2018) · European Journal of Endocrinology · doi:10.1530/eje-18-0608 · Cited by 976
Self-citationElse, T., Kim, A. C., Sabolch, A., Raymond, V. M., Kandathil, A., Caoili, E. M., Jolly, S., Miller, B. S., Giordano, T. J., & Hammer, G. D. (2014) · Endocrine Reviews · doi:10.1210/er.2013-1029 · Cited by 892
Metadata
- Authors
- Arlt, W., Biehl, M., Taylor, A. E., Hahner, S., Libé, R., Hughes, B. A., Schneider, P., Smith, D. J., Stiekema, H., Krone, N., Porfiri, E., Opocher, G., Bertherat, J., Mantero, F., Allolio, B., Terzolo, M., Nightingale, P., Shackleton, C. H. L., Bertagna, X., Fassnacht, M., & Stewart, P. M.
- Affiliations
- University of Birmingham (GB)
- University of Groningen (NL)
- University of Würzburg (DE)
- Inserm (FR)
- University of Padua (IT)
- Department of Endocrinology (R.L., J.B., X.B.), INCa-COMETE, Cochin Hospital, Institut Cochin, Institut National de la Santé et de la Recherche Médicale Unité 1016, René Descartes University, 75006 Paris, France
- University of Turin (IT)
- National Health Service (GB)
- Corresponding author
- Arlt, Wiebke
- ORCID
- Venue
- The Journal of Clinical Endocrinology & Metabolism
- Publisher
- The Endocrine Society
- Published
- 2011-12-01
- Volume
- 96
- Issue
- 12
- Pages
- 3775-3784
- ISSN
- 0021-972X (ISSN-L)
- 1945-7197
- PMC
- PMC3232629
- OpenAlex
- W1991016861
- Cited by
- 458
- References
- 38
- Citations by year
- 2026: 19 · 2025: 28 · 2024: 31 · 2023: 26 · 2022: 31 · 2021: 28 · 2020: 41 · 2019: 48 · 2018: 35 · 2017: 30 · 2016: 30 · 2015: 41 · 2014: 24 · 2013: 21 · 2012: 21
- FWCI
- 22.57
- Type
- journal article
- Language
- en
- Open access
- hybrid
- doi.org
- Licence
- Locations
- The Journal of Clinical Endocrinology & Metabolism (publishedVersion, cc-by-nc)
- Europe PMC (PubMed Central) (publishedVersion, cc-by-nc)
- PubMed Central (publishedVersion, cc-by-nc)
- PubMed (publishedVersion)
- University of Birmingham Research Portal (University of Birmingham) (publishedVersion, cc-by-nc)
- University of Groningen research database (University of Groningen / Centre for Information Technology) (publishedVersion, other-oa)
- Institutional Research Information System University of Turin (University of Turin) (submittedVersion)
- Online Publication Service of Würzburg University (Würzburg University) (submittedVersion, cc-by-nc)
- Spiral (Imperial College London) (submittedVersion, cc-by-nc)
- Padua Research Archive (University of Padova) (submittedVersion)
- University of Groningen research database (University of Groningen / Centre for Information Technology) (submittedVersion, other-oa)
- Funders
- National Institute for Health and Care Research (NF-SI-0508-10356)
- European Commission (259735)
- European Science Foundation
- Medical Research Council (G0801473)
- European Social Fund
- Topics
- Health Sciences › Medicine › Surgery › Adrenal and Paraganglionic Tumors
- Life Sciences › Biochemistry, Genetics and Molecular Biology › Molecular Biology › Metabolomics and Mass Spectrometry Studies
- Health Sciences › Medicine › Endocrinology, Diabetes and Metabolism › Adrenal Hormones and Disorders
- Keywords
- adrenocortical carcinoma, adrenal adenoma, adrenal incidentaloma, steroid profiling, machine learning biomarkers, benign versus malignant differentiation
- MeSH terms
- Adrenal Cortex Hormones, Adrenal Cortex Neoplasms, Adult, Aged, Aged, 80 and over, Diagnosis, Differential, Female, Humans, Male, Middle Aged, Mass Spectrometry, Biomarkers, Adrenocortical Adenoma, Adrenocortical Carcinoma, Metabolomics
About these checks
Registry, retraction, Cites and statistics results are computed, not judged, with one exception: a printed reference that no index lists is read once by a model before it counts as a citation error. Claims are extracted by a model and kept only when their quote appears verbatim in the text; each cited source is then checked, with a model’s help, for whether it says what the claim relies on. Those verdicts can be wrong — read the claim’s quote and the cited source before relying on one.
Statistics and arithmetic are recomputed, not judged.
Confidence bands are shown only for fields calibrated on our annotated test set. None is calibrated yet, so no band is shown.
What counts as a claim ›How we measure confidence ›How we check this ›
Are you an author, or do you see a problem with this page? Request a review
