

The DOI matches its Crossref record, with a small difference in title or year; 157 of the 157 references it cites were found in a registry or an index; 7 of the 90 sources its claims cite were checked for support.
Bayesian model averaging: a tutorial (with comments by M. Clyde, David Draper and E. I. George, and a rejoinder by the authors
Open accessAbstract
Standard statistical practice ignores model uncertainty. Data analysts typically select a model from some class of models and then proceed as if the selected model had generated the data. This approach ignores the uncertainty in model selection, leading to over-confident inferences and decisions that are more risky than one thinks they are. Bayesian model averaging (BMA)provides a coherent mechanism for accounting for this model uncertainty. Several methods for implementing BMA have recently emerged. We discuss these methods and present a number of examples.In these examples, BMA provides improved out-of-sample predictive performance. We also provide a catalogue of currently available BMA software.
Overview
CoChat Summary
TL;DR
This tutorial argues that standard model selection ignores model uncertainty and presents Bayesian model averaging (BMA) as a coherent alternative that averages posterior distributions over models weighted by posterior model probabilities. Across examples, BMA improved out-of-sample predictive performance and produced posterior effect probabilities that often indicated weaker evidence than p-values from single selected models.
Key findings
- BMA provides better average predictive performance than any single model under logarithmic scoring. In the primary biliary cirrhosis (PBC) example, BMA had a partial predictive score of 217.1 versus 221.6 for the top posterior-probability model, 220.7 for stepwise selection, and 222.8 for the Fleming–Harrington model; the 3.6-point difference corresponds to about 6% better prediction per event than the top model, 10% better than the Fleming–Harrington model, and 2% better than stepwise. Over 20 splits, BMA averaged 2.7 points (5% per event) better than both the top posterior-probability model and stepwise selection.
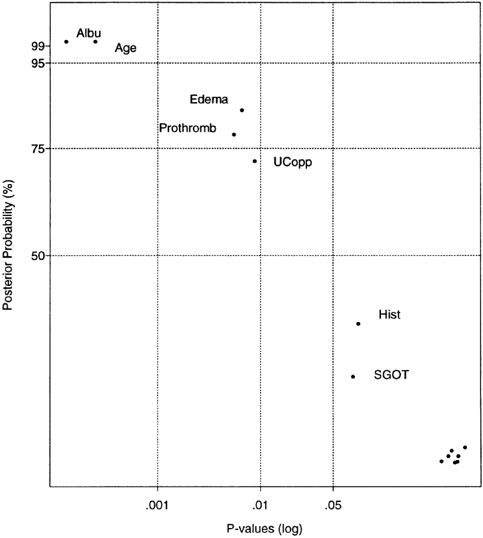
- In the PBC example, the model with the highest approximate posterior probability was the same as the stepwise model but represented only 17% of total posterior probability; the Fleming–Harrington model placed sixth with 5%. Posterior effect probabilities were 100% for bilirubin, albumen, and age; 84% for edema; 78% for prothrombin time; 72% for urine copper; 34% for histologic stage; 22% for SGOT; and 2% for treatment DPCA.
- In the body fat example with 13 predictors and 8,192 possible models, the top model accounted for only 14% of posterior probability and the top 10 models accounted for 57%. BMA predictive coverage was 90.8%, versus 84.4% for stepwise and minimum Mallow’s Cp and 83.5% for maximum adjusted R². Posterior effect probabilities were 100% for abdomen circumference, 97% for weight, 62% for wrist circumference, 35% for forearm, and 19% for neck.
- BMA implementation strategies discussed include Occam’s window, Markov chain Monte Carlo model composition (MC³), leaps-and-bounds search, and BIC, Laplace, and MLE approximations, with software catalogued for linear regression, generalized linear models, survival analysis, and graphical models.
Methods
- The paper is a tutorial/review that develops BMA theory and implementation details for linear regression, generalized linear models, survival analysis, and graphical models, then illustrates BMA in two examples.
- PBC example: Mayo Clinic randomized trial data on 312 patients; 8 omitted for incomplete data, leaving 304 patients, of whom 123 died and 181 were censored. The analysis used 14 prognostic variables plus treatment DPCA, compared BMA via leaps-and-bounds to stepwise selection, the top posterior-probability model, and the Fleming–Harrington model using partial predictive scores and predictive discrimination.
- Body fat example: 252 men with 13 simple body measurements; one subject with erroneous height was omitted, leaving 251. Posterior model probabilities were computed for all 2¹³ = 8,192 models under diffuse proper priors, and BMA was compared with stepwise, minimum Mallow’s Cp, and maximum adjusted R² using predictive coverage.
Limitations
- The paper states that BMA implementation faces major difficulties: the number of terms in the model sum can be enormous, the required integrals can be hard to compute, prior model probabilities are challenging to specify, and choosing the class of models over which to average is the fundamental modeling task. It also lists open questions including prior choice, performance when the true model is not in the model class, tuning Occam’s window versus full BMA, methodology for other model classes, and more efficient computation.
- The paper and rejoinder state that BMA is conditional on the selected model class and does not address uncertainty about model class selection; Occam’s window is heuristic and lacks formal theoretical support as an approximation to full BMA, though the authors say biases seem small in practice.
- Discussants note additional limitations evident in the text: posterior effect probabilities can be sensitive to prior hyperparameters and the model space; Occam’s window may bias posterior effect probabilities; the PBC high-risk predictive advantage is modest when uncertainty bands are attached; and BMA in the body fat example requires all 13 measurements.
Model-written summary. Check it against the paper before relying on it.
Integrity signals
Registry
Cites
Statistics
Figures

Verification
Claims the paper makes
6 Valid · 12 Not valid · 63 Not checked · 154 Own results and interpretations
The cited sources support only part of this claim — read each source’s verdict below.
In the paper
“Draper (1995), Raftery, Madigan and Volinsky (1996) and Volinsky et al. (1997) show its usefulness in the BMA context.”
What the sources say
- Supportedcites Draper (1995) source
Section 5.4 describes a large-sample approximation to a model-averaged predictive distribution that uses the MLE and maximum log-likelihood for each model. This supports the claim that an MLE-based approximation is useful in the BMA context. (LLM, conf=0.91)
- Not matchedcites Raftery, Madigan and Volinsky (1996)
Couldn’t be matched to a paper in Crossref, so it can’t be checked.
- Supportedcites Volinsky et al. (1997) source
Section 4.3 explicitly uses the MLE approximation to obtain predictive distributions for the paper’s BMA method. Section 5.2 (p. 445) reports that the resulting BMA approach performed well at identifying people at risk of stroke, supporting the broad claim of usefulness. (LLM, conf=0.88)
boosted- Asserted: passes — The authors put it forward as true.
- Checkable: passes — It can be checked against evidence.
- Load-bearing: unclear — It is unclear whether the paper’s conclusions depend on it.
- Based: passes — The paper gives a reason why it holds.
- Supported
The cited sources support only part of this claim — read each source’s verdict below.
In the paper
“Models like M ∗∗ are commonplace: for striking examples see Regal and Hook (1991), Draper (1995), Madigan and York (1995), Kass and Raftery (1995), and Raftery (1996).”
What the sources say
- Not checked — no full text of the sourcecites Regal and Hook (1991) source
- Partly supportedcites Draper (1995) sourceExperimental — accuracy not yet measured
Section 6.2 (page not provided) says that other models can fit equally well or better yet have different inferential or predictive consequences. This supports the general point, but the paper does not establish that this is commonplace specifically for alternative proportional hazards models or document the claimed differences in their effect sizes and standard errors. (LLM, conf=0.85)
- Not checked — no full text of the sourcecites Madigan and York (1995) source
plainstates a cause- Asserted: passes — The authors put it forward as true.
- Checkable: passes — It can be checked against evidence.
- Load-bearing: passes — The paper’s conclusions depend on it.
- Based: passes — The paper gives a reason why it holds.
The sources with a verdict support this claim; the rest weren’t checked yet, have no full text we could read, or their verdicts aren’t rated yet.
In the paper
“The Laplace method (Tierney and Kadane, 1986) can provide an excellent approximation to pr lparenOSCASB D vertSHT Mk rparenOSCASB ; in certain circumstances this yields the very simple BIC approximation (Schwarz, 1978; Kass and Wasserman 1995; Raftery, 1995).”
What the sources say
- Supportedcites Schwarz, 1978 source
In Section 3 (pp. 2–3), Schwarz derives an asymptotic approximation to the model-probability integral using a quadratic expansion around its maximum. The resulting large-sample model-selection rule on p. 1 is the BIC criterion. The paper does not use the name “Laplace method,” but the derivation supports the attributed paraphrase. (LLM, conf=0.89)
- Not matchedcites Kass and Wasserman 1995
Couldn’t be matched to a paper in Crossref, so it can’t be checked.
- Not checked — no full text of the sourcecites Raftery, 1995 source
plainstates a cause- Asserted: passes — The authors put it forward as true.
- Checkable: passes — It can be checked against evidence.
- Load-bearing: unclear — It is unclear whether the paper’s conclusions depend on it.
- Based: passes — The paper gives a reason why it holds.
- Supported
The sources with a verdict support this claim; the rest weren’t checked yet, have no full text we could read, or their verdicts aren’t rated yet.
In the paper
“In fact, p -values arguably overstate the evidence for an effect even when there is no model uncertainty (Edwards, Lindman and Savage, 1963; Berger and Delampady, 1987; Berger and Sellke, 1987).”
What the sources say
- Not checked — no full text of the sourcecites Edwards, Lindman and Savage, 1963 source
- Supportedcites Berger and Delampady, 1987 source
In 1.2 Motivation (p. 2), the paper compares a P-value with the posterior probability of a precise null under a specified test and finds the latter 5 to 50 times larger. In 4.6 Rejoinder 6 (p. 14), it likewise calculates that a result suggesting 20-to-1 or 40-to-1 surprise provides at most 7.5-to-1 evidence against the null. These examples support the claim without relying on model uncertainty. (LLM, conf=0.91)
- Not checked — no full text of the sourcecites Berger and Sellke, 1987 source
hedgedstates a cause- Asserted: passes — The authors put it forward as true.
- Checkable: passes — It can be checked against evidence.
- Load-bearing: unclear — It is unclear whether the paper’s conclusions depend on it.
- Based: passes — The paper gives a reason why it holds.
Every source the paper cites for this claim was checked and supports it.
In the paper
“The posterior probability of 'no effect' can be viewed as an approximation to the posterior probability of the effect being 'small,' namely, P lparenOSCASB vertSHT β vertSHT < ε rparenOSCASB , provided that ε is at most about onehalf of a standard error (Berger and Delampady, 1987).”
What the sources say
- Supportedcites Berger and Delampady, 1987 source
Section 2.2 (p. 5) defines the interval null as a negligible effect and describes replacing it with a point null assigned the same prior probability. It concludes that this Bayesian point-null approximation is reasonable when the interval’s half-width is no more than one-half of a sample standard deviation (the standard error in its normal model). (LLM, conf=0.90)
plain- Asserted: passes — The authors put it forward as true.
- Checkable: passes — It can be checked against evidence.
- Load-bearing: unclear — It is unclear whether the paper’s conclusions depend on it.
- Based: passes — The paper gives a reason why it holds.
- Supported
96 more claims · 1 with their cited sources checked
Create a free account to see all 235 claims and every source verdict.
- Borderline: one of the tests for a substantial claim is unclear. 1
- It may state two separate claims as one. 63
- Probably not a substantial claim. 93
Claims other papers make about this one
Each is checked against this paper’s own text: does it say what the citing paper says it does?
The source backs part of the claim, not all of it — or backs it for a different population, condition or comparison.
In the citing paper
“In-sample fit is not a robust measure of prediction when data are sparse or missing.”
From Modeling causes of death: an integrated approach using CODEm (2012) · cites this paper as [66]
Experimental — accuracy not yet measuredThe source backs part of the claim, not all of it — or backs it for a different population, condition or comparison.
In the citing paper
“Instead, out-of-sample predictive validity is the appropriate measure [66,68-72].”
From Modeling causes of death: an integrated approach using CODEm (2012) · cites this paper as [66]
Experimental — accuracy not yet measuredThe cited source says what the claim attributes to it.
In the citing paper
“Ensemble models that are weighted combinations of the posterior distributions of component models provide lower error for the point estimate and more accurate uncertainty intervals [62-66].”
From Modeling causes of death: an integrated approach using CODEm (2012) · cites this paper as [66]
Self-check
Percentages, sums and reported differences re-computed from the paper’s own numbers.
Each contradiction between two passages listed here was confirmed by an independent check.
Rated major: it would touch a result — a value a result rests on, reported and recomputed p-values on opposite sides of the significance level, two passages that conflict with no sign which is right, or a cited work retracted before this paper was published.
In the paper
“The difference in PPS of 3.6 can be viewed as an increase in predictive performance per event by a factor of exp lparenOSCASB 3 periodori 6 / 61 rparenOSCASB = 1 periodori 06 or by about 6%. This means that BMA predicts who is at risk 6% more effectively than a method which picks the model with the highest posterior model probability”
Reported 3.6 · recomputed 4.5
Rated minor: it would not touch a result — a value no result rests on, a p-value that stays on the same side of the significance level, or a conflict that is clerical, resolved elsewhere in the paper, or outside its own findings.
In the paper
§ 7.2 Example 2: Predicting Percent Body Fat
“All three standard model selection methods selected the same eight-predictor model (Table 8).”
§ 7.2 Example 2: Predicting Percent Body Fat
“| Stepwise and C p X 1 X 2 | X X 10 X 12 X | 84.4 | | Adjusted R 2 X 1 X | 6 13 2 X 4 X 6 X 7 X 8 X 10 X 12 X 13 | 83.5 |”
Rated minor: it would not touch a result — a value no result rests on, a p-value that stays on the same side of the significance level, or a conflict that is clerical, resolved elsewhere in the paper, or outside its own findings.
In the paper
§ 7.1Example 1 : Primary Biliary Cirrhosis
“Of the remaining 304 patients, 123 were followed until deathand the other 181 observations were censored.”
§ 7.1Example 1 : Primary Biliary Cirrhosis
“For assessing predictive performance, we randomly split the data into two parts suchth at an equal number of events (61 deaths) occurred in each part.”
Citations
Cites
Estimating the Dimension of a Model
Schwarz, G. (1978) · The Annals of Statistics · doi:10.1214/aos/1176344136 · Cited by 47,033
Regression Models and Life-Tables
Cox, D. R. (1972) · Journal of the Royal Statistical Society Series B: Statistical Methodology · doi:10.1111/j.2517-6161.1972.tb00899.x · Cited by 39,793
Information Theory and an Extension of the Maximum Likelihood Principle
Akaike, H. (1998) · Springer Series in Statistics · doi:10.1007/978-1-4612-1694-0_15 · Cited by 17,781
Structural Equations with Latent Variables.
Clogg, C. C., & Bollen, K. A. (1991) · Contemporary Sociology · doi:10.2307/2072165 · Cited by 17,442
Structural Equations with Latent Variables
Bollen, K. A. (1989) · Wiley series in probability and statistics · doi:10.1002/9781118619179 · Cited by 17,277
McCullagh, P., & Nelder, J. A. (1989) · doi:10.1007/978-1-4899-3242-6 · Cited by 16,836
Breiman, L. (1996) · Machine Learning · doi:10.1007/bf00058655 · Cited by 16,325
Kass, R. E., & Raftery, A. E. (1995) · Journal of the American Statistical Association · doi:10.1080/01621459.1995.10476572 · Cited by 12,558
Self-citationWolpert, D. H. (1992) · Neural Networks · doi:10.1016/s0893-6080(05)80023-1 · Cited by 7,951
Bayesian model selection in social research
Raftery, A. E. (1995) · Sociological Methodology · doi:10.2307/271063 · Cited by 6,823
Self-citation
Research works printed but not linked: 9
- Volinsky, C. T. (1997). Bayesian model averaging for censored survival models. Ph.D. dissertation, Univ. Washington, Seattle.
- C. (1993). Combining information: National Research Council Panel on Statistical Issues and Opportunities for Research in the Combination of Information. National Academy Press, Washington, DC. Draper, D., Hodges, J. S., Leamer, E. E., Morris, C. N. and
- George, E. I. (1999). Bayesian model selection. In Encyclopedia of Statistical Sciences Update 3. Wiley, New York. To appear.
- Hoeting, J. A. (1994). Accounting for model uncertainty in linear regression. Ph.D. dissertation, Univ. Washington, Seattle.
- Leamer, E. E. (1978). Specification Searches. Wiley, New York.
- Raftery, A. E., Madigan, D. and Volinsky, C. T. (1996). Accounting for model uncertainty in survival analysis improves predictive performance (withdiscussion). In Bayesian Statistics 5 (J. Bernardo, J. Berger, A. Dawid and A. Smith, eds.) 323-349. Oxford Univ. Press.
- de Finetti, B. (1974, 1975). Theory of Probability 1 and 2. (Trans. by A. F. M. Smithand A. Machi). Wiley, New York.
- George, E. I. (1999). Discussion of "Model averaging and model searchstrategies" by M. Clyde. In Bayesian Statistics 6 (J. M. Bernardo, J. O. Berger, A. P. Dawid and A. F. M. Smith, eds.) 157-185. Oxford University Press.
- George, E. I. (1999). Discussion of "Model averaging and model searchby M. Clyde." In Bayesian Statistics 6 (J. M. Bernardo, J. O. Berger, A. P. Dawid and A. F. M. Smith, eds.) Oxford University Press.
Cited by
Multimodel Inference: Understanding AIC and BIC in Model Selection
Burnham, K. P., & Anderson, D. R. (2004) · Sociological Methods & Research · doi:10.1177/0049124104268644 · Cited by 11,648
“The literature (e.g., Hoeting et al. 1999) supports that the measurements and ( , , ) on a subject cany x x x œ 1 13á w be suitably modeled as multivariate normal.”
BackgroundMethodResultInfluential(2015) · doi:10.1007/s11222-016-9696-4 · Cited by 5,611
Matching as Nonparametric Preprocessing for Reducing Model Dependence in Parametric Causal Inference
Ho, D. E., Imai, K., King, G., & Stuart, E. A. (2007) · Political Analysis · doi:10.1093/pan/mpl013 · Cited by 4,205
“Other seemingly possible alternatives, such as Bayesian model averaging (Hoeting et al. 1999; Imai and King 2004) and cross-validation (Black and Smith 2004), are useful for predictive inference but not directly applicable in the context of causal inference.”
BackgroundBurnham, K. P., Anderson, D. R., & Huyvaert, K. P. (2011) · Behavioral Ecology and Sociobiology · doi:10.1007/s00265-010-1029-6 · Cited by 4,104
“The first approach is called model averaging (see Hoeting et al. 1999 for background and discussion from a Bayesian viewpoint) and this can be best understood from the viewpoint of prediction.”
BackgroundPosada, D., & Buckley, T. R. (2004) · Systematic Biology · doi:10.1080/10635150490522304 · Cited by 3,927
“Although in general model selection is concerned with the selection of just the best fit model, Bayesian approaches allow us to make inferences based on the entire set of candidate models, or model averaging (Hoeting et al., 1999; Madigan and Raftery, 1994; Raftery, 1996; Wasserman, 2000).”
Method
Metadata
- Authors
- Hoeting, J. A., Madigan, D., Raftery, A. E., & Volinsky, C. T.
- Venue
- Statistical Science
- Publisher
- Institute of Mathematical Statistics
- Published
- 1999-11-01
- Volume
- 14
- Issue
- 4
- Pages
- 382-417
- ISSN
- 0883-4237 (ISSN-L)
- OpenAlex
- W1603903339
- Semantic Scholar
- 86699ef1b674504eef0d750f085e53f182f13611
- Cited by
- 4,118
- References
- 148
- Citations by year
- 2026: 103 · 2025: 148 · 2024: 142 · 2023: 125 · 2022: 141 · 2021: 234 · 2020: 221 · 2019: 244 · 2018: 243 · 2017: 248 · 2016: 203 · 2015: 258 · 2014: 222 · 2013: 191 · 2012: 222
- FWCI
- 31.88
- Type
- journal article
- Language
- en
- Open access
- bronze
- doi.org
- Locations
- Statistical Science (publishedVersion)
- Project Euclid (Cornell University) (submittedVersion)
- Columbia Academic Commons (Columbia University)
- Funders
- National Science Foundation (9806243)
- Office of Naval Research (N00014)
- Topics
- Physical Sciences › Mathematics › Statistics and Probability › Statistical Methods and Bayesian Inference
- Physical Sciences › Mathematics › Statistics and Probability › Statistical Methods and Inference
- Physical Sciences › Mathematics › Statistics and Probability › Markov Chains and Monte Carlo Methods
- Keywords
- Bayesian model averaging, model uncertainty, model selection, out-of-sample forecasting, predictive performance
About these checks
Registry, retraction, Cites and statistics results are computed, not judged, with one exception: a printed reference that no index lists is read once by a model before it counts as a citation error. Claims are extracted by a model and kept only when their quote appears verbatim in the text; each cited source is then checked, with a model’s help, for whether it says what the claim relies on. Those verdicts can be wrong — read the claim’s quote and the cited source before relying on one.
The claim verdicts this report counts are experimental: their accuracy is not yet measured.
A language model drew the claims from the paper on 2026-09-28, under version 3 of the claim definition (prompt extract-v3).
A second model labelled each claim on 2026-09-28 (model jev-1.13-20260917, definition revision gold-guideline-v0.2).
Cited sources are checked with a language model’s help (gpt-6-sol).
Statistics and arithmetic are recomputed, not judged.
Confidence bands are shown only for fields calibrated on our annotated test set. None is calibrated yet, so no band is shown.
What counts as a claim ›How we measure confidence ›How we check this ›
Are you an author, or do you see a problem with this page? Request a review
How to cite
Cite CoChat for the checks on this page, and the paper for its own findings.
- This page
- CoChat. (2026). Citation check: Bayesian model averaging: a tutorial (with comments by M. Clyde, David Draper and E. I. George, and a rejoinder by the authors. https://app.cochat.ai/papers/10.1214/ss/1009212519
- The paper
- Hoeting, J. A., Madigan, D., Raftery, A. E., & Volinsky, C. T. (1999). Bayesian model averaging: a tutorial (with comments by M. Clyde, David Draper and E. I. George, and a rejoinder by the authors. Statistical Science. https://doi.org/10.1214/ss/1009212519
Data sources
Bibliographic data: Semantic Scholar, OpenAlex, Crossref.
Contains information from the Semantic Scholar Academic Graph Datasets, made available under the ODC Attribution License (ODC-BY 1.0).
Semantic Scholar’s data is described in: Kinney, R., et al. (2023). The Semantic Scholar Open Data Platform. arXiv:2301.10140.
