

Technology and Big Data Are Changing Economics: Mining Text to Track Methods
Open accessThe DOI matches its Crossref record; 15 of the 15 references it cites were found in a registry or an index; 2 of the 12 sources its claims cite were checked for support.
Abstract
The last 40 years have seen huge innovations in computing and in the availability of data. Data derived from millions of administrative records or by using (as we do) new methods of data generation such as text mining are now common. New data often requires new methods, which in turn can inspire new data collection. If history is any guide, some methods will stick and others will prove to be a flash in the pan. However, the larger trends toward demanding greater credibility and transparency from researchers in applied economics and a 'collage' approach to assembling evidence will likely continue.
Overview
CoChat Summary
TL;DR
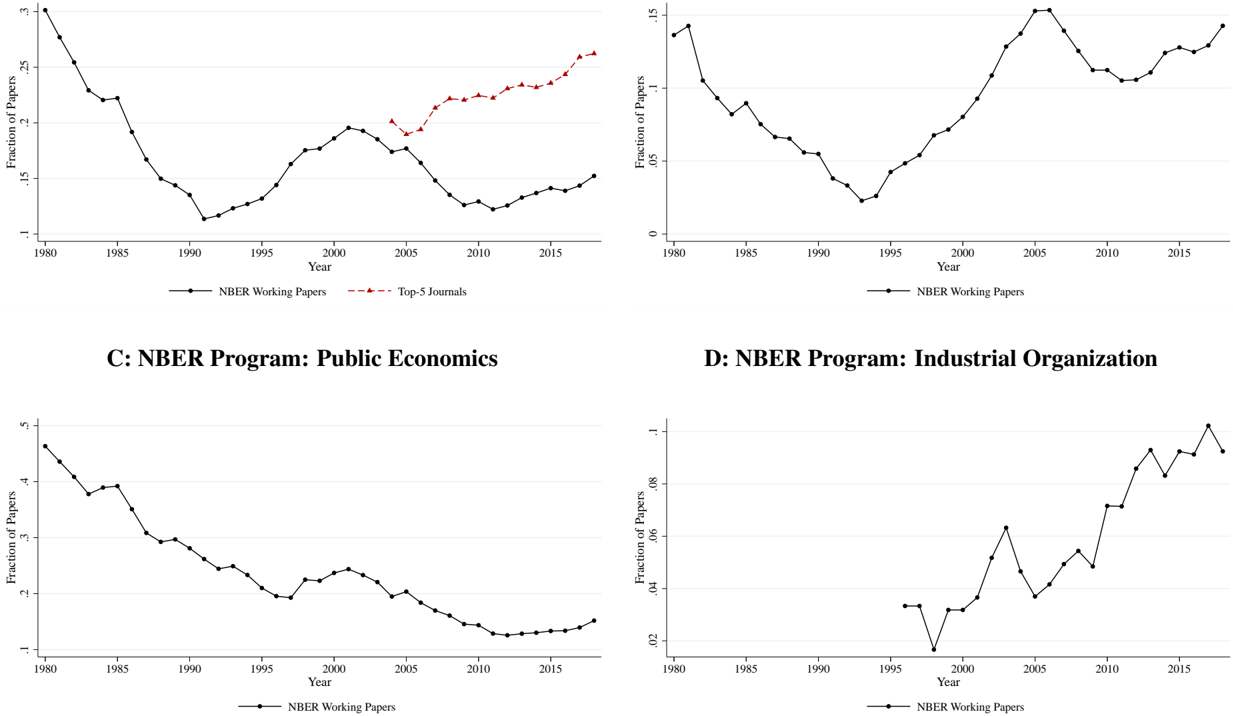
This paper uses text mining on 2,830 top-five journal papers and 10,324 NBER working papers in applied microeconomics to document major shifts in methods and data use over time. It argues that applied economics has become more focused on identification, experiments, administrative data, precision, and combining multiple empirical strategies, consistent with a “credibility revolution” and a “collage” approach.
Key findings
- References to identification rose roughly linearly in both series, from around 4% to 50% of papers.
- References to experimental and quasi-experimental methods also increased: over 40% of NBER papers and about 35% of top-five papers now mention methods such as RCTs, lab experiments, difference-in-differences, regression discontinuity, event studies, or bunching.
- References to administrative data rose from the mid-1990s to about 30% today in the NBER series; the top-five series shows a similar increase with a lag of about three years.
- The paper reports that concern with mechanisms rose from about 20% to about 60% in NBER papers and to more than 70% today in top-five papers; references to “precisely estimated zero” are still only in a little over 1% of papers.
Methods
- The study is a text-mining analysis of economics papers, using regex searches on plain-text versions of papers after removing references sections.
- Sample: all NBER working papers from January 1, 1980 to June 30, 2018 in selected applied micro programs, and all papers in the top-five journals from January 1, 2004 to August 2019; final sample sizes are 10,324 NBER papers and 2,830 top-five papers.
- Main analysis: compute five-year moving averages of the fraction of papers mentioning predefined methods- and data-related trigger phrases (for example, identification, RCTs, administrative data, big data, clustering, fixed effects, structural models).
Limitations
- The authors state that their search algorithms were built by trial and error, and that some Type I and Type II errors may remain; they say this is not a major concern because their focus is on trends rather than levels.
- Their within-paper comparison of NBER papers that were later published in top-five journals uses a matched sample of 610 papers, which they describe as arguably too small to draw firm conclusions.
- Evident from the text: the analysis relies on keyword mentions, so it captures discussion of methods and data rather than direct measures of whether those methods were actually used.
Model-written summary. Check it against the paper before relying on it.
Integrity signals
Registry
Cites
Statistics
Figures




Verification
Claims the paper makes
1 Valid · 3 Not valid · 9 Not checked · 75 Own results and interpretations
A result the paper states — it cites no source for it, so there is none to check. The quote shows it is in the paper.
In the paper
“As a result, the fraction of applied microeconomics papers published in major general interest journals has increased from 55-60% to about 75%.”
plainstates a cause- Asserted: passes — The authors put it forward as true.
- Checkable: passes — It can be checked against evidence.
- Load-bearing: unclear — It is unclear whether the paper’s conclusions depend on it.
- Based: unclear — It is unclear why the paper says it holds.
- Rests on 2 assumptions not shown here.
A result the paper reports from its own data — it cites no other source for it, so there is none to check. The quote shows it is in the paper.
In the paper
“This time pattern mirrors the rise of lab and field experiments quite closely.”
plainstates an association- Asserted: passes — The authors put it forward as true.
- Checkable: passes — It can be checked against evidence.
- Load-bearing: unclear — It is unclear whether the paper’s conclusions depend on it.
- Based: passes — The paper gives a reason why it holds.
- Rests on 2 assumptions not shown here.
A result the paper reports from its own data — it cites no other source for it, so there is none to check. The quote shows it is in the paper.
In the paper
“Panel A shows a sharp rise in the fraction of NBER working papers discussing randomized controlled trials since 2005, and especially since 2010.”
plainstates an association- Asserted: passes — The authors put it forward as true.
- Checkable: passes — It can be checked against evidence.
- Load-bearing: passes — The paper’s conclusions depend on it.
- Based: passes — The paper gives a reason why it holds.
- Rests on 2 assumptions not shown here.
A result the paper reports from its own data — it cites no other source for it, so there is none to check. The quote shows it is in the paper.
In the paper
“The top-five series shows a much gentler rise in RCTs, to about 5 percent of papers by 2019.”
plainstates an association- Asserted: passes — The authors put it forward as true.
- Checkable: passes — It can be checked against evidence.
- Load-bearing: unclear — It is unclear whether the paper’s conclusions depend on it.
- Based: passes — The paper gives a reason why it holds.
- Rests on 2 assumptions not shown here.
A result the paper states — it cites no source for it, so there is none to check. The quote shows it is in the paper.
In the paper
“More recently, the popularity of lab experiments has turned downwards in both series.”
plain- Asserted: passes — The authors put it forward as true.
- Checkable: passes — It can be checked against evidence.
- Load-bearing: unclear — It is unclear whether the paper’s conclusions depend on it.
- Based: passes — The paper gives a reason why it holds.
- Rests on 2 assumptions not shown here.
41 more claims
Create a free account to see all 88 claims and every source verdict.
- It may state two separate claims as one. 22
- Probably not a substantial claim. 22
- The quote only partly states this claim. 2
Citations
Cites
Identification and Estimation of Treatment Effects with a Regression-Discontinuity Design
Hahn, J., Todd, P., & Klaauw, W. (2001) · Econometrica · doi:10.1111/1468-0262.00183 · Cited by 2,679
Angrist, J. D., & Pischke, J.-S. (2010) · Journal of Economic Perspectives · doi:10.1257/jep.24.2.3 · Cited by 1,566
Estimating the Effect of Training Programs on Earnings
Ashenfelter, O. (1978) · The Review of Economics and Statistics · doi:10.2307/1924332 · Cited by 1,515
Using Maimonides' Rule to Estimate the Effect of Class Size on Scholastic Achievement
Angrist, J. D., & Lavy, V. (1999) · The Quarterly Journal of Economics · doi:10.1162/003355399556061 · Cited by 1,482
Using the Longitudinal Structure of Earnings to Estimate the Effect of Training Programs
Ashenfelter, O., & Card, D. (1985) · The Review of Economics and Statistics · doi:10.2307/1924810 · Cited by 1,023
Do Taxpayers Bunch at Kink Points?
Saez, E. (2010) · American Economic Journal: Economic Policy · doi:10.1257/pol.2.3.180 · Cited by 950
Using the Longitudinal Structure of Earnings to Estimate the Effect of Training Programs
Ashenfelter, O., & Card, D. (1984) · National Bureau of Economic Research · doi:10.3386/w1489 · Cited by 876
Kleven, H. J. (2016) · Annual Review of Economics · doi:10.1146/annurev-economics-080315-015234 · Cited by 416
Self-citationHow Does Your Kindergarten Classroom Affect Your Earnings? Evidence From Project STAR
Chetty, R., Friedman, J., Hilger, N., Saez, E., Schanzenbach, D. W., & Yagan, D. (2010) · National Bureau of Economic Research · doi:10.3386/w16381 · Cited by 386
Nine Facts about Top Journals in Economics
Card, D., & DellaVigna, S. (2013) · Journal of Economic Literature · doi:10.1257/jel.51.1.144 · Cited by 333
Cited by
Synthetic Difference-in-Differences
Arkhangelsky, D., Athey, S., Hirshberg, D. A., Imbens, G. W., & Wager, S. (2021) · American Economic Review · doi:10.1257/aer.20190159 · Cited by 1,518
An Introductory Guide to Event Study Models
Miller, D. L. (2023) · Journal of Economic Perspectives · doi:10.1257/jep.37.2.203 · Cited by 360
Advances in Difference-in-differences Methods for Policy Evaluation Research
Wang, G., Hamad, R., & White, J. S. (2024) · Epidemiology · doi:10.1097/ede.0000000000001755 · Cited by 117
The Rise of Research Teams: Benefits and Costs in Economics
Jones, B. F. (2021) · The Journal of Economic Perspectives · doi:10.1257/jep.35.2.191 · Cited by 96
Causal Inference in the Social Sciences
Imbens, G. W. (2023) · Annual Review of Statistics and Its Application · doi:10.1146/annurev-statistics-033121-114601 · Cited by 137
Metadata
- Authors
- Currie, J., Kleven, H., & Zwiers, E.
- Affiliations
- Princeton University (US)
- Venue
- AEA Papers and Proceedings
- Publisher
- American Economic Association
- Published
- 2020-05-01
- Volume
- 110
- Pages
- 42-48
- ISSN
- 2574-0768 (ISSN-L)
- 2574-0776
- OpenAlex
- W3003454468
- Cited by
- 86
- References
- 5
- Citations by year
- 2026: 7 · 2025: 13 · 2024: 10 · 2023: 12 · 2022: 20 · 2021: 16 · 2020: 6
- FWCI
- 38.44
- Type
- journal article
- Language
- en
- Open access
- green
- www.nber.org
- Locations
- AEA Papers and Proceedings (publishedVersion)
- RePEc: Research Papers in Economics (submittedVersion)
- Topics
- Social Sciences › General Social Sciences › Computational and Text Analysis Methods
- Social Sciences › Decision Sciences › Information Systems and Management › Big Data Technologies and Applications
- Physical Sciences › Mathematics › Statistics and Probability › Advanced Causal Inference Techniques
- Keywords
- text mining, administrative data, big data, data collection methods, research credibility, evidence aggregation
About these checks
Registry, retraction, Cites and statistics results are computed, not judged, with one exception: a printed reference that no index lists is read once by a model before it counts as a citation error. Claims are extracted by a model and kept only when their quote appears verbatim in the text; each cited source is then checked, with a model’s help, for whether it says what the claim relies on. Those verdicts can be wrong — read the claim’s quote and the cited source before relying on one.
The claim verdicts this report counts are experimental: their accuracy is not yet measured.
A language model drew the claims from the paper on 2026-10-10, under version 3 of the claim definition (model deepseek-v4.1-flash, prompt extract-v3).
A second model labelled each claim on 2026-10-10 (model jev-1.13-20260917, definition revision gold-guideline-v0.2).
Statistics and arithmetic are recomputed, not judged.
Confidence bands are shown only for fields calibrated on our annotated test set. None is calibrated yet, so no band is shown.
What counts as a claim ›How we measure confidence ›How we check this ›
Are you an author, or do you see a problem with this page? Request a review
Data sources
Bibliographic data: Semantic Scholar, OpenAlex, Crossref.
Contains information from the Semantic Scholar Academic Graph Datasets, made available under the ODC Attribution License (ODC-BY 1.0).
Semantic Scholar’s data is described in: Kinney, R., et al. (2023). The Semantic Scholar Open Data Platform. arXiv:2301.10140.
