

The DOI matches its Crossref record; 44 of the 44 references it cites were found in a registry or an index.
Segmented poly(A) tails significantly reduce recombination of plasmid DNA without affecting mRNA translation efficiency or half-life
Open accessAbstract
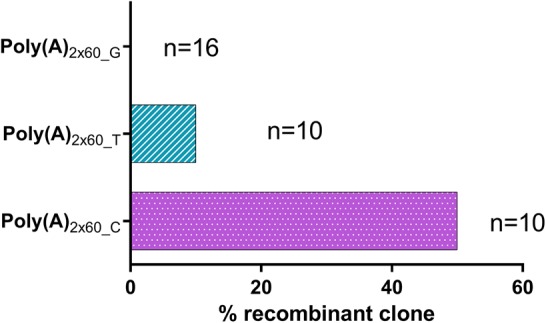
Extensive research in the past decade has brought mRNA closer to the clinical realization of its therapeutic potential. One common structural feature for all cellular messenger RNAs is a poly(A) tail, which can either be brought in cotranscriptionally via the DNA template (plasmid- or PCR-based) or added to the mRNA in a post-transcriptional enzymatic process. Plasmids containing poly(A) regions recombine in E. coli, resulting in extensive shortening of the poly(A) tail. Using a segmented poly(A) approach, we could significantly reduce recombination of plasmids in E. coli without any negative effect on mRNA half-life and protein expression. This effect was independent of the coding sequence. A segmented poly(A) tail is characterized in that it consists of at least two A-containing elements, each defined as a nucleotide sequence consisting of 40–60 adenosines, separated by a spacer element of different length. Furthermore, reducing the spacer length between the poly(A) segments resulted in higher translation efficiencies compared to homogeneous poly(A) tail and reduced recombination (depending upon the choice of spacer nucleotide). Our results demonstrate the superior potential of segmented poly(A) tails compared to the conventionally used homogeneous poly(A) tails with respect to recombination of the plasmids and the resulting mRNA performance (half-life and translational efficiency).
Overview
The claims and statistics of this paper haven’t been checked yet.
Run the check — free, no account needed. It reads the open-access text and checks the sources it cites.
Integrity signals
Registry
Cites
Statistics
Figures
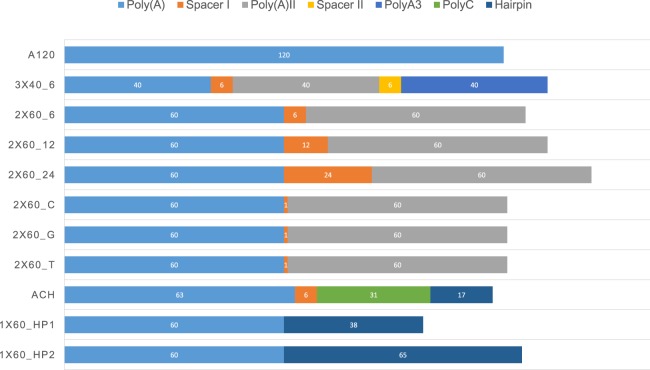
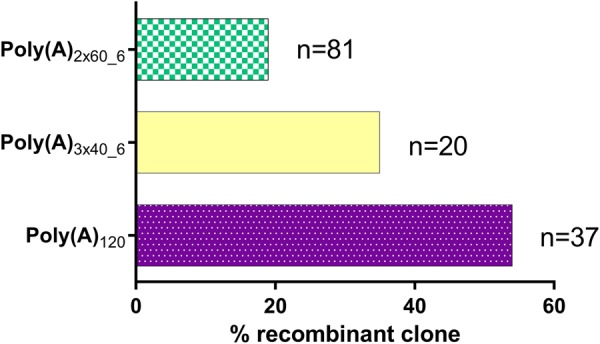
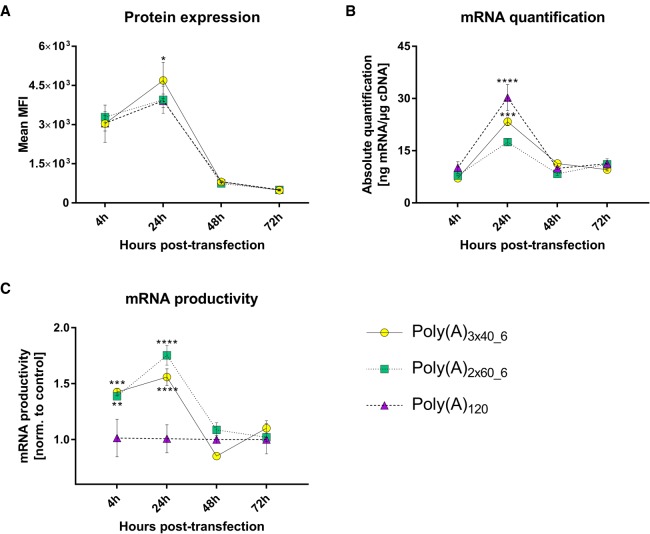
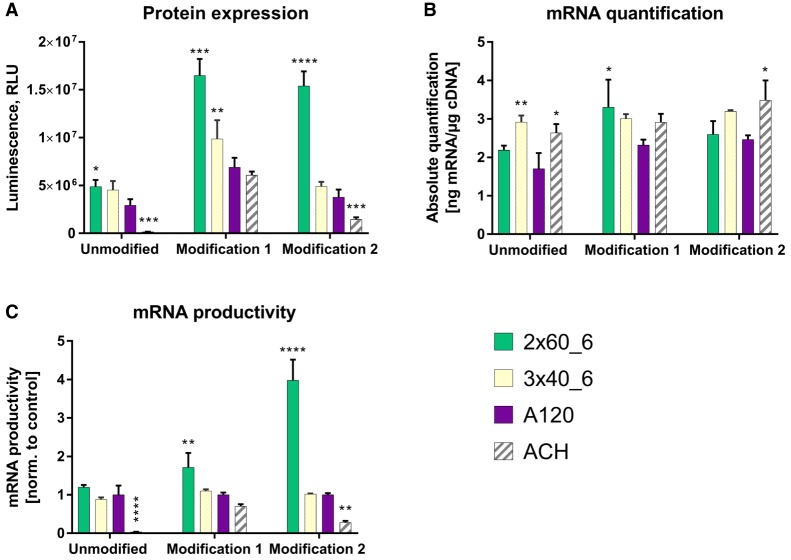
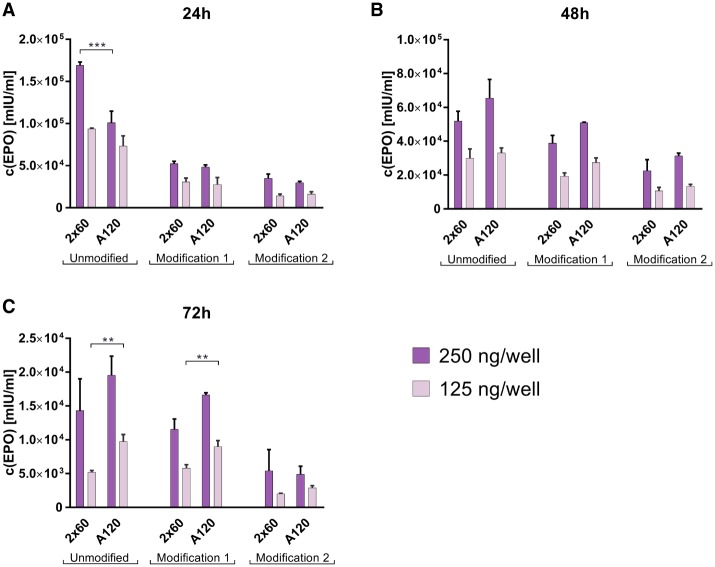
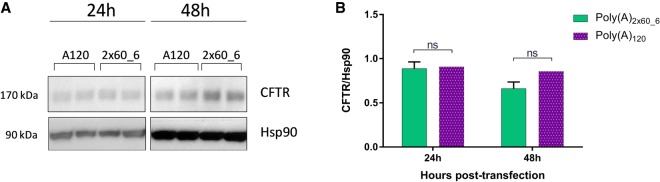
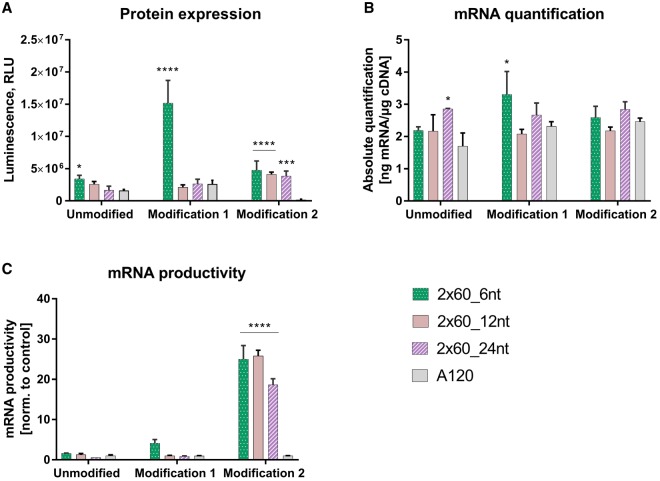
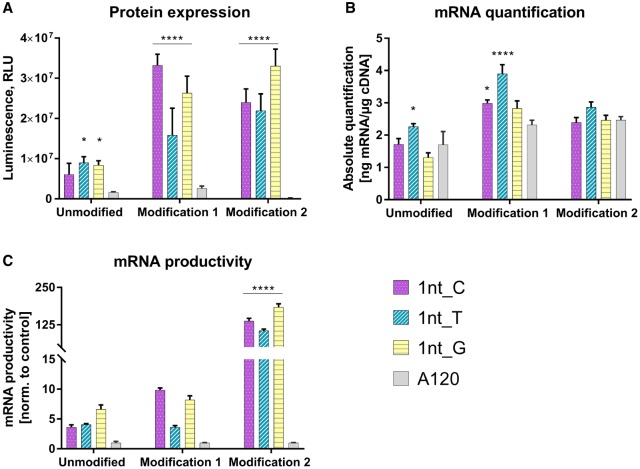
Verification
Claims the paper makes
The claims and statistics of this paper haven’t been checked yet.
Run the check — free, no account needed. It reads the open-access text and checks the sources it cites.
Claims other papers make about this one
Each is checked against this paper’s own text: does it say what the citing paper says it does?
The source backs part of the claim, not all of it — or backs it for a different population, condition or comparison.
In the citing paper
“An alternative strategy has been developed to avoid this instability, consisting of including an internal 10-nucleotide linker into the poly(A) stretch.25,26”
From Combining an optimized mRNA template with a double purification process allows strong expression of in vitro transcribed mRNA (2021) · cites this paper as [26]
Experimental — accuracy not yet measuredIn the citing paper
“Current studies have shown that the segmented poly(A) tail extends mRNA half-life and improves translation efficiency compared to the long-chain poly(A) tail.154”
From Advances in COVID-19 mRNA vaccine development (2022) · cites this paper as [154]
Self-check
Percentages, sums and reported differences re-computed from the paper’s own numbers.
The self-check needs the paper’s full text.
Citations
Cites
Direct Gene Transfer into Mouse Muscle in Vivo
Wolff, J. A., Malone, R. W., Williams, P., Chong, W., Acsadi, G., Jani, A., & Felgner, P. L. (1990) · Science · doi:10.1126/science.1690918 · Cited by 4,173 · cited 1×
“Increasing its stability and translational yields has led to a progress from the first use of encoding a potentially therapeutic protein (Wolff et al. 1990) to preclinical (Bahl et al. 2017; Richner et al. 2017) and clinical applications (Mullard 2016).”
BackgroundKarikó, K., Buckstein, M., Ni, H., & Weissman, D. (2005) · Immunity · doi:10.1016/j.immuni.2005.06.008 · Cited by 2,728
Karikó, K., Muramatsu, H., Welsh, F. A., Ludwig, J., Kato, H., Akira, S., & Weissman, D. (2008) · Molecular Therapy · doi:10.1038/mt.2008.200 · Cited by 1,930
A serious adverse event after successful gene therapy for X-linked severe combined immunodeficiency
Hacein-Bey-Abina, S., von Kalle, C., Schmidt, M., Le Deist, F., Wulffraat, N., McIntyre, E., Radford, I., Villeval, J.-L., Fraser, C. C., Cavazzana-Calvo, M., et al. (2003) · New England Journal of Medicine · doi:10.1056/nejm200301163480314 · Cited by 1,867 · cited 2×
“…gene therapy with DNA-based vectors, use of mRNA offers several advantages, such as transient expression (Kapeli and Yeo 2012; Lodish 2012), lack of necessity to enter the nucleus, and no risk of chromosomal integration (Cannon and Weissman 2002; Hacein-Bey-Abina et al. 2003; Bernal 2013).”
BackgroundCircularization of mRNA by Eukaryotic Translation Initiation Factors
Wells, S. E., Hillner, P. E., Vale, R. D., & Sachs, A. B. (1998) · Molecular Cell · doi:10.1016/s1097-2765(00)80122-7 · Cited by 968
Modified mRNA vaccines protect against zika virus infection
Richner, J. M., Himansu, S., Dowd, K. A., Butler, S. L., Salazar, V., Fox, J. M., Julander, J. G., Tang, W. W., Shresta, S., Pierson, T. C., et al. (2017) · Cell · doi:10.1016/j.cell.2017.02.017 · Cited by 909
Expression of therapeutic proteins after delivery of chemically modified mRNA in mice
Kormann, M. S. D., Hasenpusch, G., Aneja, M. K., Nica, G., Flemmer, A. W., Herber-Jonat, S., Huppmann, M., Mays, L. E., Illenyi, M., Schams, A., et al. (2011) · Nature Biotechnology · doi:10.1038/nbt.1733 · Cited by 733
Self-citationZhang, H., & Maloney, L. T. (2012) · Frontiers in Neuroscience · doi:10.3389/fnins.2012.00001 · Cited by 679
Bahl, K., Senn, J. J., Yuzhakov, O., Bulychev, A., Brito, L. A., Hassett, K. J., Laska, M. E., Smith, M., Almarsson, Ö., Thompson, J., et al. (2017) · Molecular Therapy · doi:10.1016/j.ymthe.2017.03.035 · Cited by 642
Mangus, D. A., Evans, M. C., & Jacobson, A. (2003) · Genome biology · doi:10.1186/gb-2003-4-7-223 · Cited by 629
Research works printed but not linked: 1
- Voet D , Voet JG . 2011. Biochemistry. 4th ed. John Wiley & Sons, New York.
Cited by
Sorted by citations
Advances in COVID-19 mRNA vaccine development
Fang, E., Liu, X., Li, M., Zhang, Z., Song, L., Zhu, B., Wu, X., Liu, J., Zhao, D., & Li, Y. (2022) · Signal Transduction and Targeted Therapy · doi:10.1038/s41392-022-00950-y · Cited by 601
Modifications in an Emergency: The Role of N1-Methylpseudouridine in COVID-19 Vaccines
Nance, K. D., & Meier, J. L. (2021) · ACS Central Science · doi:10.1021/acscentsci.1c00197 · Cited by 466
From influenza to COVID-19: Lipid nanoparticle mRNA vaccines at the frontiers of infectious diseases
Pilkington, E. H., Suys, E. J. A., Trevaskis, N. L., Wheatley, A. K., Zukancic, D., Algarni, A., Al-Wassiti, H. A., Davis, T. P., Pouton, C. W., Kent, S. J., et al. (2021) · Acta Biomaterialia · doi:10.1016/j.actbio.2021.06.023 · Cited by 271
A trans-amplifying RNA vaccine strategy for induction of potent protective immunity
Beissert, T., Perkovic, M., Vogel, A., Erbar, S., Walzer, K. C., Hempel, T., Brill, S., Haefner, E., Becker, R., Türeci, Ö., et al. (2020) · Molecular Therapy · doi:10.1016/j.ymthe.2019.09.009 · Cited by 212
Recent Advances in Lipid Nanoparticles for Delivery of mRNA
Yang, L., Gong, L., Wang, P., Zhao, X., Zhao, F. H., Zhang, Z., Li, Y., & Huang, W. (2022) · Pharmaceutics · doi:10.3390/pharmaceutics14122682 · Cited by 190
Wang, Y., Kumari, M., Chen, G., Hong, M.-H., Yuan, J. P., Tsai, J.-L., & Wu, H. (2023) · Journal of Biomedical Science · doi:10.1186/s12929-023-00977-5 · Cited by 198
Tailor made: the art of therapeutic mRNA design
Metkar, M., Pepin, C. S., & Moore, M. J. (2023) · Nature Reviews Drug Discovery · doi:10.1038/s41573-023-00827-x · Cited by 158
Zhang, H., Vandesompele, J., Braeckmans, K., Smedt, S. C. D., & Remaut, K. (2023) · Chemical Society Reviews · doi:10.1039/d3cs00194f · Cited by 146
Esprit, A., de Mey, W., Shahi, R. B., Thielemans, K., Franceschini, L., & Breckpot, K. (2020) · Vaccines · doi:10.3390/vaccines8040776 · Cited by 112
Chemical Modifications of mRNA Ends for Therapeutic Applications
Warminski, M., Mamot, A., Depaix, A., Kowalska, J., & Jemielity, J. (2023) · Accounts of Chemical Research · doi:10.1021/acs.accounts.3c00442 · Cited by 91
Recent progress in mRNA cancer vaccines
Yao, R., Xie, C., & Xia, X. (2024) · Human Vaccines & Immunotherapeutics · doi:10.1080/21645515.2024.2307187 · Cited by 91
Eliciting antitumor immunity via therapeutic cancer vaccines
Peng, K., Zhao, X., Fu, Y., & Liang, Y. (2025) · Cellular and Molecular Immunology · doi:10.1038/s41423-025-01316-4 · Cited by 104
The mRNA Vaccine Revolution: COVID-19 Has Launched the Future of Vaccinology
Ye, Z., Harmon, J., Ni, W., Li, Y., Wich, D., & Xu, Q. (2023) · ACS Nano · doi:10.1021/acsnano.2c12584 · Cited by 72
Maximizing mRNA vaccine production with Bayesian optimization
Rosa, S. S., Nunes, D., Antunes, L., Prazeres, D. M. F., Marques, M. P. C., & Azevedo, A. M. (2022) · Biotechnology and Bioengineering · doi:10.1002/bit.28216 · Cited by 70
mRNA Therapeutic Modalities Design, Formulation and Manufacturing under Pharma 4.0 Principles
Ouranidis, A., Vavilis, T., Mandala, E., Davidopoulou, C., Stamoula, Ε., Markopoulou, C. K., Karagianni, A., & Kachrimanis, K. (2021) · Biomedicines · doi:10.3390/biomedicines10010050 · Cited by 75
mRNA vaccine quality analysis using RNA sequencing
Gunter, H. M., Idrisoglu, S., Singh, S., Han, D. J., Ariens, E., Peters, J. R., Wong, T., Cheetham, S. W., Xu, J., Rai, S. K., et al. (2023) · Nature Communications · doi:10.1038/s41467-023-41354-y · Cited by 69
Yan, J., Wang, S.-Y., Su, Q., Zou, M.-W., Zhou, Z.-Y., Shou, J., & Huo, Y. (2025) · Nature Communications · doi:10.1038/s41467-025-59093-7 · Cited by 62
Linares-Fernández, S., Moreno, J., Lambert, E., Mercier-Gouy, P., Vachez, L., Verrier, B., & Exposito, J.-Y. (2021) · Molecular Therapy - Nucleic Acids · doi:10.1016/j.omtn.2021.10.007 · Cited by 62
Enabling mRNA Therapeutics: Current Landscape and Challenges in Manufacturing
Youssef, M., Hitti, C., Fulber, J. P. C., & Kamen, A. (2023) · Biomolecules · doi:10.3390/biom13101497 · Cited by 63
An Update on mRNA-Based Viral Vaccines
Jeeva, S., Kim, K., Shin, C. H., Wang, B., & Kang, S. (2021) · Vaccines · doi:10.3390/vaccines9090965 · Cited by 49
Characterization of mRNA therapeutics
Guimaraes, G. J., Kim, J., & Bartlett, M. G. (2023) · Mass Spectrometry Reviews · doi:10.1002/mas.21856 · Cited by 50
Computational design of mRNA vaccines
Kim, Y.-A., Mousavi, K., Yazdi, A. K., Zwierzyna, M., Cardinali, M., Fox, D. M., Peel, T., Coller, J., Aggarwal, K., & Maruggi, G. (2023) · Vaccine · doi:10.1016/j.vaccine.2023.07.024 · Cited by 47
mRNA Vaccines: Why Is the Biology of Retroposition Ignored?
Domazet‐Lošo, T. (2022) · Genes · doi:10.3390/genes13050719 · Cited by 47
Webb, A. L. J., Welbourne, E. N., Evans, C. A., & Dickman, M. J. (2025) · Journal of Chromatography A · doi:10.1016/j.chroma.2025.465724 · Cited by 51
Therapeutic synthetic and natural materials for immunoengineering
Slezak, A., Chang, K., Hossainy, S., Mansurov, A., Rowan, S. J., Hubbell, J. A., & Guler, M. O. (2024) · Chemical Society Reviews · doi:10.1039/d3cs00805c · Cited by 44
In Vitro Transcribed RNA-Based Platform Vaccines: Past, Present, and Future
Perenkov, A. D., Sergeeva, A. D., Vedunova, M. V., & Krysko, D. V. (2023) · Vaccines · doi:10.3390/vaccines11101600 · Cited by 40
Synthetic mRNA – emerging new class of drug for tissue regeneration
Balmayor, E. R. (2021) · Current Opinion in Biotechnology · doi:10.1016/j.copbio.2021.10.015 · Cited by 36
Zhang, J., Liu, Y., Li, C., Xiao, Q., Zhang, D., Chen, Y., Rosenecker, J., Ding, X., & Guan, S. (2023) · Pharmaceutics · doi:10.3390/pharmaceutics15092182 · Cited by 39
Selective Xi reactivation and alternative methods to restore MECP2 function in Rett syndrome
Grimm, N.-B., & Lee, J. T. (2022) · Trends in Genetics · doi:10.1016/j.tig.2022.01.007 · Cited by 34
mRNA-Based Vaccines and Mode of Action
Gergen, J., & Petsch, B. (2020) · Current topics in microbiology and immunology · doi:10.1007/82_2020_230 · Cited by 36
Ige, M. A., Ren, X., Yang, Y., Zhang, H., Shen, C., Jiang, Y., Li, J., & Wan, X. (2025) · Molecular Therapy — Nucleic Acids · doi:10.1016/j.omtn.2025.102721 · Cited by 30
Advancing mRNA technologies for therapies and vaccines: An African context
Kairuz, D., Samudh, N., Ely, A., Arbuthnot, P., & Bloom, K. (2022) · Frontiers in Immunology · doi:10.3389/fimmu.2022.1018961 · Cited by 25
Recent Advancements in mRNA Vaccines: From Target Selection to Delivery Systems
Wu, Z., Sun, W., & Qi, H. (2024) · Vaccines · doi:10.3390/vaccines12080873 · Cited by 30
Grandi, D. D., Dayeh, D. M., Kaur, K., Chen, Y., Henderson, S., Moon, Y., Bhowmick, A., Ihnat, P. M., Fu, Y., Muthusamy, K., et al. (2023) · Journal of Pharmaceutical and Biomedical Analysis · doi:10.1016/j.jpba.2023.115692 · Cited by 23
mRNA Technology and Mucosal Immunization
Toniolo, A., Maccari, G., & Camussi, G. (2024) · Vaccines · doi:10.3390/vaccines12060670 · Cited by 23
mRNA vaccines: immunogenicity and quality characteristics
Quan, Y., Yang, H., Li, W., & Li, L. X. (2025) · Journal of Nanobiotechnology · doi:10.1186/s12951-025-03800-5 · Cited by 27
Comprehensive analysis of mRNA poly(A) tails by PAIso-seq2
Liu, Y., Nie, H., Zhang, Y., Lu, F., & Wang, J. (2022) · Science China Life Sciences · doi:10.1007/s11427-022-2186-8 · Cited by 22
Comprehensive evaluation of T7 promoter for enhanced yield and quality in mRNA production
Sari, Y., Rosa, S. S., Jeffries, J. W. E., & Marques, M. P. C. (2024) · Scientific Reports · doi:10.1038/s41598-024-59978-5 · Cited by 24
mRNA-based therapies: Preclinical and clinical applications
Qureischi, M., Mohr, J., Arellano-Viera, E., Knudsen, S. E., Vohidov, F., & Garitano-Trojaola, A. (2022) · International review of cytology · doi:10.1016/bs.ircmb.2022.04.007 · Cited by 21
An mRNA vaccine against rabies provides strong and durable protection in mice
Li, M., Fang, E., Wang, Y., Shi, L., Li, J., Peng, Q., Li, X., Zhao, D., Liu, X., Liu, X., et al. (2023) · Frontiers in Immunology · doi:10.3389/fimmu.2023.1288879 · Cited by 20
Emerging mRNA Technology for Liver Disease Therapy
Wang, J., Fang, Y., Luo, Z., Wang, J., & Zhao, Y. (2024) · ACS Nano · doi:10.1021/acsnano.4c02987 · Cited by 20
Piao, X., Tang, Y., Li, X., Zhang, W., Yang, W., Xu, X., Wang, W., Jiang, J., Xu, J., Hu, K., et al. (2024) · Molecular Therapy — Nucleic Acids · doi:10.1016/j.omtn.2024.102223 · Cited by 17
Comprehensive analysis of mRNA poly(A) tail reveals complex and conserved regulationPreprint
Liu, Y., Nie, H., Zhang, Y., Lu, F., & Wang, J. (2021) · bioRxiv (Cold Spring Harbor Laboratory) · doi:10.1101/2021.08.29.458068 · Cited by 16
Nakayama, H., Nobe, Y., Koike, M., & Taoka, M. (2022) · Analytical Chemistry · doi:10.1021/acs.analchem.2c04323 · Cited by 17
Solodushko, V., & Fouty, B. (2023) · Gene Therapy · doi:10.1038/s41434-023-00391-4 · Cited by 18
Translation of in vitro-transcribed RNA therapeutics
von der Haar, T., Mulroney, T. E., Hedayioglu, F. D. L., Kurusamy, S., Rust, M., Lilley, K. S., Thaventhiran, J. E. D., Willis, A. E., & Smales, C. M. (2023) · Frontiers in Molecular Biosciences · doi:10.3389/fmolb.2023.1128067 · Cited by 14
mRNA Cancer Vaccines: From Pandemic Paradigm to Personalized Oncology Therapeutics
Yang, B., Liu, J., Yang, L., & Liu, X. (2025) · Cancer Innovation · doi:10.1002/cai2.70041 · Cited by 18
Recent Advances in Messenger Ribonucleic Acid (mRNA) Vaccines and Their Delivery Systems: A Review
Belay, W. Y., Nibret, G., & Aschale, Y. (2023) · Clinical Pharmacology Advances and Applications · doi:10.2147/cpaa.s418314 · Cited by 16
Strezsak, S. R., Pimentel, A. J., Hill, I. T., Beuning, P. J., & Skizim, N. J. (2022) · ACS Omega · doi:10.1021/acsomega.2c00185 · Cited by 13
Poly(A) tale: From A to A; RNA polyadenylation in prokaryotes and eukaryotes
Mofayezi, A., Jadaliha, M., Zangeneh, F., & Khoddami, V. (2024) · Wiley Interdisciplinary Reviews - RNA · doi:10.1002/wrna.1837 · Cited by 12
Sun, Y., Wang, L., Osire, T., Fu, W., Yi, G., Yang, S., Yang, T., & Rao, Z. (2021) · Applied and Environmental Microbiology · doi:10.1128/aem.00543-21 · Cited by 12
Research progress of mRNA vaccines for infectious diseases
Zhang, Z., Du, J., Zhang, D., Han, R., Wu, X., & Liang, Y. (2025) · European journal of medical research · doi:10.1186/s40001-025-03060-x · Cited by 19
Comprehensive chromatographic assessment of forced degraded in vitro transcribed mRNA
Dayeh, D. M., Cika, J., Moon, Y., Henderson, S., Grandi, D. D., Fu, Y., Muthusamy, K., Palackal, N. T., Ihnat, P. M., & Pyles, E. A. (2024) · Journal of Chromatography A · doi:10.1016/j.chroma.2024.464885 · Cited by 11
Higham, S. L., Wang, Z., Murugaiah, V., Song, J., Thomas, C., Zhang, H., Uta Griesenbach, D., Alton, E. W. F. W., Granger, L. A., Esparza, A. F., et al. (2025) · npj Vaccines · doi:10.1038/s41541-025-01202-0 · Cited by 11
Subbarayan, R., Srinivasan, D., Balakrishnan, R., Kumar, A., Usmani, S. S., & Srivastava, N. (2024) · International review of cytology · doi:10.1016/bs.ircmb.2024.05.001 · Cited by 9
From Sequence to System: Enhancing IVT mRNA Vaccine Effectiveness through Cutting-Edge Technologies
Xu, L., Li, C., Liao, R., Xiao, Q., Wang, X., Zhao, Z., Zhang, W., Ding, X., Cao, Y., Cai, L., et al. (2024) · Molecular Pharmaceutics · doi:10.1021/acs.molpharmaceut.4c00863 · Cited by 9
Sokhangouy, S. K., Behzadi, M., Rezaei, S., Farjami, M., Haghshenas, M., Sefidbakht, Y., & Mozaffari‐Jovin, S. (2025) · Biotechnology Journal · doi:10.1002/biot.202400596 · Cited by 9
Śpiewla, T., Czubak, K., Pilch, Z., Baranowski, M. R., Krawczyk, P. S., Affek, K., Antczak, W., Szulc-Gasiorowska, M., Chmielinski, S., Mroczek, S., et al. (2025) · Nucleic Acids Research · doi:10.1093/nar/gkaf1412 · Cited by 13
Deo, S., Desai, K., Patare, A., Wadapurkar, R. M., Rade, S., Mahudkar, S., Sathe, M., Srivastava, S., Prasanna, P., & Singh, A. (2023) · Biochemical and Biophysical Research Communications · doi:10.1016/j.bbrc.2023.09.016 · Cited by 9
Chien, K. R., Foo, K. S., & Witman, N. (2026) · Nature Reviews Drug Discovery · doi:10.1038/s41573-026-01459-7 · Cited by 12
Thornhill-Wadolowski, E., Ruter, D. L., Yan, F., Gajera, M., Kurt, E., Samanta, L., Leigh, K., Zhu, J., Guo, Z., Wang, Z., et al. (2025) · Vaccines · doi:10.3390/vaccines13060628 · Cited by 8
Advancing ORFV‐Based Therapeutics to the Clinical Stage
Helmold, M., & Amann, R. (2025) · Reviews in Medical Virology · doi:10.1002/rmv.70038 · Cited by 7
mRNA as a Therapeutics: Understanding mRNA Vaccines
Oğuz, F., & Atmaca, H. (2021) · Advanced Pharmaceutical Bulletin · doi:10.34172/apb.2022.028 · Cited by 8
PolyAtailor: measuring poly(A) tail length from short-read and long-read sequencing data
Liu, M., Hao, L., Yang, S., & Wu, X. (2022) · Briefings in Bioinformatics · doi:10.1093/bib/bbac271 · Cited by 7
mRNA Galsomes Vaccine Protects Budgerigars Against Virulent Chlamydia psittaci Challenge
Meyst, A. D., Mieghem, J. V., Chiers, K., Raemdonck, K., Verbeke, R., Lentacker, I., & Vanrompay, D. C. G. (2025) · Vaccines · doi:10.3390/vaccines13020206 · Cited by 7
Watts, J. K. (2022) · Royal Society of Chemistry eBooks · doi:10.1039/9781837671328-00350 · Cited by 6
Genomic Designs of rAAVs Contribute to Pathological Changes in the Livers and Spleens of Mice
Mulcrone, P. L., Zhang, J., Pride, P. M., Lam, A. K., Frabutt, D. A., Ball-Kell, S. M., & Xiao, W. (2022) · Advances in Cell and Gene Therapy · doi:10.1155/2022/6807904 · Cited by 7
A generative framework for enhanced cell-type specificity in rationally designed mRNAsPreprint
Khoroshkin, M., Zinkevich, A. O., Aristova, E., Yousefi, H., Lee, S. B., Mittmann, T., Manegold, K., Penzar, D., Raleigh, D. R., Kulakovskiy, I. V., et al. (2024) · bioRxiv (Cold Spring Harbor Laboratory) · doi:10.1101/2024.12.31.630783 · Cited by 8
The stability landscape of mRNA vaccines: challenges and mitigation strategies
Zhong, L., Tao, L., Zhai, Z., Liao, L., Shi, C., Yao, S., & Liu, X. (2026) · Vaccine · doi:10.1016/j.vaccine.2026.128515 · Cited by 6
Multi-Attribute Monitoring of Therapeutic mRNA by Liquid Chromatography–Mass Spectrometry
Menneteau, T., Butré, C. I., Mouvet, D., & Delobel, A. (2023) · LCGC Europe · doi:10.56530/lcgc.eu.fd3584v4 · Cited by 6
Oliveira, A. S. D., Versteeg, L., Briggs, N., Adhikari, R., Villar, M. J., Redd, J. R., Hotez, P. J., Bottazzi, M. E., & Pollet, J. B. K. (2025) · PLoS neglected tropical diseases · doi:10.1371/journal.pntd.0012809 · Cited by 6
Solodushko, V., Kim, J. H., & Fouty, B. (2025) · Gene Therapy · doi:10.1038/s41434-025-00521-0 · Cited by 5
Future prospects in mRNA vaccine development
Mbatha, L. S., Akinyelu, J., Maiyo, F., & Kudanga, T. (2023) · Biomedical Materials · doi:10.1088/1748-605x/aceceb · Cited by 7
A (RP)UHPLC/UV analytical method to quantify dsRNA during the mRNA vaccine manufacturing process
Rosa, S. S., Zhang, S., Sari, Y., & Marques, M. P. C. (2024) · Analytical Methods · doi:10.1039/d4ay00560k · Cited by 6
mRNArchitect : sequence design of mRNA medicinesPreprint
Budzinska, M. A., Zardbani, M., Michelle, P. S., Waterhouse, J., Leonard, T. E., Ghodasara, A., Das, S. L., Chang, R. Y. K., Chaudhary, N., Cheetham, S. W., et al. (2024) · bioRxiv (Cold Spring Harbor Laboratory) · doi:10.1101/2024.12.03.626696 · Cited by 5
Turihi, N. A., Allouche, D., Quéré, M., Scuiller, M., & Legastelois, I. (2024) · Analytical and Bioanalytical Chemistry · doi:10.1007/s00216-024-05654-6 · Cited by 4
Design and Expression of Fasciola hepatica Multiepitope Constructs Using mRNA Vaccine Technology
Sánchez‐Montejo, J., Strilets, T., Manzano-Román, R., López‐Abán, J., García-Blanco, M. A., Vicente, B., & Muro, A. (2025) · International Journal of Molecular Sciences · doi:10.3390/ijms26031190 · Cited by 5
Chen, H., Qin, W., Bao, H., Chen, X., Ye, X., Wang, Y., Liu, L., Zhang, Y., Sun, Y., Zhang, T., et al. (2025) · Molecular Therapy — Nucleic Acids · doi:10.1016/j.omtn.2025.102809 · Cited by 3
Zhang, Y., Zhang, J.-P., & Zhang, X.-B. (2026) · Frontiers in Bioengineering and Biotechnology · doi:10.3389/fbioe.2026.1838589 · Cited by 3
Chiu, C.-T., Tsai, H., Chen, J.-Y., Hu, C. J., & Chen, H. (2024) · International Journal of Nanomedicine · doi:10.2147/ijn.s463546 · Cited by 3
Kállai, B. M., Sawasaki, T., Endo, Y., & Mészáros, T. (2025) · International Journal of Molecular Sciences · doi:10.3390/ijms26083577 · Cited by 3
Zimmermann, L., & Erbar, S. (2024) · Methods in molecular biology · doi:10.1007/978-1-0716-3770-8_5 · Cited by 3
Seo, J., Park, H., Oh, A., Jeong, C. B., Kim, S., Lee, S., Kim, C., Chang, H., Nam, J., & Park, D. (2025) · Molecular Therapy · doi:10.1016/j.ymthe.2025.06.033 · Cited by 3
The transcription factor BCL11B drives NK cell cytotoxicity and antitumor activity
Kumar, A., Zhang, B., Baldys, A. M., Fischer, C., Lenvik, A. J., Felices, M., Davis, Z., Bendzick, L. E., Weis, A., Bryceson, Y. T., et al. (2025) · The Journal of Immunology · doi:10.1093/jimmun/vkaf179 · Cited by 2
Batho, C. A. P., Hudson, J. E., & Wilson, C. H. (2025) · Biochemical Society Transactions · doi:10.1042/bst20243001 · Cited by 3
mRNA therapeutics for central nervous system disorders
Fukushima, Y., & Itaka, K. (2022) · Drug Delivery System · doi:10.2745/dds.37.247 · Cited by 2
A Basic Method for Formulating mRNA-Lipid Nanoparticle Vaccines in the Lab
Jarzębska, N. T., Frei, J., Mellett, M., Kündig, T. M., Pascolo, S., & Reichmuth, A. M. (2024) · Methods in molecular biology · doi:10.1007/978-1-0716-3770-8_11 · Cited by 2
The rational design of mRNA vaccine: From empirical method to artificial intelligence-based design
Hu, Y., Pu, C., Liu, B., & Zhang, L. (2024) · Chinese Science Bulletin (Chinese Version) · doi:10.1360/tb-2024-0478 · Cited by 2
Experimental considerations for precise RNA-mediated insertion of transgenes
Palm, S. M., Treeck, B. V., & Collins, K. (2024) · Methods in enzymology on CD-ROM/Methods in enzymology · doi:10.1016/bs.mie.2024.07.007 · Cited by 2
Antitumor mRNA vaccines based on neoantigens
Starostina, E. V., Nizolenko, L. F., Карпенко, Л. И., & Ilyichev, A. A. (2025) · Siberian Journal of Oncology · doi:10.21294/1814-4861-2024-23-6-149-158 · Cited by 2
Advancing Protein‐Coding RNA Engineering: From Structural Refinement to Biomedical Implementation
Lu, X., Li, S., Chi, Y., Lin, S., Yuan, H., Lin, Z., Xiao, Y., Yin, H., Zuo, X., Cheng, R., et al. (2025) · Biotechnology Journal · doi:10.1002/biot.70038 · Cited by 2
Ward, R. W., Ananthanarayanan, A., Bhardwaj, N., & Vabret, N. (2025) · Methods in molecular biology · doi:10.1007/978-1-0716-4742-4_5 · Cited by 2
Preparation of Synthetic mRNAs—Overview and Considerations
Chan, S., & Roy, B. (2022) · RNA technologies · doi:10.1007/978-3-031-08415-7_9 · Cited by 2
RECENT APPROACHES IN DEVELOPMENT OF RNA AND DNA BASED VACCINES
(2022) · International Journal of Veterinary Science · doi:10.47278/book.ahp/2022.52 · Cited by 2
mRNA vaccines: a powerful tool in cancer treatment
Qian, J. (2024) · International Conference on Biological Engineering and Medical Science (ICBioMed) · doi:10.1117/12.3012829 · Cited by 2
Targeted Delivery of RNA-Based Therapeutics Enables Functional Analysis of Macrophage SubpopulationsPreprint
Rasmussen, R. K., Gudbergsson, J. M., Mathiesen, H., Strauss, L. M., Holten‐Møller, I., Thomsen, M. B., Kristensen, M. W., Andersen, M. N., & Etzerodt, A. (2025) · bioRxiv (Cold Spring Harbor Laboratory) · doi:10.1101/2025.03.12.642907 · Cited by 2
Sengupta, A. (2022) · Elsevier eBooks · doi:10.1016/b978-0-323-91814-5.00007-6 · Cited by 1
Cui, J., Qiaerxie, G., Qin, H., Long, F., Wang, X., Zhixin, Y., Du, P., & Cui, Y. (2023) · Archives of Pharmacy and Pharmaceutical Sciences · doi:10.29328/journal.apps.1001038 · Cited by 1
Sánchez‐Montejo, J., Teodósio, C., Strilets, T., López‐Abán, J., Manzano-Román, R., Pozo, J., Martín, S., Silos, L., Trujillo-Rodríguez, I., García-Blanco, M. A., et al. (2025) · Frontiers in Immunology · doi:10.3389/fimmu.2025.1693674 · Cited by 2
mRNA-based immunotherapy platform targeting endometrial cancer
Freyberg, M., Dierks, M., Naß, N., George, C., Geffken, M., Ignatov, A., Kalinski, T., & Ignatova, Z. (2025) · Journal of Translational Medicine · doi:10.1186/s12967-025-07497-w · Cited by 2
Metadata
- Authors
- Trepotec, Z., Geiger, J., Plank, C., Aneja, M. K., & Rudolph, C.
- Affiliations
- Ethris (Germany) (DE)
- TUM Klinikum (DE)
- Venue
- RNA
- Publisher
- Cold Spring Harbor Laboratory
- Published
- 2019-01-15
- Volume
- 25
- Issue
- 4
- Pages
- 507-518
- ISSN
- 1355-8382 (ISSN-L)
- 1469-9001
- PMC
- PMC6426288
- OpenAlex
- W2910680408
- Cited by
- 129
- References
- 44
- Citations by year
- 2026: 20 · 2025: 29 · 2024: 25 · 2023: 22 · 2022: 20 · 2021: 10 · 2020: 2 · 2019: 1
- FWCI
- 2.73
- Type
- journal article
- Language
- en
- Open access
- bronze
- doi.org
- Locations
- RNA (publishedVersion)
- Europe PMC (PubMed Central) (publishedVersion, cc-by-nc)
- PubMed Central (publishedVersion, cc-by-nc)
- PubMed (publishedVersion)
- mediaTUM (Technical University of Munich) (submittedVersion, other-oa)
- mediaTUM – the media and publications repository of the Technical University Munich (Technical University Munich) (submittedVersion)
- Funders
- NIM Excellence Cluster
- Topics
- Life Sciences › Biochemistry, Genetics and Molecular Biology › Molecular Biology › RNA and protein synthesis mechanisms
- Life Sciences › Biochemistry, Genetics and Molecular Biology › Molecular Biology › RNA Research and Splicing
- Life Sciences › Biochemistry, Genetics and Molecular Biology › Molecular Biology › RNA Interference and Gene Delivery
- Keywords
- poly(A) tail, plasmid recombination, Escherichia coli, mRNA half-life, translation efficiency, spacer length, mRNA therapeutics, plasmid DNA
- MeSH terms
- A549 Cells, Animals, Base Sequence, Escherichia coli, Genetic Engineering, Half-Life, Humans, Plasmids, Poly A, Recombination, Genetic, RNA, Messenger, Transfection, Protein Biosynthesis, HEK293 Cells
About these checks
Registry, retraction, Cites and statistics results are computed, not judged, with one exception: a printed reference that no index lists is read once by a model before it counts as a citation error. Claims are extracted by a model and kept only when their quote appears verbatim in the text; each cited source is then checked, with a model’s help, for whether it says what the claim relies on. Those verdicts can be wrong — read the claim’s quote and the cited source before relying on one.
Statistics and arithmetic are recomputed, not judged.
Confidence bands are shown only for fields calibrated on our annotated test set. None is calibrated yet, so no band is shown.
What counts as a claim ›How we measure confidence ›How we check this ›
Are you an author, or do you see a problem with this page? Request a review
