

The DOI matches its Crossref record; 6 of the 6 references it cites were found in a registry or an index.
The structure of the human LACTB filament reveals the mechanisms of assembly and membrane binding
Open accessPublished version of a preprint
Abstract
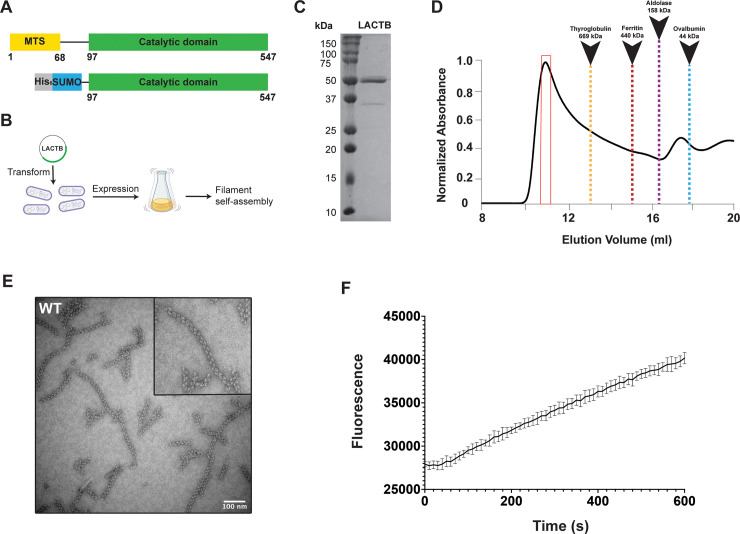
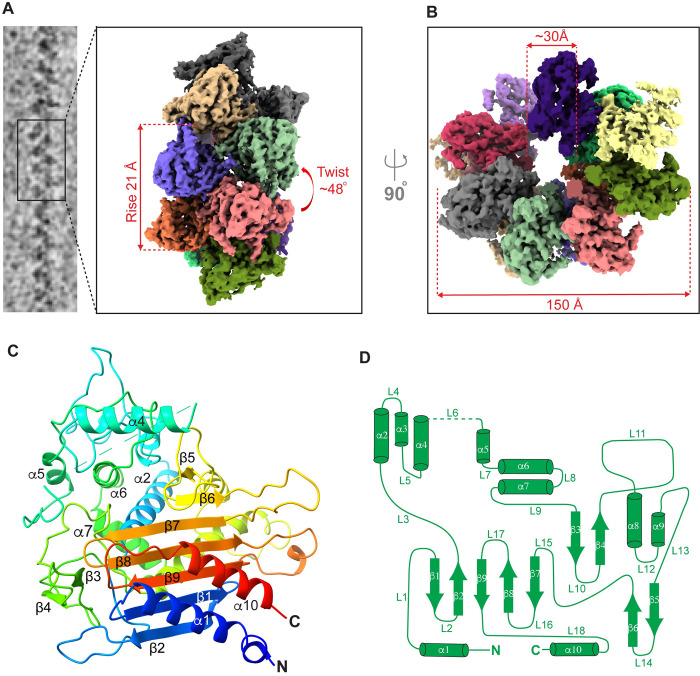
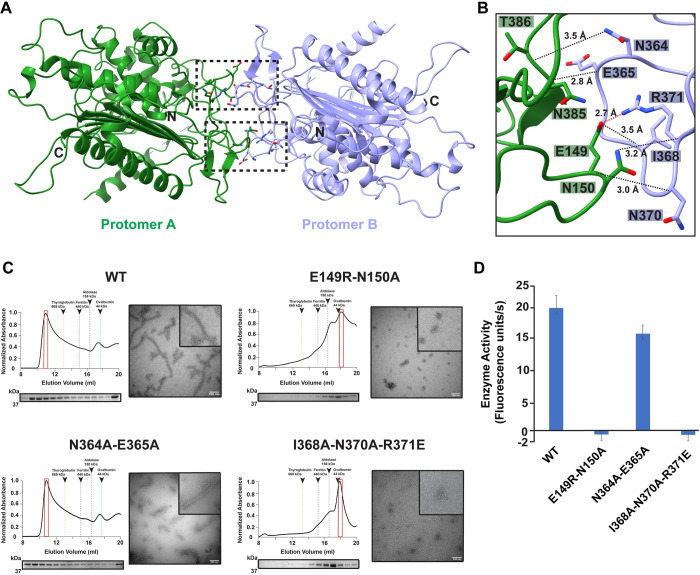
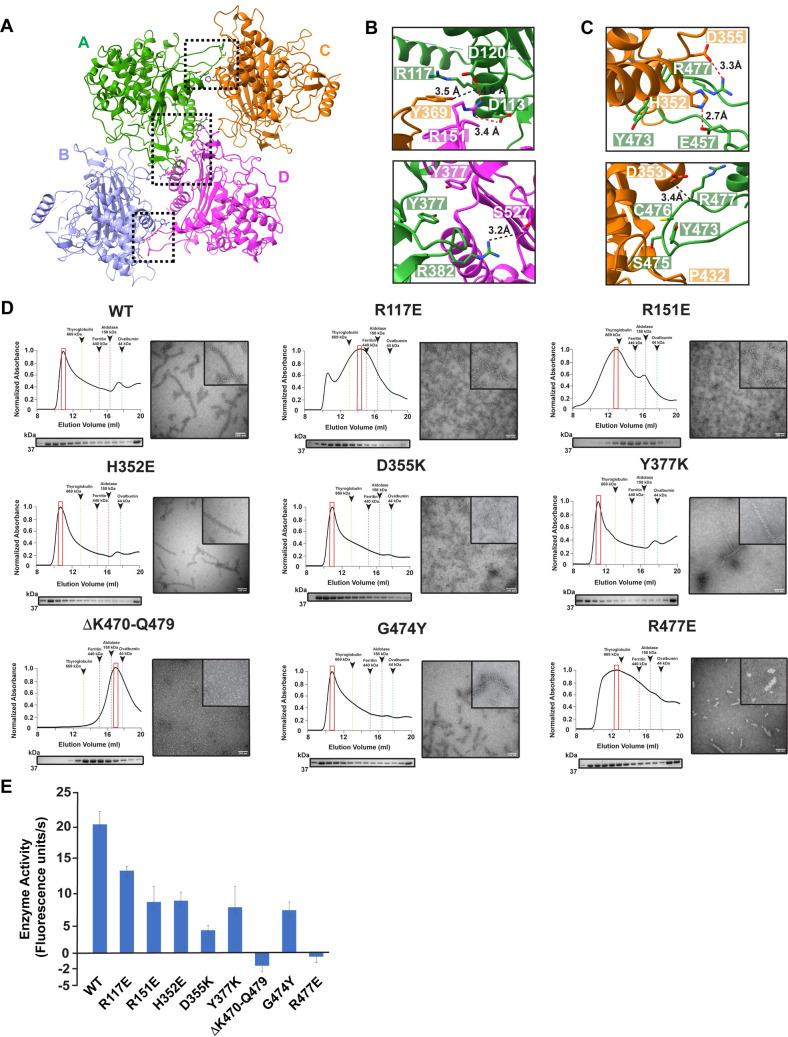
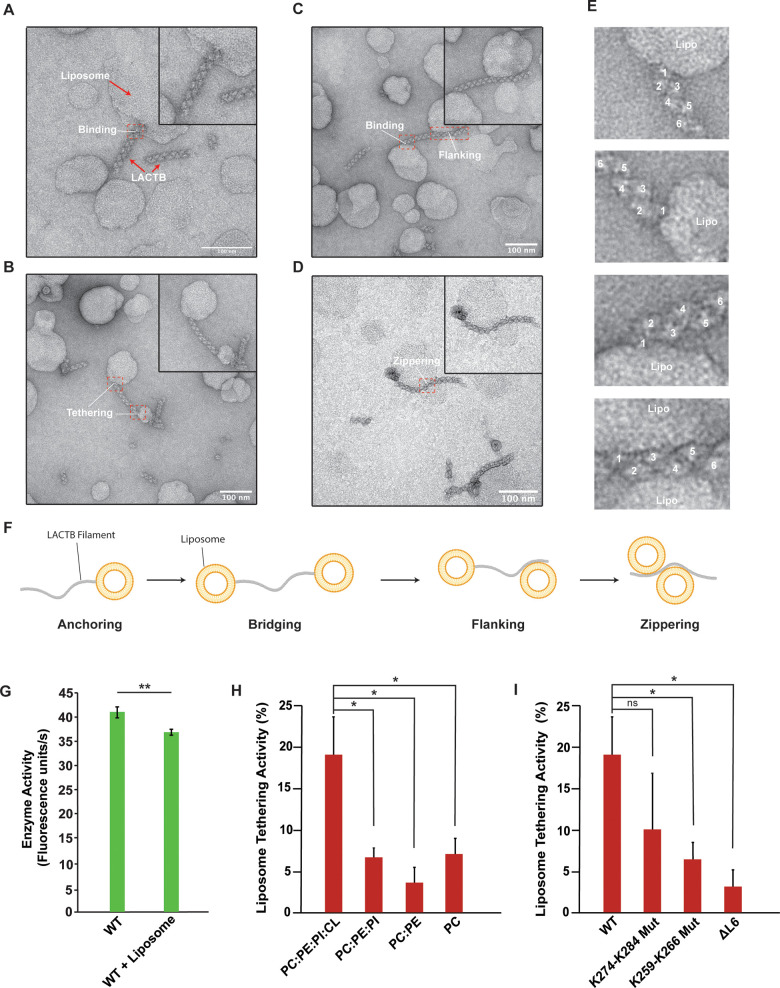
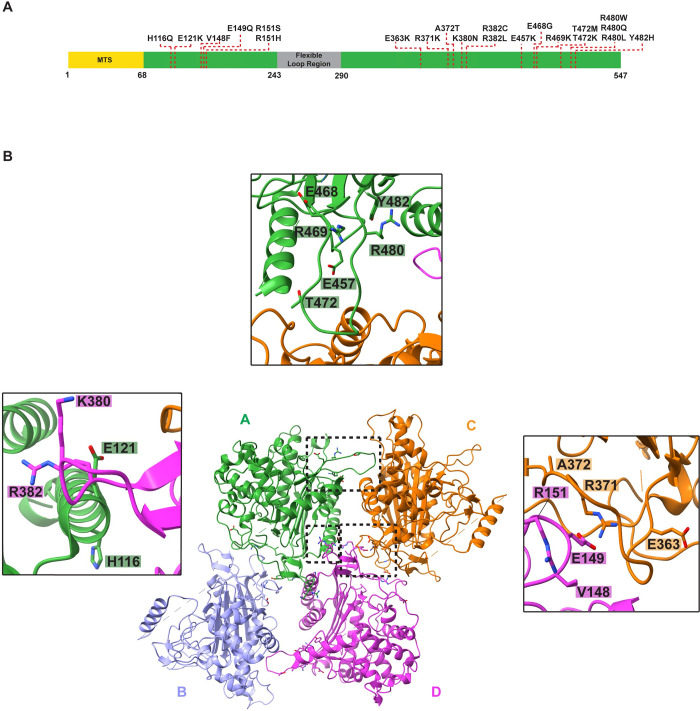
Mitochondria are complex organelles that play a central role in metabolism. Dynamic membrane-associated processes regulate mitochondrial morphology and bioenergetics in response to cellular demand. In tumor cells, metabolic reprogramming requires active mitochondrial metabolism for providing key metabolites and building blocks for tumor growth and rapid proliferation. To counter this, the mitochondrial serine beta-lactamase-like protein (LACTB) alters mitochondrial lipid metabolism and potently inhibits the proliferation of a variety of tumor cells. Mammalian LACTB is localized in the mitochondrial intermembrane space (IMS), where it assembles into filaments to regulate the efficiency of essential metabolic processes. However, the structural basis of LACTB polymerization and regulation remains incompletely understood. Here, we describe how human LACTB self-assembles into micron-scale filaments that increase their catalytic activity. The electron cryo-microscopy (cryoEM) structure defines the mechanism of assembly and reveals how highly ordered filament bundles stabilize the active state of the enzyme. We identify and characterize residues that are located at the filament-forming interface and further show that mutations that disrupt filamentation reduce enzyme activity. Furthermore, our results provide evidence that LACTB filaments can bind lipid membranes. These data reveal the detailed molecular organization and polymerization-based regulation of human LACTB and provide new insights into the mechanism of mitochondrial membrane organization that modulates lipid metabolism.
Overview
The claims and statistics of this paper haven’t been checked yet.
Run the check — free, no account needed. It reads the open-access text and checks the sources it cites.
Integrity signals
Registry
Cites
Statistics
Figures
Verification
Claims the paper makes
The claims and statistics of this paper haven’t been checked yet.
Run the check — free, no account needed. It reads the open-access text and checks the sources it cites.
Self-check
Percentages, sums and reported differences re-computed from the paper’s own numbers.
The self-check needs the paper’s full text.
Citations
Cites
Highly accurate protein structure prediction with AlphaFold
Jumper, J., Evans, R., Pritzel, A., Green, T., Figurnov, M., Ronneberger, O., Tunyasuvunakool, K., Bates, R., Žídek, A., Potapenko, A., et al. (2021) · Nature · doi:10.1038/s41586-021-03819-2 · Cited by 43,764
Mitochondrial form and function
Friedman, J. R., & Nunnari, J. (2014) · Nature · doi:10.1038/nature12985 · Cited by 1,803 · cited 1×
“The IM separates the intermembrane space (IMS) from the matrix and folds inwards to form cristae [3,4].”
BackgroundBar-Peled, L., Chantranupong, L., Cherniack, A. D., Chen, W. W., Ottina, K. A., Grabiner, B. C., Spear, E. D., Carter, S. L., Meyerson, M., & Sabatini, D. M. (2013) · Science · doi:10.1126/science.1232044 · Cited by 1,080
Variations in DNA elucidate molecular networks that cause disease
Chen, Y., Zhu, J., Lum, P. Y., Yang, X., Pinto, S., MacNeil, D. J., Zhang, C., Lamb, J., Edwards, S., Sieberts, S. K., et al. (2008) · Nature · doi:10.1038/nature06757 · Cited by 887
Mitochondrial dynamics in adaptive and maladaptive cellular stress responses
Eisner, V., Picard, M., & Hajnóczky, G. (2018) · Nature Cell Biology · doi:10.1038/s41556-018-0133-0 · Cited by 622
Hung, V., Zou, P., Rhee, H.-W., Udeshi, N. D., Cracan, V., Svinkina, T., Carr, S. A., Mootha, V. K., & Ting, A. Y. (2014) · Molecular Cell · doi:10.1016/j.molcel.2014.06.003 · Cited by 517
Research works printed but not linked: 81
- A Mottis, 2019, Mitocellular communication: Shaping health and disease, Science, 366, 827, 10.1126/science.aax3768 · DOI
- JB Spinelli, 2018, The multifaceted contributions of mitochondria to cellular metabolism, Nat Cell Biol, 20, 745, 10.1038/s41556-018-0124-1 · DOI · Paper page
- JC Iovine, 2021, Mitochondrial compartmentalization: emerging themes in structure and function, Trends Biochem Sci, 46, 902, 10.1016/j.tibs.2021.06.003 · DOI
- DC Chan, 2020, Mitochondrial Dynamics and Its Involvement in Disease., Annu Rev Pathol Mech Dis., 15, 235, 10.1146/annurev-pathmechdis-012419-032711 · DOI · Paper page
- JA Mayr, 2015, Lipid metabolism in mitochondrial membranes, J Inherit Metab Dis, 38, 137, 10.1007/s10545-014-9748-x · DOI
- JA Stefely, 2017, Biochemistry of Mitochondrial Coenzyme Q Biosynthesis, Trends Biochem Sci, 42, 824, 10.1016/j.tibs.2017.06.008 · DOI
- M Manicki, 2022, Structure and functionality of a multimeric human COQ7:COQ9 complex, Mol Cell, 82, 1, 10.1016/j.molcel.2022.10.003 · DOI
- CU Mårtensson, 2017, Effects of lipids on mitochondrial functions, Biochim Biophys Acta BBA—Mol Cell Biol Lipids, 1862, 102
- W Basu Ball, 2018, The role of nonbilayer phospholipids in mitochondrial structure and function, FEBS Lett, 592, 1273, 10.1002/1873-3468.12887 · DOI
- R Steenbergen, 2005, Disruption of the Phosphatidylserine Decarboxylase Gene in Mice Causes Embryonic Lethality and Mitochondrial Defects, J Biol Chem, 280, 40032, 10.1074/jbc.M506510200 · DOI
- E Calzada, 2019, Phosphatidylethanolamine made in the inner mitochondrial membrane is essential for yeast cytochrome bc1 complex function., Nat Commun., 10, 1432, 10.1038/s41467-019-09425-1 · DOI
- G Tasseva, 2013, Phosphatidylethanolamine Deficiency in Mammalian Mitochondria Impairs Oxidative Phosphorylation and Alters Mitochondrial Morphology, J Biol Chem, 288, 4158, 10.1074/jbc.M112.434183 · DOI
- MT Snaebjornsson, 2020, Greasing the Wheels of the Cancer Machine: The Role of Lipid Metabolism in Cancer., Cell Metab, 31, 62, 10.1016/j.cmet.2019.11.010 · DOI · Paper page
- S Vyas, 2016, Mitochondria and Cancer., Cell, 166, 555, 10.1016/j.cell.2016.07.002 · DOI · Paper page
- PE Porporato, 2018, Mitochondrial metabolism and cancer, Cell Res, 28, 265, 10.1038/cr.2017.155 · DOI
- M Chaker-Margot, 2022, Structural basis of activation of the tumor suppressor protein neurofibromin, Mol Cell, 82, 1288, 10.1016/j.molcel.2022.03.011 · DOI
- Z Keckesova, 2017, LACTB is a tumour suppressor that modulates lipid metabolism and cell state, Nature, 543, 681, 10.1038/nature21408 · DOI
- Z Polianskyte, 2009, LACTB is a filament-forming protein localized in mitochondria, Proc Natl Acad Sci U S A, 106, 18960, 10.1073/pnas.0906734106 · DOI
- TS Smith, 2001, Identification, Genomic Organization, and mRNA Expression of LACTB, Encoding a Serine β-Lactamase-like Protein with an Amino-terminal Transmembrane Domain, Genomics, 78, 12, 10.1006/geno.2001.6643 · DOI
- Y Ma, 2021, LACTB suppresses melanoma progression by attenuating PP1A and YAP interaction, Cancer Lett, 506, 67, 10.1016/j.canlet.2021.02.022 · DOI
- W Xu, 2020, LACTB Regulates PIK3R3 to Promote Autophagy and Inhibit EMT and Proliferation Through the PI3K/AKT/mTOR Signaling Pathway in Colorectal Cancer., Cancer Manag Res, 12, 5181, 10.2147/CMAR.S250661 · DOI
- H-T Li, 2019, Overexpression of LACTB, a Mitochondrial Protein That Inhibits Proliferation and Invasion in Glioma Cells., Oncol Res Featur Preclin Clin Cancer Ther, 27, 423
- K Zeng, 2018, LACTB, a novel epigenetic silenced tumor suppressor, inhibits colorectal cancer progression by attenuating MDM2-mediated p53 ubiquitination and degradation, Oncogene, 37, 5534, 10.1038/s41388-018-0352-7 · DOI
- J Zhang, 2018, Upregulation of miR-374a promotes tumor metastasis and progression by downregulating LACTB and predicts unfavorable prognosis in breast cancer, Cancer Med, 7, 3351, 10.1002/cam4.1576 · DOI
- J Liu, 2021, Targeted Nanotherapeutics Using LACTB Gene Therapy Against Melanoma., Int J Nanomedicine, 16, 7697, 10.2147/IJN.S331519 · DOI
- O Eriksson, 2017, Commentary: LACTB is a tumour suppressor that modulates lipid metabolism and cell state, Front Physiol, 8, 396, 10.3389/fphys.2017.00396 · DOI
- EYL Chan, 2012, Phosphatidylserine Decarboxylase 1 (Psd1) Promotes Mitochondrial Fusion by Regulating the Biophysical Properties of the Mitochondrial Membrane and Alternative Topogenesis of Mitochondrial Genome Maintenance Protein 1 (Mgm1)., J Biol Chem, 287, 40131, 10.1074/jbc.M112.399428 · DOI
- MA Frohman, 2015, Role of mitochondrial lipids in guiding fission and fusion, J Mol Med, 93, 263, 10.1007/s00109-014-1237-z · DOI
- DJ Pagliarini, 2008, A Mitochondrial Protein Compendium Elucidates Complex I Disease Biology, Cell, 134, 112, 10.1016/j.cell.2008.06.016 · DOI · Paper page
- X Yang, 2009, Validation of candidate causal genes for obesity that affect shared metabolic pathways and networks, Nat Genet, 41, 415, 10.1038/ng.325 · DOI · Paper page
- A Gonzalez-Franquesa, 2021, Mass-spectrometry-based proteomics reveals mitochondrial supercomplexome plasticity, Cell Rep, 35, 109180, 10.1016/j.celrep.2021.109180 · DOI
- N Peitsaro, 2008, Evolution of a family of metazoan active-site-serine enzymes from penicillin-binding proteins: a novel facet of the bacterial legacy, BMC Evol Biol, 8, 26, 10.1186/1471-2148-8-26 · DOI
- EM Lynch, 2017, Human CTP synthase filament structure reveals the active enzyme conformation, Nat Struct Mol Biol, 24, 507, 10.1038/nsmb.3407 · DOI
- EM Lynch, 2020, Coupled structural transitions enable highly cooperative regulation of human CTPS2 filaments, Nat Struct Mol Biol, 27, 42, 10.1038/s41594-019-0352-5 · DOI
- EM Lynch, 2021, Structural basis for isoform-specific inhibition of human CTPS1, Proc Natl Acad Sci U S A, 118, e2107968118, 10.1073/pnas.2107968118 · DOI
- MC Johnson, 2020, Cryo-EM structures demonstrate human IMPDH2 filament assembly tunes allosteric regulation., eLife, 9, e53243, 10.7554/eLife.53243 · DOI
- M Hunkeler, 2018, Structural basis for regulation of human acetyl-CoA carboxylase, Nature, 558, 470, 10.1038/s41586-018-0201-4 · DOI · Paper page
- G Kim, 2019, Aldehyde-alcohol dehydrogenase forms a high-order spirosome architecture critical for its activity., Nat Commun, 10, 4527, 10.1038/s41467-019-12427-8 · DOI
- BA Webb, 2017, The glycolytic enzyme phosphofructokinase-1 assembles into filaments, J Cell Biol, 216, 2305, 10.1083/jcb.201701084 · DOI
- I Petrovska, 2014, Filament formation by metabolic enzymes is a specific adaptation to an advanced state of cellular starvation., eLife, 3, e02409, 10.7554/eLife.02409 · DOI
- LA Sena, 2012, Physiological Roles of Mitochondrial Reactive Oxygen Species, Mol Cell, 48, 158, 10.1016/j.molcel.2012.09.025 · DOI · Paper page
- RL Auten, 2009, Oxygen Toxicity and Reactive Oxygen Species: The Devil Is in the Details, Pediatr Res, 66, 121, 10.1203/PDR.0b013e3181a9eafb · DOI
- I DalleDonne, 1995, H2O2-treated actin: assembly and polymer interactions with cross-linking proteins, Biophys J, 69, 2710, 10.1016/S0006-3495(95)80142-6 · DOI
- T Shutt, 2012, The intracellular redox state is a core determinant of mitochondrial fusion, EMBO Rep, 13, 909, 10.1038/embor.2012.128 · DOI
- M Norton, 2014, ROMO1 Is an Essential Redox-Dependent Regulator of Mitochondrial Dynamics., Sci Signal., 7, ra10, 10.1126/scisignal.2004374 · DOI
- CA Brambley, 2019, Characterization of Mitochondrial YME1L Protease Oxidative Stress-Induced Conformational State, J Mol Biol, 431, 1250, 10.1016/j.jmb.2019.01.039 · DOI
- KJ Karczewski, 2020, The mutational constraint spectrum quantified from variation in 141,456 humans, Nature, 581, 434, 10.1038/s41586-020-2308-7 · DOI · Paper page
- JG Tate, 2019, COSMIC: the Catalogue Of Somatic Mutations In Cancer, Nucleic Acids Res, 47, D941, 10.1093/nar/gky1015 · DOI · Paper page
- CK Park, 2019, Structures, functions, and mechanisms of filament forming enzymes: a renaissance of enzyme filamentation, Biophys Rev, 11, 927, 10.1007/s12551-019-00602-6 · DOI
- EM Lynch, 2020, Filament formation by metabolic enzymes—A new twist on regulation, Curr Opin Cell Biol, 66, 28, 10.1016/j.ceb.2020.04.006 · DOI
- GN Aughey, 2016, Metabolic regulation via enzyme filamentation, Crit Rev Biochem Mol Biol, 51, 282, 10.3109/10409238.2016.1172555 · DOI
- JC Simonet, 2020, Freedom of assembly: metabolic enzymes come together, Mol Biol Cell, 31, 1201, 10.1091/mbc.E18-10-0675 · DOI
- S Polley, 2019, Mechanism of Filamentation-Induced Allosteric Activation of the SgrAI Endonuclease, Structure, 27, 1497, 10.1016/j.str.2019.08.001 · DOI
- CJ Barahona, 2019, The Need for Speed: Run-On Oligomer Filament Formation Provides Maximum Speed with Maximum Sequestration of Activity, J Virol, 93, e01647, 10.1128/JVI.01647-18 · DOI
- EH Egelman, 2003, Actin’s prokaryotic homologs, Curr Opin Struct Biol, 13, 244, 10.1016/S0959-440X(03)00027-7 · DOI
- AL Burrell, 2022, IMPDH1 retinal variants control filament architecture to tune allosteric regulation, Nat Struct Mol Biol, 29, 47, 10.1038/s41594-021-00706-2 · DOI
- A Szuba, 2021, Membrane binding controls ordered self-assembly of animal septins., eLife, 10, e63349, 10.7554/eLife.63349 · DOI
- G Perkins, 1997, Electron Tomography of Neuronal Mitochondria: Three-Dimensional Structure and Organization of Cristae and Membrane Contacts, J Struct Biol, 119, 260, 10.1006/jsbi.1997.3885 · DOI
- K Liang, 2018, Cryo-EM structure of human mitochondrial trifunctional protein, Proc Natl Acad Sci U S A, 115, 7039, 10.1073/pnas.1801252115 · DOI
- C Xia, 2019, Crystal structure of human mitochondrial trifunctional protein, a fatty acid β-oxidation metabolon, Proc Natl Acad Sci U S A, 116, 6069, 10.1073/pnas.1816317116 · DOI
- M Zhang, 2022, Structural basis for the catalytic activity of filamentous human serine beta-lactamase-like protein LACTB, Structure, 30, 685, 10.1016/j.str.2022.02.007 · DOI
- DS Booth, 2011, Visualizing Proteins and Macromolecular Complexes by Negative Stain EM: from Grid Preparation to Image Acquisition., JoVE J Vis Exp, e3227
- DN Mastronarde, 2005, Automated electron microscope tomography using robust prediction of specimen movements, J Struct Biol, 152, 36, 10.1016/j.jsb.2005.07.007 · DOI
- SQ Zheng, 2017, MotionCor2: anisotropic correction of beam-induced motion for improved cryo-electron microscopy., Nat Methods, 14, 331, 10.1038/nmeth.4193 · DOI
- A Rohou, 2015, CTFFIND4: Fast and accurate defocus estimation from electron micrographs, J Struct Biol, 192, 216, 10.1016/j.jsb.2015.08.008 · DOI
- J Zivanov, 2018, New tools for automated high-resolution cryo-EM structure determination in RELION-3., eLife, 7, e42166, 10.7554/eLife.42166 · DOI
- S He, 2017, Helical reconstruction in RELION, J Struct Biol, 198, 163, 10.1016/j.jsb.2017.02.003 · DOI
- A Kucukelbir, 2014, Quantifying the local resolution of cryo-EM density maps., Nat Methods., 11, 63, 10.1038/nmeth.2727 · DOI
- EF Pettersen, 2004, UCSF Chimera—A visualization system for exploratory research and analysis, J Comput Chem, 25, 1605, 10.1002/jcc.20084 · DOI
- D Liebschner, 2019, Macromolecular structure determination using X-rays, neutrons and electrons: recent developments in Phenix., Acta Crystallogr Sect Struct Biol, 75, 861, 10.1107/S2059798319011471 · DOI · Paper page
- P Emsley, 2010, Features and development of Coot, Acta Crystallogr D Biol Crystallogr, 66, 486, 10.1107/S0907444910007493 · DOI · Paper page
- CJ Williams, 2018, MolProbity: More and better reference data for improved all-atom structure validation, Protein Sci, 27, 293, 10.1002/pro.3330 · DOI · Paper page
- EF Pettersen, 2021, UCSF ChimeraX: Structure visualization for researchers, educators, and developers, Protein Sci, 30, 70, 10.1002/pro.3943 · DOI
- J Schindelin, 2012, Fiji: an open-source platform for biological-image analysis., Nat Methods, 9, 676, 10.1038/nmeth.2019 · DOI · Paper page
- E Jurrus, 2018, Improvements to the APBS biomolecular solvation software suite, Protein Sci, 27, 112, 10.1002/pro.3280 · DOI
- E Krissinel, 2007, Inference of Macromolecular Assemblies from Crystalline State, J Mol Biol, 372, 774, 10.1016/j.jmb.2007.05.022 · DOI
- L Holm, 2010, Dali server: conservation mapping in 3D, Nucleic Acids Res, 38, W545, 10.1093/nar/gkq366 · DOI · Paper page
- MN Nguyen, 2011, CLICK—topology-independent comparison of biomolecular 3D structures, Nucleic Acids Res, 39, W24, 10.1093/nar/gkr393 · DOI
- F Sievers, 2011, Fast, scalable generation of high-quality protein multiple sequence alignments using Clustal Omega, Mol Syst Biol, 7, 539, 10.1038/msb.2011.75 · DOI
- X Robert, 2014, Deciphering key features in protein structures with the new ENDscript server, Nucleic Acids Res, 42, W320, 10.1093/nar/gku316 · DOI · Paper page
- D Ardail, 1990, Mitochondrial contact sites. Lipid composition and dynamics, J Biol Chem, 265, 18797, 10.1016/S0021-9258(17)30583-5 · DOI
Metadata
- Authors
- Bennett, J. A., Steward, L. R., Rudolph, J., Voss, A. P., & Aydin, H.
- Affiliations
- University of Colorado Boulder (US)
- Corresponding author
- Aydin, Halil
- Venue
- PLOS Biology
- Publisher
- Public Library of Science (PLoS)
- Published
- 2022-12-19
- Volume
- 20
- Issue
- 12
- Pages
- e3001899
- ISSN
- 1544-9173 (ISSN-L)
- 1545-7885
- PMC
- PMC9815587
- OpenAlex
- W4311911807
- Cited by
- 16
- References
- 6
- Citations by year
- 2026: 6 · 2025: 5 · 2024: 3 · 2023: 1 · 2022: 1
- FWCI
- 0.82
- Type
- journal article
- Language
- en
- Update notices
- new_version (2023-01-05)
- Open access
- gold
- doi.org
- Licence
- Locations
- PLoS Biology (publishedVersion, cc-by)
- bioRxiv (Cold Spring Harbor Laboratory) (acceptedVersion, cc-by-nd)
- PubMed Central (publishedVersion, cc-by)
- PubMed (publishedVersion)
- CU Scholar (University of Colorado Boulder) (submittedVersion, cc-by)
- DOAJ (DOAJ: Directory of Open Access Journals) (submittedVersion)
- Funders
- University of Colorado Boulder
- Topics
- Life Sciences › Biochemistry, Genetics and Molecular Biology › Molecular Biology › Mitochondrial Function and Pathology
- Life Sciences › Biochemistry, Genetics and Molecular Biology › Structural Biology › Enzyme Structure and Function
- Life Sciences › Biochemistry, Genetics and Molecular Biology › Structural Biology › Advanced Electron Microscopy Techniques and Applications
- Keywords
- LACTB, mitochondrial intermembrane space, protein filament assembly, membrane binding, mitochondrial lipid metabolism, tumor cell proliferation, enzyme activity
- MeSH terms
- Animals, beta-Lactamases, Cytoskeleton, Humans, Mammals, Membrane Proteins, Mitochondria, Neoplasms, Cryoelectron Microscopy, Mitochondrial Proteins
About these checks
Registry, retraction, Cites and statistics results are computed, not judged, with one exception: a printed reference that no index lists is read once by a model before it counts as a citation error. Claims are extracted by a model and kept only when their quote appears verbatim in the text; each cited source is then checked, with a model’s help, for whether it says what the claim relies on. Those verdicts can be wrong — read the claim’s quote and the cited source before relying on one.
Statistics and arithmetic are recomputed, not judged.
Confidence bands are shown only for fields calibrated on our annotated test set. None is calibrated yet, so no band is shown.
What counts as a claim ›How we measure confidence ›How we check this ›
Are you an author, or do you see a problem with this page? Request a review
How to cite
Cite CoChat for the checks on this page, and the paper for its own findings.
- This page
- CoChat. (2026). Citation check: The structure of the human LACTB filament reveals the mechanisms of assembly and membrane binding. https://app.cochat.ai/papers/10.1371/journal.pbio.3001899
- The paper
- Bennett, J. A., Steward, L. R., Rudolph, J., Voss, A. P., & Aydin, H. (2022). The structure of the human LACTB filament reveals the mechanisms of assembly and membrane binding. PLOS Biology. https://doi.org/10.1371/journal.pbio.3001899
