

The DOI matches its Crossref record; 32 of the 32 references it cites were found in a registry or an index.
Neural Network Mechanisms Underlying Stimulus Driven Variability Reduction
Open accessAbstract
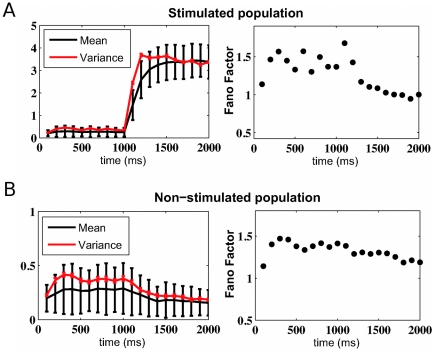
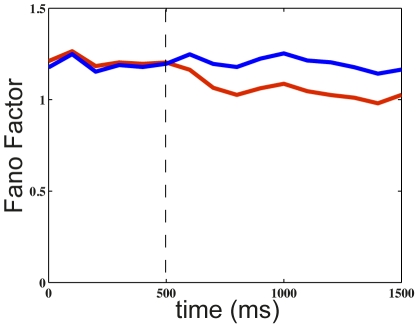
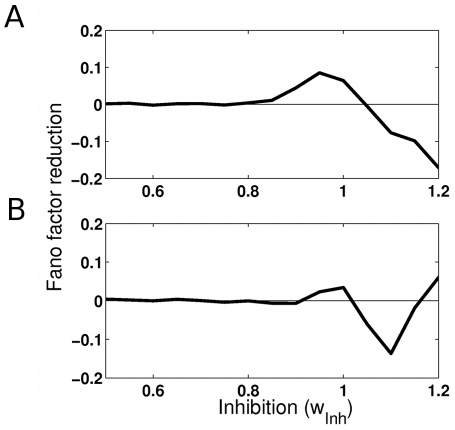
It is well established that the variability of the neural activity across trials, as measured by the Fano factor, is elevated. This fact poses limits on information encoding by the neural activity. However, a series of recent neurophysiological experiments have changed this traditional view. Single cell recordings across a variety of species, brain areas, brain states and stimulus conditions demonstrate a remarkable reduction of the neural variability when an external stimulation is applied and when attention is allocated towards a stimulus within a neuron's receptive field, suggesting an enhancement of information encoding. Using an heterogeneously connected neural network model whose dynamics exhibits multiple attractors, we demonstrate here how this variability reduction can arise from a network effect. In the spontaneous state, we show that the high degree of neural variability is mainly due to fluctuation-driven excursions from attractor to attractor. This occurs when, in the parameter space, the network working point is around the bifurcation allowing multistable attractors. The application of an external excitatory drive by stimulation or attention stabilizes one specific attractor, eliminating in this way the transitions between the different attractors and resulting in a net decrease in neural variability over trials. Importantly, non-responsive neurons also exhibit a reduction of variability. Finally, this reduced variability is found to arise from an increased regularity of the neural spike trains. In conclusion, these results suggest that the variability reduction under stimulation and attention is a property of neural circuits.
Overview
The claims and statistics of this paper haven’t been checked yet.
Free: it reads the open-access text and checks the first 5 claims that cite a source we can check. Create a free account to check every claim.
Integrity signals
Registry
Cites
Statistics
Figures

Verification
Claims the paper makes
The claims and statistics of this paper haven’t been checked yet.
Free: it reads the open-access text and checks the first 5 claims that cite a source we can check. Create a free account to check every claim.
Claims other papers make about this one
Each is checked against this paper’s own text: does it say what the citing paper says it does?
The source backs part of the claim, not all of it — or backs it for a different population, condition or comparison.
In the citing paper
“Cortical and subcortical circuits exhibit dense recurrent connectivity that generates attractor dynamics, oscillatory patterns, and metastable states (Brinkman et al. 2022; Deco and Hugues 2012).”
From The myth of the Bayesian brain (2025) · cites this paper as Deco and Hugues 2012
Experimental — accuracy not yet measured
Self-check
Percentages, sums and reported differences re-computed from the paper’s own numbers.
The self-check needs the paper’s full text.
Citations
Cites
Neural Mechanisms of Selective Visual Attention
Desimone, R., & Duncan, J. (1995) · Annual Review of Neuroscience · doi:10.1146/annurev.ne.18.030195.001205 · Cited by 8,388 · cited 2×
“As a model prediction, we consider now the case where two stimuli are presented simultaneously in a neuron’s receptive field and when attention is allocated to only one of them, a situation referred to lead to ‘‘biased competition’’ [20,21].”
MethodSpontaneous fluctuations in brain activity observed with functional magnetic resonance imaging
Fox, M. D., & Raichle, M. E. (2007) · Nature Reviews Neuroscience · doi:10.1038/nrn2201 · Cited by 6,700 · cited 1×
“At the global level of large-scale neural systems, a broad body of experimental work, mainly using the BOLD fMRI hemodynamic response, has suggested that brain activity during resting state is not random but has a spatiotemporal structure (for a review see [27]).”
BackgroundShadlen, M. N., & Newsome, W. T. (1998) · The Journal of Neuroscience · doi:10.1523/jneurosci.18-10-03870.1998 · Cited by 2,178 · cited 1×
“firing irregularity and the high variability across trials that individual neurons activity exhibit [1,2], fluctuations that a priori limit information encoding.”
BackgroundSoftky, W., & Koch, C. (1993) · The Journal of Neuroscience · doi:10.1523/jneurosci.13-01-00334.1993 · Cited by 1,689 · cited 1×
“firing irregularity and the high variability across trials that individual neurons activity exhibit [1,2], fluctuations that a priori limit information encoding.”
BackgroundDynamics of ongoing activity: explanation of the large variability in evoked cortical responses
Arieli, A., Sterkin, A., Grinvald, A., & Aertsen, A. (1996) · Science · doi:10.1126/science.273.5283.1868 · Cited by 1,660 · cited 1×
“[4] (see also [5]) first showed that spontaneous activity is highly coordinated across large neural assemblies in the primary visual cortex (V1) of an anesthetized cat.”
BackgroundCorticonics: Neural Circuits of the Cerebral Cortex
Abeles, M. (1991) · Cambridge University Press eBooks · doi:10.1017/cbo9780511574566 · Cited by 1,345 · cited 1×
“The network consists of N (N~1000 in our simulations) interacting neurons, where NE~0:8N are excitatory (pyramidal) cells and NI~0:2N are inhibitory cells (interneurons), consistent with the neurophysiologically observed proportions [29].”
ResultCompetitive Mechanisms Subserve Attention in Macaque Areas V2 and V4
Reynolds, J. H., Chelazzi, L., & Desimone, R. (1999) · The Journal of Neuroscience · doi:10.1523/jneurosci.19-05-01736.1999 · Cited by 1,236 · cited 2×
“As a model prediction, we consider now the case where two stimuli are presented simultaneously in a neuron’s receptive field and when attention is allocated to only one of them, a situation referred to lead to ‘‘biased competition’’ [20,21].”
MethodAttention improves performance primarily by reducing interneuronal correlations
Cohen, M. R., & Maunsell, J. H. R. (2009) · Nature Neuroscience · doi:10.1038/nn.2439 · Cited by 1,152 · cited 5×
“For this, we first address the recent experimental results when one stimulus is presented in a neuron’s receptive field [7,9].”
BackgroundResultInfluentialThe dynamic brain: from spiking neurons to neural masses and cortical fields
Deco, G., Jirsa, V. K., Robinson, P. A., Breakspear, M., & Friston, K. (2008) · PLoS Computational Biology · doi:10.1371/journal.pcbi.1000092 · Cited by 1,084 · cited 1×
“The stationary and stable states (attractors) of this network can be studied using a standard mean-field approximation [16,19], applied here to the case when input rate fluctuations are absent.”
BackgroundSelf-citationStimulus onset quenches neural variability: A widespread cortical phenomenon
Churchland, M. M., Yu, B. M., Cunningham, J. P., Sugrue, L. P., Cohen, M. R., Corrado, G. S., Newsome, W. T., Clark, A. M., Hosseini, P., Scott, B. B., et al. (2010) · Nature Neuroscience · doi:10.1038/nn.2501 · Cited by 1,084 · cited 4×
“generally reduced neural variability [10], in line with previous results in the visual system [11].”
BackgroundResultInfluential
Cited by
Slow dynamics and high variability in balanced cortical networks with clustered connections
Litwin-Kumar, A., & Doiron, B. (2012) · Nature Neuroscience · doi:10.1038/nn.3220 · Cited by 539
Thiele, A., & Bellgrove, M. A. (2018) · Neuron · doi:10.1016/j.neuron.2018.01.008 · Cited by 350
“The stability of these states is determined by the strength of inhibitory and excitatory drive (Deco and Hugues, 2012; Deco et al., 2014).”
BackgroundFormation and maintenance of neuronal assemblies through synaptic plasticity
Litwin-Kumar, A., & Doiron, B. (2014) · Nature Communications · doi:10.1038/ncomms6319 · Cited by 297
Spontaneous and Task-Evoked Brain Activity Negatively Interact
He, B. J. (2013) · The Journal of Neuroscience · doi:10.1523/jneurosci.2922-12.2013 · Cited by 272
“…reduction to external inputs has been demonstrated in a recurrent chaotic network model (Abbott et al., 2011) and an attractor network model (Deco and Hugues, 2012); further, a mean-field model for EEG shows linear superposition and nonlinear phase resetting under different schemes of the…”
BackgroundTuning pathological brain oscillations with neurofeedback: a systems neuroscience framework
Ros, T., J. Baars, B., Lanius, R. A., & Vuilleumier, P. (2014) · Frontiers in Human Neuroscience · doi:10.3389/fnhum.2014.01008 · Cited by 258
Metadata
- Authors
- Deco, G., & Hugues, E.
- Affiliations
- Institució Catalana de Recerca i Estudis Avançats (ES)
- Universitat Pompeu Fabra (ES)
- Corresponding author
- Deco, Gustavo
- Venue
- PLoS Computational Biology
- Publisher
- Public Library of Science (PLoS)
- Published
- 2012-03-29
- Volume
- 8
- Issue
- 3
- Pages
- e1002395
- ISSN
- 1553-734X (ISSN-L)
- 1553-7358
- PMC
- PMC3315452
- OpenAlex
- W2008016900
- Cited by
- 132
- References
- 32
- Citations by year
- 2026: 3 · 2025: 12 · 2024: 15 · 2023: 4 · 2022: 10 · 2021: 15 · 2020: 8 · 2019: 20 · 2018: 9 · 2017: 6 · 2016: 7 · 2015: 6 · 2014: 7 · 2013: 8 · 2012: 2
- FWCI
- 3.77
- Type
- journal article
- Language
- en
- Open access
- gold
- doi.org
- Locations
- PLoS Computational Biology (publishedVersion, cc-by)
- Europe PMC (PubMed Central) (publishedVersion, cc-by)
- PubMed Central (publishedVersion, cc-by)
- PubMed (publishedVersion)
- RECERCAT (Consorci de Serveis Universitaris de Catalunya) (publishedVersion, other-oa)
- RePEc: Research Papers in Economics (submittedVersion)
- DOAJ (DOAJ: Directory of Open Access Journals) (submittedVersion)
- Repositori digital de la UPF (Universitat Pompeu Fabra) (submittedVersion, cc-by)
- Funders
- European Commission (200728, 2007–2013, 269921, FP7 2007-2013, 00012, FP7/2007)
- Topics
- Life Sciences › Neuroscience › Cognitive Neuroscience › Neural dynamics and brain function
- Physical Sciences › Physics and Astronomy › Statistical and Nonlinear Physics › stochastic dynamics and bifurcation
- Life Sciences › Neuroscience › Cellular and Molecular Neuroscience › Neuroscience and Neuropharmacology Research
- Keywords
- neural variability, Fano factor, attention, external stimulation, attractor dynamics, bifurcation, information encoding, spontaneous neuronal activity
- MeSH terms
- Action Potentials, Animals, Computer Simulation, Humans, Models, Neurological, Nerve Net, Synaptic Transmission, Neurons, Reproducibility of Results, Excitatory Postsynaptic Potentials, Feedback, Physiological
About these checks
Registry, retraction, Cites and statistics results are computed, not judged, with one exception: a printed reference that no index lists is read once by a model before it counts as a citation error. Claims are extracted by a model and kept only when their quote appears verbatim in the text; each cited source is then checked, with a model’s help, for whether it says what the claim relies on. Those verdicts can be wrong — read the claim’s quote and the cited source before relying on one.
Statistics and arithmetic are recomputed, not judged.
Confidence bands are shown only for fields calibrated on our annotated test set. None is calibrated yet, so no band is shown.
What counts as a claim ›How we measure confidence ›How we check this ›
Are you an author, or do you see a problem with this page? Request a review
How to cite
Cite CoChat for the checks on this page, and the paper for its own findings.
- This page
- CoChat. (2026). Citation check: Neural Network Mechanisms Underlying Stimulus Driven Variability Reduction. https://app.cochat.ai/papers/10.1371/journal.pcbi.1002395
- The paper
- Deco, G., & Hugues, E. (2012). Neural Network Mechanisms Underlying Stimulus Driven Variability Reduction. PLoS Computational Biology. https://doi.org/10.1371/journal.pcbi.1002395
Data sources
Bibliographic data: Semantic Scholar, OpenAlex, Crossref.
Contains information from the Semantic Scholar Academic Graph Datasets, made available under the ODC Attribution License (ODC-BY 1.0).
Semantic Scholar’s data is described in: Kinney, R., et al. (2023). The Semantic Scholar Open Data Platform. arXiv:2301.10140.
