

The DOI matches its Crossref record; 20 of the 20 references it cites were found in a registry or an index.
BASiCS: Bayesian Analysis of Single-Cell Sequencing Data
Open accessAbstract
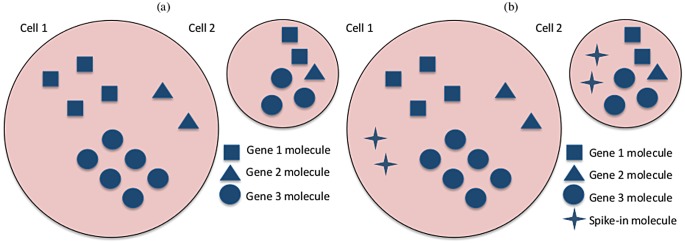
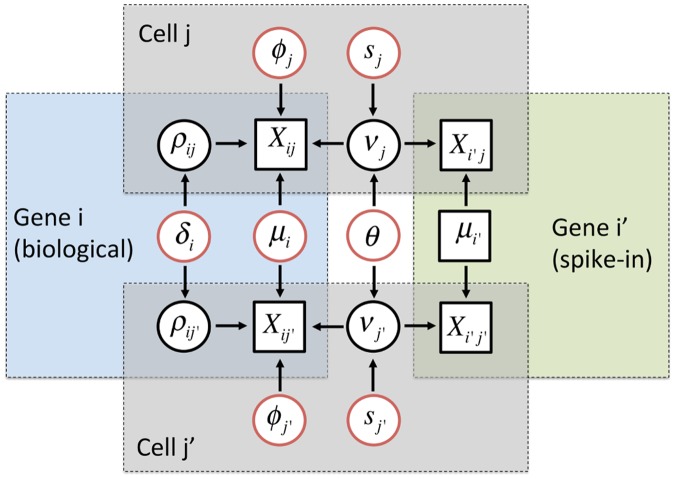
Single-cell mRNA sequencing can uncover novel cell-to-cell heterogeneity in gene expression levels in seemingly homogeneous populations of cells. However, these experiments are prone to high levels of unexplained technical noise, creating new challenges for identifying genes that show genuine heterogeneous expression within the population of cells under study. BASiCS (Bayesian Analysis of Single-Cell Sequencing data) is an integrated Bayesian hierarchical model where: (i) cell-specific normalisation constants are estimated as part of the model parameters, (ii) technical variability is quantified based on spike-in genes that are artificially introduced to each analysed cell's lysate and (iii) the total variability of the expression counts is decomposed into technical and biological components. BASiCS also provides an intuitive detection criterion for highly (or lowly) variable genes within the population of cells under study. This is formalised by means of tail posterior probabilities associated to high (or low) biological cell-to-cell variance contributions, quantities that can be easily interpreted by users. We demonstrate our method using gene expression measurements from mouse Embryonic Stem Cells. Cross-validation and meaningful enrichment of gene ontology categories within genes classified as highly (or lowly) variable supports the efficacy of our approach.
Overview
The claims and statistics of this paper haven’t been checked yet.
Run the check — free, no account needed. It reads the open-access text and checks the sources it cites.
Integrity signals
Registry
Cites
Statistics
Figures

Verification
Claims the paper makes
The claims and statistics of this paper haven’t been checked yet.
Run the check — free, no account needed. It reads the open-access text and checks the sources it cites.
Claims other papers make about this one
Each is checked against this paper’s own text: does it say what the citing paper says it does?
The cited source says what the claim attributes to it.
In the citing paper
“Furthermore, papers evaluating the performance of single-cell-specific tools all compute the simulations as if cells were independent15–21.”
From A practical solution to pseudoreplication bias in single-cell studies (2021) · cites this paper as [21]
Self-check
Percentages, sums and reported differences re-computed from the paper’s own numbers.
The self-check needs the paper’s full text.
Citations
Cites
Differential expression analysis for sequence count data
Anders, S., & Huber, W. (2010) · Genome Biology · doi:10.1186/gb-2010-11-10-r106 · Cited by 15,581
Kass, R. E., & Raftery, A. E. (1995) · Journal of the American Statistical Association · doi:10.1080/01621459.1995.10476572 · Cited by 12,558
Single-cell RNA-seq highlights intratumoral heterogeneity in primary glioblastoma
Patel, A. P., Tirosh, I., Trombetta, J. J., Shalek, A. K., Gillespie, S. M., Wakimoto, H., Cahill, D. P., Nahed, B. V., Curry, W. T., Martuza, R. L., et al. (2014) · Science · doi:10.1126/science.1254257 · Cited by 5,063
mRNA-Seq whole-transcriptome analysis of a single cell
Tang, F., Barbacioru, C., Wang, Y., Nordman, E., Lee, C., Xu, N., Wang, X., Bodeau, J., Tuch, B. B., Siddiqui, A., et al. (2009) · Nature Methods · doi:10.1038/nmeth.1315 · Cited by 3,969
Cell types in the mouse cortex and hippocampus revealed by single-cell RNA-seq
Zeisel, A., Muñoz-Manchado, A. B., Codeluppi, S., Lönnerberg, P., La Manno, G., Juréus, A., Marques, S., Munguba, H., He, L., Betsholtz, C., et al. (2015) · Science · doi:10.1126/science.aaa1934 · Cited by 3,124
Rcpp : Seamless R and C++ Integration
Eddelbüttel, D., & François, R. (2011) · Journal of Statistical Software · doi:10.18637/jss.v040.i08 · Cited by 1,468
Quantitative single-cell RNA-seq with unique molecular identifiers
Islam, S., Zeisel, A., Joost, S., La Manno, G., Zajac, P., Kasper, M., Lönnerberg, P., & Linnarsson, S. (2014) · Nature Methods · doi:10.1038/nmeth.2772 · Cited by 1,183
Computational and analytical challenges in single-cell transcriptomics
Stegle, O., Teichmann, S. A., & Marioni, J. C. (2015) · Nature Reviews Genetics · doi:10.1038/nrg3833 · Cited by 1,170
Self-citationBuettner, F., Natarajan, K. N., Casale, F. P., Proserpio, V., Scialdone, A., Theis, F. J., Teichmann, S. A., Marioni, J. C., & Stegle, O. (2015) · Nature Biotechnology · doi:10.1038/nbt.3102 · Cited by 1,136
Self-citationRoberts, G. O., & Rosenthal, J. S. (2009) · Journal of Computational and Graphical Statistics · doi:10.1198/jcgs.2009.06134 · Cited by 1,027
Accounting for technical noise in single-cell RNA-seq experiments
Brennecke, P., Anders, S., Kim, J. K., Kołodziejczyk, A. A., Zhang, X., Proserpio, V., Baying, B., Benes, V., Teichmann, S. A., Marioni, J. C., et al. (2013) · Nature Methods · doi:10.1038/nmeth.2645 · Cited by 979
Self-citationSingle-cell RNA-seq: advances and future challenges
Saliba, A.-E., Westermann, A. J., Gorski, S. A., & Vogel, J. (2014) · Nucleic Acids Research · doi:10.1093/nar/gku555 · Cited by 847
Validation of noise models for single-cell transcriptomics
Grün, D., Kester, L., & van Oudenaarden, A. (2014) · Nature Methods · doi:10.1038/nmeth.2930 · Cited by 721
Synthetic spike-in standards for RNA-seq experiments
Jiang, L., Schlesinger, F., Davis, C. A., Zhang, Y., Li, R., Salit, M., Gingeras, T. R., & Oliver, B. (2011) · Genome Research · doi:10.1101/gr.121095.111 · Cited by 653
Detecting differential gene expression with a semiparametric hierarchical mixture method
Newton, M. A. (2004) · Biostatistics · doi:10.1093/biostatistics/5.2.155 · Cited by 570
Single Cell Genomics: Advances and Future Perspectives
Macaulay, I. C., & Voet, T. (2014) · PLoS Genetics · doi:10.1371/journal.pgen.1004126 · Cited by 384
Richardson, S. T., & Gilks, W. R. (1993) · American Journal of Epidemiology · doi:10.1093/oxfordjournals.aje.a116875 · Cited by 165
Self-citationMurphy, C. L., & Polak, J. M. (2002) · Tissue Engineering · doi:10.1089/107632702760240472 · Cited by 84
An in situ hybridization-based screen for heterogeneously expressed genes in mouse ES cells
Carter, M. G., Stagg, C. A., Falco, G., Yoshikawa, T., Bassey, U. C., Aiba, K., Sharova, L. V., Shaik, N., & Ko, M. S. H. (2008) · Gene Expression Patterns · doi:10.1016/j.gep.2007.10.009 · Cited by 78
Bayesian integrated modeling of expression data: a case study on RhoG
Gupta, R., Greco, D., Auvinen, P., & Arjas, E. (2010) · BMC Bioinformatics · doi:10.1186/1471-2105-11-295 · Cited by 2
Cited by
Sorted by citations
Scenic: single-cell regulatory network inference and clustering.
Aibar, S., González-Blas, C. B., Moerman, T., Huynh-Thu, V. A., Imrichova, H., Hulselmans, G., Rambow, F., Marine, J.-C., Geurts, P., Aerts, J., et al. (2017) · Nature Methods · doi:10.1038/nmeth.4463 · Cited by 6,520
Hafemeister, C., & Satija, R. (2019) · Genome Biology · doi:10.1186/s13059-019-1874-1 · Cited by 4,479
“Notably, while recent normalization strategies leverage more advanced strategies to learn cell “size factors” [7, 20], the use of a single factor will introduce distinct effects on different gene sets, given their average abundance.”
BackgroundDeep generative modeling for single-cell transcriptomics
Lopez, R., Regier, J., Cole, M. B., Jordan, M. I., & Yosef, N. (2018) · Nature Methods · doi:10.1038/s41592-018-0229-2 · Cited by 2,530
Regev, A., Teichmann, S. A., Lander, E. S., Amit, I., Benoist, C., Birney, E., Bodenmiller, B., Campbell, P., Carninci, P., Clatworthy, M., et al. (2017) · eLife · doi:10.7554/elife.27041 · Cited by 2,232
Self-citationMcCarthy, D. J., Campbell, K. R., Lun, A. T. L., & Wills, Q. F. (2017) · Bioinformatics · doi:10.1093/bioinformatics/btw777 · Cited by 1,852
Metadata
- Authors
- Vallejos, C. A., Marioni, J. C., & Richardson, S.
- Affiliations
- European Bioinformatics Institute (GB)
- MRC Biostatistics Unit (GB)
- Corresponding author
- Vallejos, Catalina A.
- Marioni, John C.
- Richardson, Sylvia
- Venue
- PLOS Computational Biology
- Publisher
- Public Library of Science (PLoS)
- Published
- 2015-06-24
- Volume
- 11
- Issue
- 6
- Pages
- e1004333
- ISSN
- 1553-734X (ISSN-L)
- 1553-7358
- PMC
- PMC4480965
- OpenAlex
- W839653734
- Cited by
- 302
- References
- 20
- Citations by year
- 2026: 10 · 2025: 16 · 2024: 27 · 2023: 32 · 2022: 24 · 2021: 44 · 2020: 28 · 2019: 31 · 2018: 37 · 2017: 35 · 2016: 18
- FWCI
- 13.02
- Type
- journal article
- Language
- en
- Open access
- gold
- doi.org
- Licence
- Locations
- PLoS Computational Biology (publishedVersion, cc-by)
- PubMed Central (publishedVersion, cc-by)
- PubMed (publishedVersion)
- RePEc: Research Papers in Economics (submittedVersion)
- DOAJ (DOAJ: Directory of Open Access Journals) (submittedVersion, cc-by-sa)
- UCL Discovery (University College London) (submittedVersion)
- Figshare (submittedVersion, cc-by)
- Spiral (Imperial College London) (submittedVersion, cc-by)
- Funders
- European Bioinformatics Institute
- Cancer Research UK (22231)
- Medical Research Council
- Topics
- Life Sciences › Biochemistry, Genetics and Molecular Biology › Molecular Biology › Single-cell and spatial transcriptomics
- Life Sciences › Biochemistry, Genetics and Molecular Biology › Molecular Biology › Gene expression and cancer classification
- Life Sciences › Biochemistry, Genetics and Molecular Biology › Molecular Biology › Genomics and Phylogenetic Studies
- Keywords
- single-cell RNA sequencing, cellular heterogeneity, Bayesian hierarchical model, technical noise, mouse embryonic stem cells, gene expression variation
- MeSH terms
- Animals, Bayes Theorem, RNA, Messenger, Reproducibility of Results, Computational Biology, Oligonucleotide Array Sequence Analysis, Gene Expression Profiling, Mice, Embryonic Stem Cells, Single-Cell Analysis
About these checks
Registry, retraction, Cites and statistics results are computed, not judged, with one exception: a printed reference that no index lists is read once by a model before it counts as a citation error. Claims are extracted by a model and kept only when their quote appears verbatim in the text; each cited source is then checked, with a model’s help, for whether it says what the claim relies on. Those verdicts can be wrong — read the claim’s quote and the cited source before relying on one.
Statistics and arithmetic are recomputed, not judged.
Confidence bands are shown only for fields calibrated on our annotated test set. None is calibrated yet, so no band is shown.
What counts as a claim ›How we measure confidence ›How we check this ›
Are you an author, or do you see a problem with this page? Request a review
