

Feed-Forward versus Feedback Inhibition in a Basic Olfactory Circuit
Open accessThe DOI matches its Crossref record; 71 of the 71 references it cites were found in a registry or an index.
Abstract
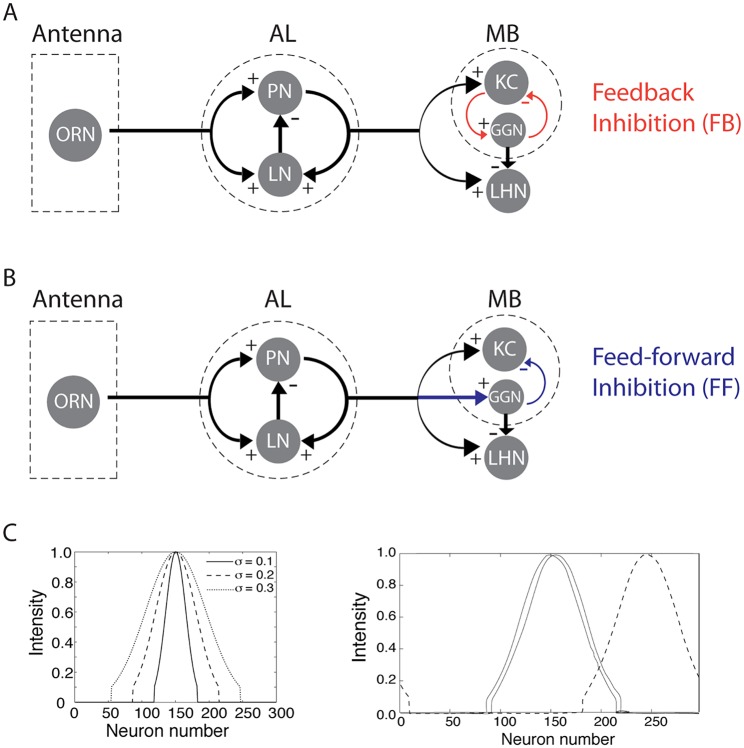
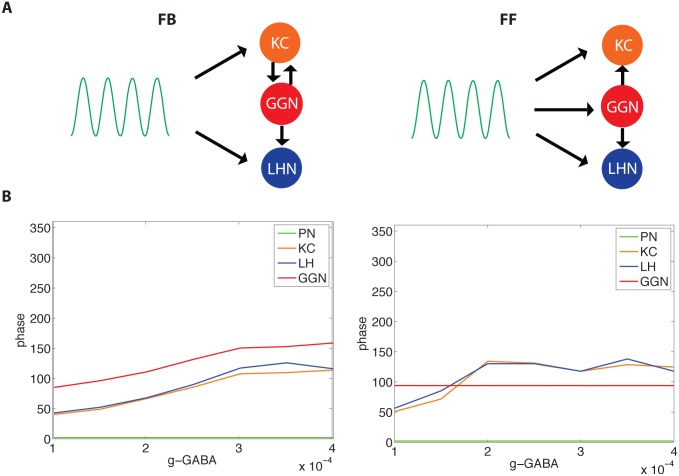
Inhibitory interneurons play critical roles in shaping the firing patterns of principal neurons in many brain systems. Despite difference in the anatomy or functions of neuronal circuits containing inhibition, two basic motifs repeatedly emerge: feed-forward and feedback. In the locust, it was proposed that a subset of lateral horn interneurons (LHNs), provide feed-forward inhibition onto Kenyon cells (KCs) to maintain their sparse firing--a property critical for olfactory learning and memory. But recently it was established that a single inhibitory cell, the giant GABAergic neuron (GGN), is the main and perhaps sole source of inhibition in the mushroom body, and that inhibition from this cell is mediated by a feedback (FB) loop including KCs and the GGN. To clarify basic differences in the effects of feedback vs. feed-forward inhibition in circuit dynamics we here use a model of the locust olfactory system. We found both inhibitory motifs were able to maintain sparse KCs responses and provide optimal odor discrimination. However, we further found that only FB inhibition could create a phase response consistent with data recorded in vivo. These findings describe general rules for feed-forward versus feedback inhibition and suggest GGN is potentially capable of providing the primary source of inhibition to the KCs. A better understanding of how inhibitory motifs impact post-synaptic neuronal activity could be used to reveal unknown inhibitory structures within biological networks.
Overview
The claims and statistics of this paper haven’t been checked yet.
Free: it reads the open-access text and checks the first 5 claims that cite a source we can check. Create a free account to check every claim.
Integrity signals
Registry
Cites
Statistics
Figures


Verification
Claims the paper makes
The claims and statistics of this paper haven’t been checked yet.
Free: it reads the open-access text and checks the first 5 claims that cite a source we can check. Create a free account to check every claim.
Claims other papers make about this one
Each is checked against this paper’s own text: does it say what the citing paper says it does?
In the citing paper
“The reciprocal loop circuit motif, in which X excites Y and Y inhibits X, can modulate the duration and magnitude of incoming excitatory signals and prevent an overly excited state, but can also lead to the emergence of oscillations, because the feedback inhibition of Y cannot fully suppress the firing of X47,48.”
From Comparative connectomics of Drosophila descending and ascending neurons (2025) · cites this paper as [47]
Self-check
Percentages, sums and reported differences re-computed from the paper’s own numbers.
The self-check needs the paper’s full text.
Citations
Cites
Hodgkin, A. L., & Huxley, A. F. (1952) · The Journal of Physiology · doi:10.1113/jphysiol.1952.sp004764 · Cited by 23,191 · cited 2×
“Membrane potentials: PN and LN membrane potential equations [26]”
BackgroundMethodMarr, D. (1969) · The Journal of Physiology · doi:10.1113/jphysiol.1969.sp008820 · Cited by 3,253 · cited 1×
“, olfactory cortex [52], hippocampus [4, 53], cerebellum [54, 55], LGN [56]), feedforward inhibition mediated by a population of inhibitory cells in the locust lateral horn (LH) was until recently thought to provide the necessary inhibitory input to the Kenyon cells (KCs) of the mushroom body [9, 23].”
BackgroundHow Inhibition Shapes Cortical Activity
Isaacson, J. S., & Scanziani, M. (2011) · Neuron · doi:10.1016/j.neuron.2011.09.027 · Cited by 1,678
The role of phase synchronization in memory processes
Fell, J., & Axmacher, N. (2011) · Nature Reviews Neuroscience · doi:10.1038/nrn2979 · Cited by 1,620 · cited 3×
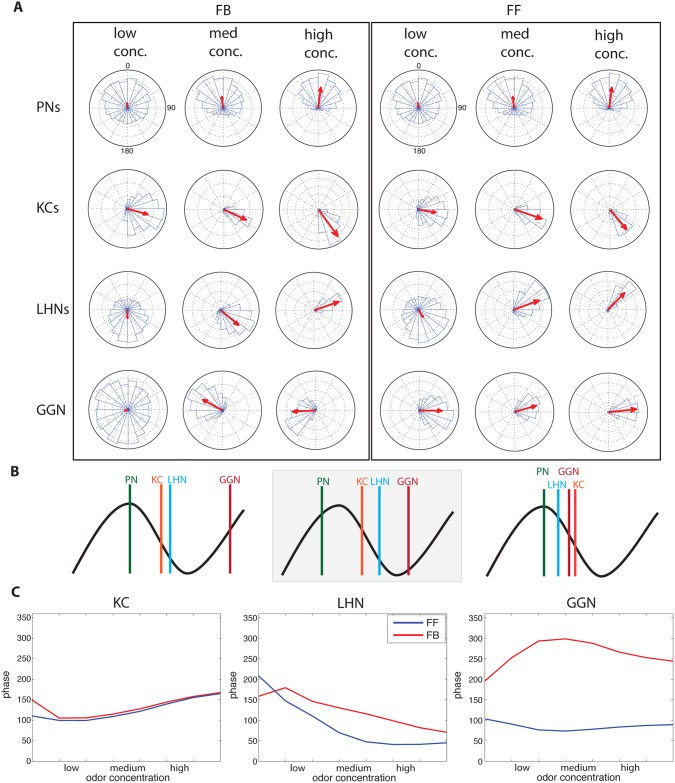
“Since plasticity of the KCs-> bLN-2 pathway is based on spike timing [16], the stability of spike timing in KCs may support reliable synaptic changes and communication between the KCs and bLN-2s [63, 64] The FB inhibitory motif produced spike phase responses matching those observed in vivo.”
BackgroundMethodSparse coding of sensory inputs
Olshausen, B. A., & Field, D. J. (2004) · Current Opinion in Neurobiology · doi:10.1016/j.conb.2004.07.007 · Cited by 1,404 · cited 1×
“Sparse codes support learning and memory by reducing interference between memory traces, increase storage capacity, and save energy expended by action potentials [16, 18, 50, 51].”
BackgroundMushroom body memoir: from maps to models
Heisenberg, M. (2003) · Nature Reviews Neuroscience · doi:10.1038/nrn1074 · Cited by 1,286
Bronshtein, I. N., Semendyayev, K. A., Musiol, G., & Muehlig, H. (2004) · Springer eBooks · doi:10.1007/978-3-662-05382-9 · Cited by 1,239
Enforcement of Temporal Fidelity in Pyramidal Cells by Somatic Feed-Forward Inhibition
Pouille, F., & Scanziani, M. (2001) · Science · doi:10.1126/science.1060342 · Cited by 1,097
Kanerva, P. (1988) · Medical Entomology and Zoology · Cited by 976
Oscillations and Sparsening of Odor Representations in the Mushroom Body
Perez-Orive, J., Mazor, O., Turner, G. C., Cassenaer, S., Wilson, R. I., & Laurent, G. (2002) · Science · doi:10.1126/science.1070502 · Cited by 806 · cited 6×
“Anatomical evidence suggests that GGN inhibits both the KCs in the mushroom body (MB) and the LHNs in the lateral horn (LH), yet KCs fire sparsely while LHNs respond to odors with dense spiking [9, 12].”
BackgroundResultInfluentialWhole brain resting-state analysis reveals decreased functional connectivity in major depression
Veer, I. M. (2010) · Frontiers in Systems Neuroscience · doi:10.3389/fnsys.2010.00041 · Cited by 753
Olfactory network dynamics and the coding of multidimensional signals
Laurent, G. (2002) · Nature Reviews Neuroscience · doi:10.1038/nrn964 · Cited by 732 · cited 1×
“Sparse codes support learning and memory by reducing interference between memory traces, increase storage capacity, and save energy expended by action potentials [16, 18, 50, 51].”
BackgroundDestexhe, A., Mainen, Z. F., & Sejnowski, T. J. (1994) · Journal of Computational Neuroscience · doi:10.1007/bf00961734 · Cited by 623 · cited 1×
“Fast GABA and nicotinic cholinergic synaptic currents to LNs and PNs [28] are modeled by first-order activation schemes (see review in [30]).”
BackgroundIntensity versus Identity Coding in an Olfactory System
Stopfer, M., Jayaraman, V., & Laurent, G. (2003) · Neuron · doi:10.1016/j.neuron.2003.08.011 · Cited by 610
Self-citationModeling of spiking-bursting neural behavior using two-dimensional map
Rulkov, N. F. (2002) · Physical Review E · doi:10.1103/physreve.65.041922 · Cited by 500 · cited 2×
“βn and σn describe external influences on the system, such as synaptic inputs (In ); α, σ, and μ are parameters that affect spiking patterns of the model [34, 35].”
BackgroundMethodEncoding of Olfactory Information with Oscillating Neural Assemblies
Laurent, G., & Davidowitz, H. (1994) · Science · doi:10.1126/science.265.5180.1872 · Cited by 488 · cited 1×
“No attempt was made to produce intrinsic resonant oscillations (pacemaker properties) in LNs or PNs because such properties have never been observed in locust LNs or PNs [27, 28].”
BackgroundNeuronal assemblies of the Drosophila mushroom body
Tanaka, N. K., Tanimoto, H., & Ito, K. (2008) · Journal of Comparative Neurology · doi:10.1002/cne.21692 · Cited by 470 · cited 1×
“The MB is connected to the LH through extrinsic neurons [42, 43].”
BackgroundOdor Representations in Olfactory Cortex: “Sparse” Coding, Global Inhibition, and Oscillations
Poo, C., & Isaacson, J. S. (2009) · Neuron · doi:10.1016/j.neuron.2009.05.022 · Cited by 464
The Role of Drosophila Mushroom Body Signaling in Olfactory Memory
McGuire, S. E., Le, P. T., & Davis, R. L. (2001) · Science · doi:10.1126/science.1062622 · Cited by 456
Feed-forward inhibition in the hippocampal formation
BUZSAKI, G. (1984) · Progress in Neurobiology · doi:10.1016/0301-0082(84)90023-6 · Cited by 453 · cited 1×
“, olfactory cortex [52], hippocampus [4, 53], cerebellum [54, 55], LGN [56]), feedforward inhibition mediated by a population of inhibitory cells in the locust lateral horn (LH) was until recently thought to provide the necessary inhibitory input to the Kenyon cells (KCs) of the mushroom body [9, 23].”
BackgroundDynamical representation of odors by oscillating and evolving neural assemblies
Laurent, G. (1996) · Trends in Neurosciences · doi:10.1016/s0166-2236(96)10054-0 · Cited by 346 · cited 8×
“No attempt was made to produce intrinsic resonant oscillations (pacemaker properties) in LNs or PNs because such properties have never been observed in locust LNs or PNs [27, 28].”
BackgroundMethodInfluentialDendritic coincidence detection of EPSPs and action potentials
Stuart, G. J., & Häusser, M. (2001) · Nature Neuroscience · doi:10.1038/82910 · Cited by 344
A dimorphic pheromone circuit in Drosophila from sensory input to descending output
Ruta, V., Datta, S. R., Vasconcelos, M. L., Freeland, J., Looger, L. L., & Axel, R. (2010) · Nature · doi:10.1038/nature09554 · Cited by 344 · cited 1×
“In the fly there is evidence that the LH processes odors that carry meaning innately [41, 48].”
BackgroundHebbian STDP in mushroom bodies facilitates the synchronous flow of olfactory information in locusts
Cassenaer, S., & Laurent, G. (2007) · Nature · doi:10.1038/nature05973 · Cited by 331 · cited 2×
“In the locust, the KCs excite extrinsic MB neurons, some of which have been shown to have spike timing dependent plasticity (STDP) at the synapse from the KCs to the extrinsic neurons [16, 58].”
BackgroundSparse, decorrelated odor coding in the mushroom body enhances learned odor discrimination
Lin, A. C., Bygrave, A. M., de Calignon, A., Lee, T., & Miesenböck, G. (2014) · Nature Neuroscience · doi:10.1038/nn.3660 · Cited by 321 · cited 4×
“The activation of this neuron was shown to enhance odor memory [13].”
BackgroundInfluentialFeed‐forward inhibition shapes the spike output of cerebellar Purkinje cells
Mittmann, W., Koch, U., & Häusser, M. (2005) · The Journal of Physiology · doi:10.1113/jphysiol.2004.075028 · Cited by 317 · cited 1×
“, olfactory cortex [52], hippocampus [4, 53], cerebellum [54, 55], LGN [56]), feedforward inhibition mediated by a population of inhibitory cells in the locust lateral horn (LH) was until recently thought to provide the necessary inhibitory input to the Kenyon cells (KCs) of the mushroom body [9, 23].”
BackgroundInput normalization by global feedforward inhibition expands cortical dynamic range
Pouille, F., Marin-Burgin, A., Adesnik, H., Atallah, B. V., & Scanziani, M. (2009) · Nature Neuroscience · doi:10.1038/nn.2441 · Cited by 306 · cited 1×
“We found that both FF and FB inhibitory motifs generated sparse codes, supporting previous work showing both motifs increase KC excitatory current threshold to compensate for changing input intensity elicited by changing odor concentrations [1, 3, 7, 11, 52, 59].”
BackgroundWho reads temporal information contained across synchronized and oscillatory spike trains?
MacLeod, K., Bäcker, A., & Laurent, G. (1998) · Nature · doi:10.1038/27201 · Cited by 303
Short-term memory in olfactory network dynamics
Stopfer, M., & Laurent, G. (1999) · Nature · doi:10.1038/45244 · Cited by 277 · cited 1×
“blocked, in the fly and locust, by the GABA antagonist picrotoxin, the sparseness of the odor response in the MB decreases [9, 23], causing an increase in inter-odor response correlation, preventing insects from discriminating similar (but not dissimilar) odors [13, 24].”
BackgroundSelf-citationMushroom body efferent neurons responsible for aversive olfactory memory retrieval in Drosophila
Séjourné, J., Plaçais, P.-Y., Aso, Y., Siwanowicz, I., Trannoy, S., Thoma, V., Tedjakumala, S. R., Rubin, G. M., Tchénio, P., Ito, K., et al. (2011) · Nature Neuroscience · doi:10.1038/nn.2846 · Cited by 265 · cited 1×
“The MB is connected to the LH through extrinsic neurons [42, 43].”
BackgroundThe GABAergic anterior paired lateral neuron suppresses and is suppressed by olfactory learning
Liu, X., & Davis, R. L. (2009) · Nature Neuroscience · doi:10.1038/nn.2235 · Cited by 250
Neurons and circuits for odor processing in the piriform cortex
Bekkers, J. M., & Suzuki, N. (2013) · Trends in Neurosciences · doi:10.1016/j.tins.2013.04.005 · Cited by 238
Model of Transient Oscillatory Synchronization in the Locust Antennal Lobe
Bazhenov, M., Stopfer, M., Rabinovich, M., Huerta, R., Abarbanel, H. D. I., Sejnowski, T. J., & Laurent, G. (2001) · Neuron · doi:10.1016/s0896-6273(01)00284-7 · Cited by 229
Self-citationConditional modulation of spike-timing-dependent plasticity for olfactory learning
Cassenaer, S., & Laurent, G. (2012) · Nature · doi:10.1038/nature10776 · Cited by 216 · cited 7×
“FB inhibition exists in the MB of fly, cockroach, locust, honeybee, and mammal [13, 14, 16, 17].”
BackgroundInfluentialNormalization for Sparse Encoding of Odors by a Wide-Field Interneuron
Papadopoulou, M., Cassenaer, S., Nowotny, T., & Laurent, G. (2011) · Science · doi:10.1126/science.1201835 · Cited by 214 · cited 2×
“In the locust, a single giant GABAergic neuron (GGN), rather than a group of LHNs, has been shown to provide inhibition to the MB calyx [12, 19].”
BackgroundMethodSimulation of Gamma Rhythms in Networks of Interneurons and Pyramidal Cells
Traub, R. D., Jefferys, J. G. R., & Whittington, M. A. (1997) · Journal of Computational Neuroscience · doi:10.1023/a:1008839312043 · Cited by 205 · cited 2×
“Fast potassium current (IK)[29] IK 1⁄4 gKn(4)ðV EKÞ;”
BackgroundSpatial and Temporal Distribution of Odorant-Evoked Activity in the Piriform Cortex
Rennaker, R. L., Chen, C.-F. F., Ruyle, A. M., Sloan, A. M., & Wilson, D. A. (2007) · The Journal of Neuroscience · doi:10.1523/jneurosci.4072-06.2007 · Cited by 197
GABAergic synapses in the antennal lobe and mushroom body of the locust olfactory system
Leitch, B., & Laurent, G. (1996) · The Journal of Comparative Neurology · doi:10.1002/(sici)1096-9861(19960902)372:4<487::aid-cne1>3.0.co;2-0 · Cited by 186 · cited 1×
“In the locust AL, LNs are synaptically connected to other LNs and to PNs [32].”
BackgroundOscillations in Large-Scale Cortical Networks: Map-Based Model
Rulkov, N. F., Timofeev, I., & Bazhenov, M. (2004) · Journal of Computational Neuroscience · doi:10.1023/b:jcns.0000037683.55688.7e · Cited by 185 · cited 4×
“Inhibitory GABAergic synapse was described as following [35]”
BackgroundMethodSelf-citationA physiologically-inspired model of numerical classification based on graded stimulus coding
Pearson, J. (2010) · Frontiers in Behavioral Neuroscience · doi:10.3389/neuro.08.001.2010 · Cited by 184
GABA‐immunoreactive neurons in the mushroom bodies of the honeybee: An electron microscopic study
Ganeshina, O., & Menzel, R. (2001) · Journal of Comparative Neurology · doi:10.1002/cne.1287 · Cited by 176 · cited 3×
“(FF connectivity may exist in analogous circuits in other species: honeybees provide evidence for synapses between PNs and inhibitory fibers in the MB [8]).”
BackgroundKing, P. D., Zylberberg, J., & DeWeese, M. R. (2013) · Journal of Neuroscience · doi:10.1523/jneurosci.4188-12.2013 · Cited by 162 · cited 1×
“We found that both FF and FB inhibitory motifs generated sparse codes, supporting previous work showing both motifs increase KC excitatory current threshold to compensate for changing input intensity elicited by changing odor concentrations [1, 3, 7, 11, 52, 59].”
BackgroundEncoding a temporally structured stimulus with a temporally structured neural representation
Brown, S. L., Joseph, J., & Stopfer, M. (2005) · Nature Neuroscience · doi:10.1038/nn1559 · Cited by 161 · cited 1×
“Physiological results show the initial part of an odor presentation is sufficient for successful odor classification [61], and every part of the odor response contains enough information for successful classification [62].”
BackgroundSelf-citationMushroom Body Output Neurons Encode Odor–Reward Associations
Strube-Bloss, M. F., Nawrot, M. P., & Menzel, R. (2011) · The Journal of Neuroscience · doi:10.1523/jneurosci.2583-10.2011 · Cited by 157 · cited 1×
“Some of these extrinsic MB output neurons appear to contain odor reward information [44].”
BackgroundOlfactory coding in the insect brain: data and conjectures
Galizia, C. G. (2014) · European Journal of Neuroscience · doi:10.1111/ejn.12558 · Cited by 151
Cavallari, S., Panzeri, S., & Mazzoni, A. (2014) · Frontiers in Neural Circuits · doi:10.3389/fncir.2014.00012 · Cited by 145
Stokes, C. C. A., & Isaacson, J. S. (2010) · Neuron · doi:10.1016/j.neuron.2010.06.029 · Cited by 144
Timing and Specificity of Feed-Forward Inhibition within the LGN
Blitz, D. M., & Regehr, W. G. (2005) · Neuron · doi:10.1016/j.neuron.2005.01.033 · Cited by 143 · cited 2×
“, olfactory cortex [52], hippocampus [4, 53], cerebellum [54, 55], LGN [56]), feedforward inhibition mediated by a population of inhibitory cells in the locust lateral horn (LH) was until recently thought to provide the necessary inhibitory input to the Kenyon cells (KCs) of the mushroom body [9, 23].”
BackgroundA Pair of Inhibitory Neurons Are Required to Sustain Labile Memory in the Drosophila Mushroom Body
Pitman, J. L., Huetteroth, W., Burke, C. J., Krashes, M. J., Lai, S.-L., Lee, T., & Waddell, S. (2011) · Current Biology · doi:10.1016/j.cub.2011.03.069 · Cited by 136 · cited 3×
“FB inhibition exists in the MB of fly, cockroach, locust, honeybee, and mammal [13, 14, 16, 17].”
BackgroundHeterotypic Gap Junctions between Two Neurons in the Drosophila Brain Are Critical for Memory
Wu, C., Shih, M.-F. M., Lai, J. S.-Y., Yang, H.-T., Turner, G. C., Chen, L., & Chiang, A. (2011) · Current Biology · doi:10.1016/j.cub.2011.02.041 · Cited by 127 · cited 1×
“The structures within the MB, including its feedback circuits, are important for memory [16, 45, 46].”
BackgroundIntrinsic and Circuit Properties Favor Coincidence Detection for Decoding Oscillatory Input
Perez-Orive, J., Bazhenov, M., & Laurent, G. (2004) · The Journal of Neuroscience · doi:10.1523/jneurosci.1084-04.2004 · Cited by 124 · cited 2×
“, olfactory cortex [52], hippocampus [4, 53], cerebellum [54, 55], LGN [56]), feedforward inhibition mediated by a population of inhibitory cells in the locust lateral horn (LH) was until recently thought to provide the necessary inhibitory input to the Kenyon cells (KCs) of the mushroom body [9, 23].”
BackgroundSelf-citationAdaptive regulation of sparseness by feedforward inhibition
Assisi, C. G., Stopfer, M., Laurent, G., & Bazhenov, M. (2007) · Nature Neuroscience · doi:10.1038/nn1947 · Cited by 114 · cited 3×
“Computer models revealed that FF inhibition could be highly efficient for maintaining the sparseness of responses in KCs across a broad range of odor concentrations [10, 11].”
BackgroundSelf-citationGABAergic Projection Neurons Route Selective Olfactory Inputs to Specific Higher-Order Neurons
Liang, L., Li, Y., Potter, C. J., Yizhar, O., Deisseroth, K., Tsien, R. W., & Luo, L. (2013) · Neuron · doi:10.1016/j.neuron.2013.06.014 · Cited by 113
Grünewald, B. (1999) · Journal of Comparative Physiology A · doi:10.1007/s003590050417 · Cited by 111 · cited 1×
“Inhibition in the MB changes with learning [25].”
BackgroundA spatiotemporal coding mechanism for background-invariant odor recognition
Saha, D., Leong, K., Li, C., Peterson, S. M., Siegel, G., & Raman, B. (2013) · Nature Neuroscience · doi:10.1038/nn.3570 · Cited by 110 · cited 1×
“Physiological results show the initial part of an odor presentation is sufficient for successful odor classification [61], and every part of the odor response contains enough information for successful classification [62].”
BackgroundOdor representations in olfactory cortex
Poo, C. (2010) · eScholarship (California Digital Library) · Cited by 101
Self-organization in the olfactory system: one shot odor recognition in insects
Nowotny, T., Huerta, R., Abarbanel, H. D. I., & Rabinovich, M. I. (2005) · Biological Cybernetics · doi:10.1007/s00422-005-0019-7 · Cited by 96 · cited 4×
“Since GGN is known to produce non-spiking response [11], we modeled it using the following equations:”
BackgroundMethodInfluentialFunctional Analysis of a Higher Olfactory Center, the Lateral Horn
Gupta, N., & Stopfer, M. (2012) · Journal of Neuroscience · doi:10.1523/jneurosci.1066-12.2012 · Cited by 93 · cited 10×
“Anatomical evidence suggests that GGN inhibits both the KCs in the mushroom body (MB) and the LHNs in the lateral horn (LH), yet KCs fire sparsely while LHNs respond to odors with dense spiking [9, 12].”
BackgroundMethodResultSelf-citationSynaptic Learning Rules and Sparse Coding in a Model Sensory System
Finelli, L. A., Haney, S., Bazhenov, M., Stopfer, M., & B, T. J. S. A. (2008) · PLoS Computational Biology · doi:10.1371/journal.pcbi.1000062 · Cited by 91 · cited 1×
“Population sparseness was used to measure how sparsely the KC population responded to each odor [37]:”
MethodSelf-citationRelationship between Afferent and Central Temporal Patterns in the Locust Olfactory System
Wehr, M., & Laurent, G. (1999) · Journal of Neuroscience · doi:10.1523/jneurosci.19-01-00381.1999 · Cited by 80 · cited 1×
“We used μ = 100 Hz for the simulations presented here to match the membrane potential fluctuations observed in postsynaptic PNs in vivo [33].”
MethodVickers, N. J., & Baker, T. C. (1996) · Journal of Comparative Physiology A · doi:10.1007/bf00225831 · Cited by 75 · cited 1×
“Insects can make decisions in olfactory tasks within 300-500 ms of the start of an odor presentation [60].”
BackgroundHaehnel, M., & Menzel, R. (2010) · Frontiers in Systems Neuroscience · doi:10.3389/fnsys.2010.00161 · Cited by 73
Distribution and coverage of beta cells in the cat retina
Stein, J. J., Johnson, S. A., & Berson, D. M. (1996) · The Journal of Comparative Neurology · doi:10.1002/(sici)1096-9861(19960902)372:4<597::aid-cne8>3.0.co;2-# · Cited by 62
Associative olfactory learning in the desert locust, Schistocerca gregaria
Simões, P. M. V., Ott, S. R., & Niven, J. E. (2011) · Journal of Experimental Biology · doi:10.1242/jeb.055806 · Cited by 62
A Temporal Channel for Information in Sparse Sensory Coding
Gupta, N., & Stopfer, M. (2014) · Current Biology · doi:10.1016/j.cub.2014.08.021 · Cited by 47 · cited 2×
“However, neurons examined in the locust LH respond robustly to many types of odor, ruling out a simple role in encoding innate responses [49].”
BackgroundSelf-citationAlarm pheromone processing in the ant brain: an evolutionary perspective
Mizunami, M., Yamagata, N., & Nishino, H. (2010) · Frontiers in Behavioral Neuroscience · doi:10.3389/fnbeh.2010.00028 · Cited by 47
Oscillations and Synchrony in Large-scale Cortical Network Models
Rulkov, N. F., & Bazhenov, M. (2008) · Journal of Biological Physics · doi:10.1007/s10867-008-9079-y · Cited by 41
Self-citationThree classes of GABA-like immunoreactive neurons in the mushroom body of the cockroach
Yamazaki, Y., Nishikawa, M., & Mizunami, M. (1998) · Brain Research · doi:10.1016/s0006-8993(97)01515-1 · Cited by 41 · cited 1×
“FB inhibition exists in the MB of fly, cockroach, locust, honeybee, and mammal [13, 14, 16, 17].”
BackgroundMasuda-Nakagawa, L. M., Ito, K., Awasaki, T., & O'Kane, C. J. (2014) · Frontiers in Neural Circuits · doi:10.3389/fncir.2014.00035 · Cited by 37
Forward and Back: Motifs of Inhibition in Olfactory Processing
Bazhenov, M., & Stopfer, M. (2010) · Neuron · doi:10.1016/j.neuron.2010.07.023 · Cited by 21
Self-citationOlfactory Coding: Tagging and Tuning Odor-Activated Synapses for Memory
Aldworth, Z., & Stopfer, M. (2012) · Current Biology · doi:10.1016/j.cub.2012.02.047 · Cited by 4 · cited 1×
“Since plasticity of the KCs-> bLN-2 pathway is based on spike timing [16], the stability of spike timing in KCs may support reliable synaptic changes and communication between the KCs and bLN-2s [63, 64] The FB inhibitory motif produced spike phase responses matching those observed in vivo.”
BackgroundSelf-citation
Cited by
Re-evaluating Circuit Mechanisms Underlying Pattern Separation
Cayco-Gajic, N. A., & Silver, R. A. (2019) · Neuron · doi:10.1016/j.neuron.2019.01.044 · Cited by 222
“Feedback inhibition adaptively regulates excitability (Hamann et al., 2002; Papadopoulou et al., 2011; Gupta and Stopfer 2012; Lin et al., 2014; Temprana et al., 2014; Kee et al., 2015), in part by matching spike threshold to the overall activity level (Mitchell and Silver, 2003; Billings et al.”
Gorur-Shandilya, S., Demir, M., Long, J., Clark, D. A., & Emonet, T. (2017) · eLife · doi:10.7554/elife.27670 · Cited by 97
“Thus it could be a useful tool in modeling ORN responses received by PNs, or in constructing computational models of the antennal lobe (Assisi et al., 2011; Bazhenov et al., 2001; Berck et al., 2016; Capurro et al., 2012; Chong et al., 2012; Hopfield, 1991; Kee et al., 2015; Koulakov et al., 2007; Luo et al., 2010; Sa…”
Central processing in the mushroom bodies
Stopfer, M. (2014) · Current Opinion in Insect Science · doi:10.1016/j.cois.2014.10.009 · Cited by 62
Self-citationComparative connectomics of Drosophila descending and ascending neurons
Stürner, T., Brooks, P., Serratosa Capdevila, L., Morris, B. J., Javier, A., Fang, S., Gkantia, M., Cachero, S., Beckett, I. R., Marin, E. C., et al. (2025) · Nature · doi:10.1038/s41586-025-08925-z · Cited by 43
A neural network model for familiarity and context learning during honeybee foraging flights
Müller, J., Nawrot, M. P., Menzel, R., & Landgraf, T. (2017) · Biological Cybernetics · doi:10.1007/s00422-017-0732-z · Cited by 39
Metadata
- Authors
- Kee, T., Sanda, P., Gupta, N., Stopfer, M., & Bazhenov, M.
- Affiliations
- University of California, Riverside (US)
- Indian Institute of Technology Kanpur (IN)
- National Institutes of Health (US)
- Corresponding author
- Bazhenov, Maxim
- Venue
- PLOS Computational Biology
- Publisher
- Public Library of Science (PLoS)
- Published
- 2015-10-12
- Volume
- 11
- Issue
- 10
- Pages
- e1004531
- ISSN
- 1553-734X (ISSN-L)
- 1553-7358
- PMC
- PMC4601731
- OpenAlex
- W2130171498
- Cited by
- 40
- References
- 70
- Citations by year
- 2025: 3 · 2024: 5 · 2023: 3 · 2022: 2 · 2021: 3 · 2020: 5 · 2019: 6 · 2018: 3 · 2017: 5 · 2016: 4
- FWCI
- 1.87
- Type
- journal article
- Language
- en
- Open access
- gold
- doi.org
- Licence
- public-domain
- creativecommons.org/publicdomain/zero/1.0/ (vor)
- Locations
- PLoS Computational Biology (publishedVersion, public-domain)
- Europe PMC (PubMed Central) (publishedVersion, public-domain)
- PubMed Central (publishedVersion, public-domain)
- PubMed (publishedVersion)
- DOAJ (DOAJ: Directory of Open Access Journals) (submittedVersion, cc-by-sa)
- Funders
- National Institute on Deafness and Other Communication Disorders (R01DC012943)
- Topics
- Life Sciences › Neuroscience › Cellular and Molecular Neuroscience › Neurobiology and Insect Physiology Research
- Life Sciences › Neuroscience › Cognitive Neuroscience › Neural dynamics and brain function
- Life Sciences › Neuroscience › Cellular and Molecular Neuroscience › Neuroscience and Neuropharmacology Research
- Keywords
- feedforward inhibition, product inhibition, olfactory circuitry, Kenyon cells, mushroom body, odor discrimination, phase response, locusts, inhibitory interneurons
- MeSH terms
- Action Potentials, Animals, Computer Simulation, Grasshoppers, Models, Neurological, Nerve Net, Neural Inhibition, Synaptic Transmission, Olfactory Pathways, Smell, Excitatory Postsynaptic Potentials, Mushroom Bodies, Feedback, Physiological
About these checks
Registry, retraction, Cites and statistics results are computed, not judged, with one exception: a printed reference that no index lists is read once by a model before it counts as a citation error. Claims are extracted by a model and kept only when their quote appears verbatim in the text; each cited source is then checked, with a model’s help, for whether it says what the claim relies on. Those verdicts can be wrong — read the claim’s quote and the cited source before relying on one.
Statistics and arithmetic are recomputed, not judged.
Confidence bands are shown only for fields calibrated on our annotated test set. None is calibrated yet, so no band is shown.
What counts as a claim ›How we measure confidence ›How we check this ›
Are you an author, or do you see a problem with this page? Request a review
Data sources
Bibliographic data: Semantic Scholar, OpenAlex, Crossref.
Contains information from the Semantic Scholar Academic Graph Datasets, made available under the ODC Attribution License (ODC-BY 1.0).
Semantic Scholar’s data is described in: Kinney, R., et al. (2023). The Semantic Scholar Open Data Platform. arXiv:2301.10140.
