

The DOI matches its Crossref record; 36 of the 36 references it cites were found in a registry or an index.
MAPS: Model-based analysis of long-range chromatin interactions from PLAC-seq and HiChIP experiments
Open accessPublished version of a preprint
Abstract
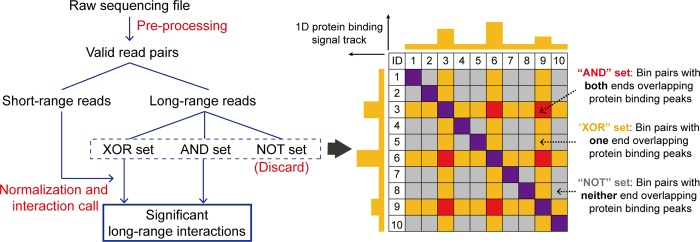
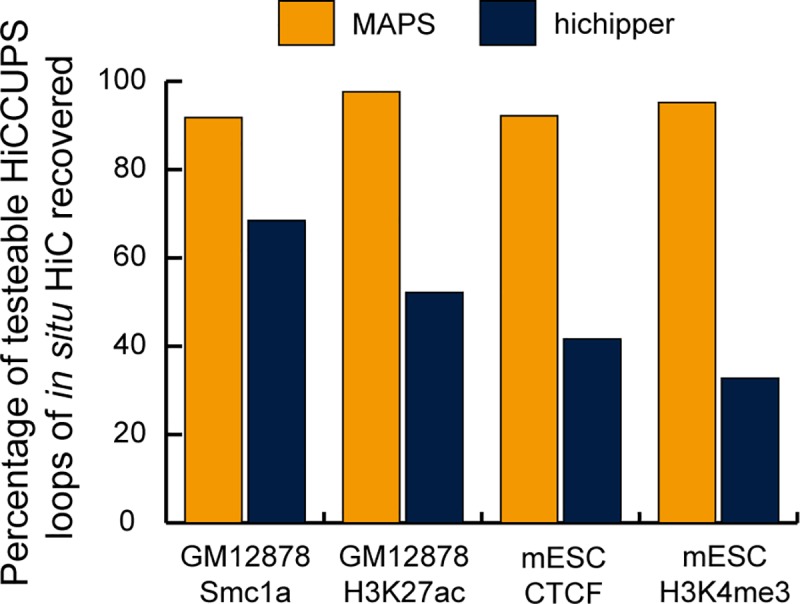
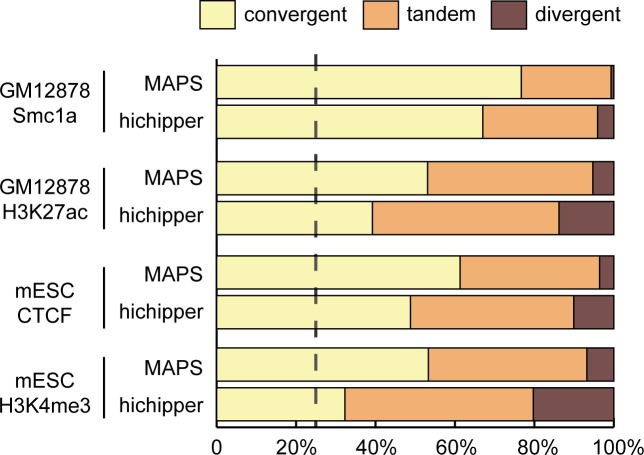
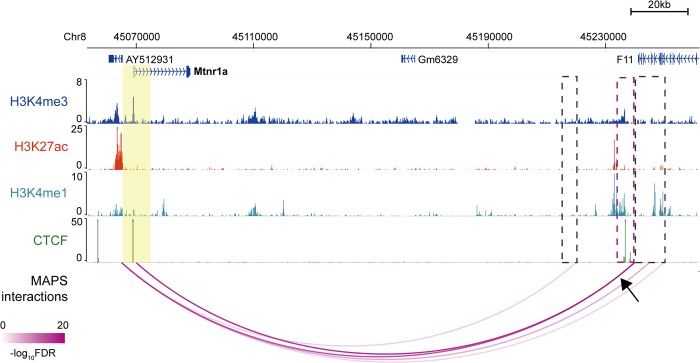
Hi-C and chromatin immunoprecipitation (ChIP) have been combined to identify long-range chromatin interactions genome-wide at reduced cost and enhanced resolution, but extracting information from the resulting datasets has been challenging. Here we describe a computational method, MAPS, Model-based Analysis of PLAC-seq and HiChIP, to process the data from such experiments and identify long-range chromatin interactions. MAPS adopts a zero-truncated Poisson regression framework to explicitly remove systematic biases in the PLAC-seq and HiChIP datasets, and then uses the normalized chromatin contact frequencies to identify significant chromatin interactions anchored at genomic regions bound by the protein of interest. MAPS shows superior performance over existing software tools in the analysis of chromatin interactions from multiple PLAC-seq and HiChIP datasets centered on different transcriptional factors and histone marks. MAPS is freely available at https://github.com/ijuric/MAPS.
Overview
The claims and statistics of this paper haven’t been checked yet.
Run the check — free, no account needed. It reads the open-access text and checks the sources it cites.
Integrity signals
Registry
Cites
Statistics
Figures
Verification
Claims the paper makes
The claims and statistics of this paper haven’t been checked yet.
Run the check — free, no account needed. It reads the open-access text and checks the sources it cites.
Claims other papers make about this one
Each is checked against this paper’s own text: does it say what the citing paper says it does?
The source backs part of the claim, not all of it — or backs it for a different population, condition or comparison.
In the citing paper
“Chromatin loops were identified between active promoters and distal regulatory regions in microglia, neurons and oligodendrocytes (26).”
From Brain cell type–specific enhancer–promoter interactome maps and disease - risk association (2019) · cites this paper as [26]
Experimental — accuracy not yet measured
Self-check
Percentages, sums and reported differences re-computed from the paper’s own numbers.
The self-check needs the paper’s full text.
Citations
Cites
Model-based Analysis of ChIP-Seq (MACS)
Zhang, Y., Liu, T., Meyer, C. A., Eeckhoute, J., Johnson, D. S., Bernstein, B. E., Nusbaum, C., Myers, R. M., Brown, M., Li, W., et al. (2008) · Genome Biology · doi:10.1186/gb-2008-9-9-r137 · Cited by 18,386
Self-citationA 3D Map of the Human Genome at Kilobase Resolution Reveals Principles of Chromatin Looping
Rao, S. S. P., Huntley, M. H., Durand, N. C., Stamenova, E. K., Bochkov, I. D., Robinson, J. T., Sanborn, A. L., Machol, I., Omer, A. D., Lander, E. S., et al. (2014) · Cell · doi:10.1016/j.cell.2014.11.021 · Cited by 9,212
Comprehensive Mapping of Long-Range Interactions Reveals Folding Principles of the Human Genome
Lieberman-Aiden, E., van Berkum, N. L., Williams, L., Imakaev, M., Ragoczy, T., Telling, A., Amit, I., Lajoie, B. R., Sabo, P. J., Dorschner, M. O., et al. (2009) · Science · doi:10.1126/science.1181369 · Cited by 8,898
Buenrostro, J. D., Giresi, P. G., Zaba, L. C., Chang, H. Y., & Greenleaf, W. J. (2013) · Nature Methods · doi:10.1038/nmeth.2688 · Cited by 6,422
Capturing Chromosome Conformation
Dekker, J., Rippe, K., Dekker, M., & Kleckner, N. (2002) · Science · doi:10.1126/science.1067799 · Cited by 3,652
Formation of chromosomal domains by loop extrusion
Fudenberg, G., Imakaev, M., Lu, C., Goloborodko, A., Abdennur, N., & Mirny, L. A. (2016) · Cell Reports · doi:10.1016/j.celrep.2016.04.085 · Cited by 2,003
Mediator and cohesin connect gene expression and chromatin architecture
Kagey, M. H., Newman, J. J., Bilodeau, S., Zhan, Y., Orlando, D. A., van Berkum, N. L., Ebmeier, C. C., Goossens, J., Rahl, P. B., Levine, S. S., et al. (2010) · Nature · doi:10.1038/nature09380 · Cited by 1,939
Formation of Chromosomal Domains by Loop Extrusion
Fudenberg, G., Imakaev, M., Lu, C. W., Goloborodko, A., Abdennur, N. A., & Mirny, L. (2015) · bioRxiv · doi:10.1101/024620 · Cited by 1,858
Sanborn, A. L., Rao, S. S. P., Huang, S.-C., Durand, N. C., Huntley, M. H., Jewett, A. I., Bochkov, I. D., Chinnappan, D., Cutkosky, A., Li, J., et al. (2015) · Proceedings of the National Academy of Sciences · doi:10.1073/pnas.1518552112 · Cited by 1,730
The long-range interaction landscape of gene promoters
Sanyal, A., Lajoie, B. R., Jain, G., & Dekker, J. (2012) · Nature · doi:10.1038/nature11279 · Cited by 1,489
Research works printed but not linked: 1
- CE Grant, 2011, FIMO: scanning for occurrences of a given motif, Bioinformatics (Oxford, England), 27, 1017, 10.1093/bioinformatics/btr064 · DOI · Paper page
Cited by
Sorted by citations
Brain cell type–specific enhancer–promoter interactome maps and disease - risk association
Nott, A., Holtman, I. R., Coufal, N. G., Schlachetzki, J. C. M., Yu, M., Hu, R., Han, C. Z., Pena, M., Xiao, J., Wu, Y., et al. (2019) · Science · doi:10.1126/science.aay0793 · Cited by 699
Self-citationCircular ecDNA promotes accessible chromatin and high oncogene expression
Wu, S., Turner, K. M., Nguyen, N., Raviram, R., Erb, M. L., Santini, J., Luebeck, J., Rajkumar, U., Diao, Y., Li, B., et al. (2019) · Nature · doi:10.1038/s41586-019-1763-5 · Cited by 661
“the minimum fold change range we used from MACC2 is the default [5-50].”
Self-citationAn ultra high-throughput method for single-cell joint analysis of open chromatin and transcriptome
Zhu, C., Yu, M., Huang, H., Juric, I., Abnousi, A., Hu, R., Lucero, J., Behrens, M. M., Hu, M., & Ren, B. (2019) · Nature Structural & Molecular Biology · doi:10.1038/s41594-019-0323-x · Cited by 344
Self-citationPromoter-proximal CTCF binding promotes distal enhancer-dependent gene activation
Kubo, N., Ishii, H., Xiong, X., Bianco, S., Meitinger, F., Hu, R., Hocker, J. D., Conte, M., Gorkin, D., Yu, M., et al. (2021) · Nature Structural & Molecular Biology · doi:10.1038/s41594-020-00539-5 · Cited by 289
Self-citationIdentification of significant chromatin contacts from HiChIP data by FitHiChIP
Bhattacharyya, S., Chandra, V., Vijayanand, P., & Ay, F. (2019) · Nature Communications · doi:10.1038/s41467-019-11950-y · Cited by 238
“A more recent tool, MAPS, 16 does not explicitly correct for this peak to RE site distance effect, which is also the case for our method.”
MethodSubtype-specific 3D genome alteration in acute myeloid leukaemia
Xu, J., Song, F., Lyu, H., Kobayashi, M., Zhang, B., Zhao, Z., Hou, Y., Wang, X., Luan, Y., Jia, B., et al. (2022) · Nature · doi:10.1038/s41586-022-05365-x · Cited by 208
Self-citationHuang, H., Zhu, Q., Jussila, A., Han, Y., Bintu, B., Kern, C., Conte, M., Zhang, Y., Bianco, S., Chiariello, A. M., et al. (2021) · Nature Genetics · doi:10.1038/s41588-021-00863-6 · Cited by 187
Self-citationUTX condensation underlies its tumour-suppressive activity
Shi, B., Li, W., Song, Y., Wang, Z., Jü, R., Ulman, A., Hu, J., Palomba, F., Zhao, Y., Le, J. P., et al. (2021) · Nature · doi:10.1038/s41586-021-03903-7 · Cited by 193
“suggesting that this nonsense mutation does not usually lead to transcript decay and should express a truncated UTX (1-554) b.”
InfluentialSelf-citationA supervised learning framework for chromatin loop detection in genome-wide contact maps
Salameh, T. J., Wang, X., Song, F., Zhang, B., Wright, S. M., Khunsriraksakul, C., Ruan, Y., & Yue, F. (2020) · Nature Communications · doi:10.1038/s41467-020-17239-9 · Cited by 165
Cell-type-specific 3D epigenomes in the developing human cortex
Song, M., Pebworth, M.-P., Yang, X., Abnousi, A., Fan, C., Wen, J., Rosen, J. D., Choudhary, M. N. K., Cui, X., Jones, I. R., et al. (2020) · Nature · doi:10.1038/s41586-020-2825-4 · Cited by 145
Self-citationKubo, N., Chen, P. B., Hu, R., Ye, Z., Sasaki, H., & Ren, B. (2024) · Molecular Cell · doi:10.1016/j.molcel.2024.02.030 · Cited by 99
Self-citationSnapHiC: a computational pipeline to identify chromatin loops from single-cell Hi-C data
Yu, M., Abnousi, A., Zhang, Y., Li, G., Lee, L., Chen, Z., Fang, R., Lagler, T. M., Yang, Y., Wen, J., et al. (2021) · Nature Methods · doi:10.1038/s41592-021-01231-2 · Cited by 92
“For oligodendrocytes, microglia and eight neuronal subtypes from human prefrontal cortex, we used MAPS-identified interactions from H3K4me3 PLAC-seq data of purified oligodendrocytes, microglia and neurons as their reference list, respectively 17 .”
MethodInfluentialSelf-citationSALL1 enforces microglia-specific DNA binding and function of SMADs to establish microglia identity
Fixsen, B. R., Han, C. Z., Zhou, Y., Spann, N. J., Saisan, P., Shen, Z., Balak, C., Sakai, M., Cobo, I., Holtman, I. R., et al. (2023) · Nature Immunology · doi:10.1038/s41590-023-01528-8 · Cited by 87
Self-citationDekker, J., Alber, F., Aufmkolk, S., Beliveau, B. J., Bruneau, B. G., Belmont, A. S., Bintu, L., Boettiger, A. N., Calandrelli, R., Distèche, C. M., et al. (2023) · Molecular Cell · doi:10.1016/j.molcel.2023.06.018 · Cited by 98
“15,16 Split-pool recognition of interactions by tag extension (SPRITE) TheSPRITEmethodusesextensivecross-linkingsothatspatially proximal groups of loci, and RNA molecules, are covalently linked.”
BackgroundSelf-citationSensory experience remodels genome architecture in neural circuit to drive motor learning
Yamada, T., Yang, Y., Valnegri, P., Juric, I., Abnousi, A., Markwalter, K. H., Guthrie, A. N., Godec, A., Oldenborg, A., Hu, M., et al. (2019) · Nature · doi:10.1038/s41586-019-1190-7 · Cited by 83
“Model-based analysis of long-range chromatin interactions from PLAC-Seq (MAPS) 19 identified 22,430 long-distance promoter-centric interactions in optostimulated and control mice, enriched for regulatory regions of the genome marked by H3K27ac or CTCF occupancy (Extended Data Fig.”
InfluentialSelf-citationLiu, X., Xin, D. E., Zhong, X., Zhao, C., Li, Z., Zhang, L., Dourson, A. J., Lee, L., Mishra, S. V., Bayat, A. E., et al. (2024) · Cell · doi:10.1016/j.cell.2024.04.005 · Cited by 80
Self-citation3D chromatin architecture and transcription regulation in cancer
Deng, S., Feng, Y., & Pauklin, S. (2022) · Journal of Hematology & Oncology · doi:10.1186/s13045-022-01271-x · Cited by 79
Extrachromosomal circular DNA: a new potential role in cancer progression
Wang, T., Zhang, H., Zhou, Y., & Shi, J. (2021) · Journal of Translational Medicine · doi:10.1186/s12967-021-02927-x · Cited by 78
“Finally, the biotin-labelled DNA corresponding to the linker is enriched, and library preparation and paired-end DNA sequencing are performed [101, 102].”
BackgroundNuclear condensates of YAP fusion proteins alter transcription to drive ependymoma tumourigenesis
Hu, X., Wu, X., Berry, K., Zhao, C., Xin, D. E., Ogurek, S., Liu, X., Zhang, L., Luo, Z., Sakabe, M., et al. (2023) · Nature Cell Biology · doi:10.1038/s41556-022-01069-6 · Cited by 57
Self-citationHiC-DC+ enables systematic 3D interaction calls and differential analysis for Hi-C and HiChIP
Sahin, M., Wong, W., Zhan, Y.-Q. A., Deynze, K. V., Koche, R., & Leslie, C. (2021) · Nature Communications · doi:10.1038/s41467-021-23749-x · Cited by 57
CTCF organizes inter-A compartment interactions through RYBP-dependent phase separation
Wei, C., Jia, L., Huang, X., Tan, J., Wang, M., Niu, J., Hou, Y., Sun, J.-Y., Zeng, P., Wang, J., et al. (2022) · Cell Research · doi:10.1038/s41422-022-00676-0 · Cited by 55
FoxP3 associates with enhancer-promoter loops to regulate Treg-specific gene expression
Ramírez, R. N., Chowdhary, K., Léon, J., Mathis, D., & Benoist, C. (2021) · bioRxiv · doi:10.1126/sciimmunol.abj9836 · Cited by 51
“In line with current practice (42, 43), we quantitated EPL signals as reads that connect the promoter region (±500 bp around the TSS) to 5-kb bins tiled ±250 kb from the gene’s TSS.”
MethodGenome-wide chromatin accessibility is restricted by ANP32E
Murphy, K. E., Meng, F. W., Makowski, C. E., & Murphy, P. J. (2020) · Nature Communications · doi:10.1038/s41467-020-18821-x · Cited by 53
Mechanisms underlying divergent responses of genetically distinct macrophages to IL-4
Hoeksema, M. A., Shen, Z., Holtman, I. R., Zheng, A., Spann, N. J., Cobo, I., Gymrek, M., & Glass, C. K. (2021) · Science Advances · doi:10.1126/sciadv.abf9808 · Cited by 51
“HiChIP-seq data was processed with MAPS (Juric et al., 2019) at 5000bp resolution as described previously for PLAC-seq (Nott et al.”
MethodTranscriptional network orchestrating regional patterning of cortical progenitors
Ypsilanti, A., Pattabiraman, K., Catta-Preta, R., Golonzhka, O., Lindtner, S., Tang, K., Jones, I. R., Abnousi, A., Juric, I., Hu, M., et al. (2020) · Proceedings of the National Academy of Sciences of the United States of America · doi:10.1101/2020.11.03.366914 · Cited by 45
“10 promoters using a known promoter epigenomic mark (H3K4me3), and then identified chromosomal interactions for those promoters (Juric et al., 2019).”
InfluentialSelf-citationCalandrelli, R., Wen, X., Richard, J. L. C., Luo, Z., Nguyen, T. C., Chen, C.-J., Qi, Z., Xue, S., Chen, W., Yan, Z., et al. (2023) · Nature Communications · doi:10.1038/s41467-023-42274-7 · Cited by 55
Self-citationMulti-omic insights into Parkinson's Disease: From genetic associations to functional mechanisms
Schilder, B. M., Navarro, E., & Raj, T. (2021) · Neurobiology of Disease · doi:10.1016/j.nbd.2021.105580 · Cited by 45
Chen, P. B., Fiaux, P. C., Zhang, K., Li, B., Kubo, N., Jiang, S., Hu, R., Rooholfada, E., Wu, S., Wang, M., et al. (2022) · Cell Reports · doi:10.1016/j.celrep.2022.111630 · Cited by 41
“PLAC-seq data processing— PLAC-seq data were processed with MAPS (Juric et al., 2019) to normalize reads and identify long-range chromatin interactions.”
Self-citationDual genome-wide coding and lncRNA screens in neural induction of induced pluripotent stem cells
Wu, D., Poddar, A., Ninou, E., Hwang, E. E., Cole, M. A., Liu, S. J., Horlbeck, M. A., Chen, J., Replogle, J. M., Carosso, G. A., et al. (2022) · Cell Genomics · doi:10.1016/j.xgen.2022.100177 · Cited by 27
An integrated view of the structure and function of the human 4D nucleome
Dekker, J., Oksuz, B. A., Zhang, Y., Wang, Y., Minsk, M. K., Kuang, S., Yang, L., Gibcus, J. H., Krietenstein, N., Rando, O. J., et al. (2025) · Nature · doi:10.1038/s41586-025-09890-3 · Cited by 64
Self-citationHigh-Resolution Mapping of Multiway Enhancer-Promoter Interactions Regulating Pathogen Detection
Vangala, P., Murphy, R., Quinodoz, S. A., Gellatly, K. J., McDonel, P. E., Guttman, M., & Garber, M. G. (2020) · Molecular Cell · doi:10.1016/j.molcel.2020.09.005 · Cited by 29
“We found that 72% of SIP interactions were also identified using an assay where the Hi-C library preparation is followed by a chromatin immunoprecipitation ChIP (HiChIP) with a H3K27ac antibody (H3K27ac-HiChIP) data (Figure S2B; STAR Methods), and our analysis recapitulated most (4 of the 5) of the previously identifi…”
MethodMechanosensitive genomic enhancers potentiate the cellular response to matrix stiffness
Cosgrove, B. D., Bounds, L. R., Taylor, C. K., Su, A. L., Rizzo, A. J., Barrera, A., Sun, T., Safi, A., Song, L., Whitlow, T. J., et al. (2025) · Science · doi:10.1126/science.adl1988 · Cited by 43
SnapFISH: a computational pipeline to identify chromatin loops from multiplexed DNA FISH data
Lee, L., Yu, H., Jia, B. B., Jussila, A., Zhu, C., Chen, J. C., Xie, L., Hafner, A., Mishra, S. V., Wang, D. D., et al. (2023) · Nature Communications · doi:10.1038/s41467-023-40658-3 · Cited by 8
Self-citationParallel characterization of cis-regulatory elements for multiple genes using CRISPRpath
Ren, X.-J., Wang, M.-C., Li, B.-K., Jamieson, K., Zheng, L., Jones, I. R., Li, B., Takagi, M. A., Lee, J. C., Maliskova, L., et al. (2021) · bioRxiv · doi:10.1101/2021.02.19.431931 · Cited by 24
Self-citationChIATAC is an efficient strategy for multi-omics mapping of 3D epigenomes from low-cell inputs
Chai, H.-X., Tjong, H., Li, P., Liao, W., Wang, P., Wong, C.-H., Ngan, C., Leonard, W., Wei, C.-L., & Ruan, Y. (2023) · Nature Communications · doi:10.1038/s41467-023-35879-5 · Cited by 23
Benaglio, P., Zhu, H., Okino, M.-L., Yan, J., Elgamal, R. M., Nariai, N., Beebe, E., Korgaonkar, K., Qiu, Y., Donovan, M. K. R., et al. (2022) · Cell Genomics · doi:10.1016/j.xgen.2022.100214 · Cited by 35
“80 We used hg19 as the reference genome and H3K27ac ChIP-seq peaks in EndoC-b H1 cells from a published study.”
MethodSelf-citationHiC-ACT: Improved Detection of Chromatin Interactions from Hi-C Data via Aggregated Cauchy Test
Lagler, T. M., Yang, Y.-C., Abnousi, A., Hu, M., & Li, Y. (2020) · bioRxiv · doi:10.1101/2020.10.28.359869 · Cited by 23
“We compared these peak calls to mESC ChIP-seq (H3K4me3, H3K4me1, H3K27ac, and CTCF) peaks and ATAC-seq peaks.(26) We defined an overlap as a HiCACT/FitHiC2-called peak with either 10 kb bin overlapping a ChIP-seq/ATAC-seq peak.”
Self-citationDiverse Molecular Mechanisms Contribute to Differential Expression of Human Duplicated Genes
Shew, C. J., Carmona-Mora, P., Soto, D. C., Mastoras, M., Roberts, E., Rosas, J., Jagannathan, D., Kaya, G., O’Geen, H., & Dennis, M. Y. (2021) · Molecular Biology and Evolution · doi:10.1093/molbev/msab131 · Cited by 28
SnapHiC2: A computationally efficient loop caller for single cell Hi-C data
Li, X., Lee, L., Abnousi, A., Yu, M., Liu, W., Huang, L., Li, Y., & Hu, M. (2022) · Computational and Structural Biotechnology Journal · doi:10.1016/j.csbj.2022.05.046 · Cited by 20
Self-citationFath, M. K., Karimfar, N., Naghibi, A. F., Shafa, S., Shiran, M. G., Ataei, M., Dehghanzadeh, H., Nabi‐Afjadi, M., Ghadiri, T., Payandeh, Z., et al. (2022) · Cancer Cell International · doi:10.1186/s12935-022-02617-8 · Cited by 21
“Finally, the biotin-labeled DNA that corresponds to the linker is enriched, followed by library preparation and paired-end DNA sequencing [59, 60].”
Liu, C., Abnousi, A., Bazeley, P. S., Ni, Y., Morley, M. P., Moravec, C. S., Hu, M., & Tang, W. H. W. (2020) · Journal of Molecular and Cellular Cardiology · doi:10.1016/j.yjmcc.2020.06.001 · Cited by 23
“We applied the Model-based analysis of the PLAC-seq (MAPS) pipeline to analyze PLACseq data as previously described[18].”
MethodSelf-citationMSL2 ensures biallelic gene expression in mammals
Sun, Y., Wiese, M., Hmadi, R., Karayol, R., Seyfferth, J., Greene, J. A. M., Erdogdu, N. U., Deboutte, W., Arrigoni, L., Holz, H., et al. (2023) · Nature · doi:10.1038/s41586-023-06781-3 · Cited by 22
Wei, X., Xu, Y.-Y., Yang, D.-C., Kim, K., Yi, L., Luo, W.-Z., Lin, X., Xiang, Y., Williams, A. B., Wang, X.-T., et al. (2026) · Nature Biotechnology · doi:10.1038/s41587-026-03013-7 · Cited by 16
Self-citationThe impact of the embryonic DNA methylation program on CTCF-mediated genome regulation
Monteagudo, A., Albert, J. R., Scarpa, M., Noordermeer, D., & Greenberg, M. (2024) · Nucleic Acids Research · doi:10.1093/nar/gkae724 · Cited by 22
Huang, H., Zhu, Q.-S., Jussila, A. P., Han, Y., Bintu, B., Kern, C., Conte, M., Zhang, Y.-X., Bianco, S., Chiariello, A., et al. (2020) · bioRxiv · doi:10.1101/2020.07.07.192526 · Cited by 14
Self-citationFerris, E., Murcia, J. D. G., Rodriguez, A. C., Steinwand, S., Hörndli, C. S., Traenkner, D., Maldonado-Catala, P. J., & Gregg, C. (2024) · bioRxiv · doi:10.1101/2024.06.26.600891 · Cited by 13
The dynamic role of cohesin in maintaining human genome architecture
Agarwal, A., Korsak, S., Choudhury, A., & Plewczyński, D. (2023) · BioEssays · doi:10.1002/bies.202200240 · Cited by 14
Catta-Preta, R., Lindtner, S., Ypsilanti, A. R., Seban, N., Price, J. D., Abnousi, A., Su-Feher, L., Wang, Y., Cichewicz, K., Boerma, S. A., et al. (2024) · Developmental Cell · doi:10.1016/j.devcel.2024.10.004 · Cited by 21
Self-citationA screen for regeneration-associated silencer regulatory elements in zebrafish
Ando, K., Ou, J., Thompson, J., Welsby, J., Bangru, S., Shen, J., Wei, X., Diao, Y., & Poss, K. D. (2024) · Developmental Cell · doi:10.1016/j.devcel.2024.01.004 · Cited by 11
A comprehensive review of bioinformatics tools for chromatin loop calling
Liu, L., Han, K., Sun, H., Han, L., Gao, D., Xi, Q., Zhang, L., & Lin, H. (2023) · Briefings in Bioinformatics · doi:10.1093/bib/bbad072 · Cited by 14
THUNDER: A reference-free deconvolution method to infer cell type proportions from bulk Hi-C data
Rowland, B., Huh, R., Hou, Z., Crowley, C., Wen, J., Shen, Y., Hu, M., Giusti‐Rodríguez, P., Sullivan, P. F., & Li, Y. (2022) · PLoS Genetics · doi:10.1371/journal.pgen.1010102 · Cited by 11
“[36,37] Used in concert with methods to identify longrange chromatin interactions from HP data[38], our method is anticipated to efficiently leverage interchromosomal contacts jointly with high quality intrachromosomal contacts to estimate underlying cell type proportions.”
MethodSelf-citationProximity Ligation-Assisted ChIP-Seq (PLAC-Seq).
Yu, M., Juric, I., Abnousi, A., Hu, M., & Ren, B. (2021) · Methods in molecular biology · doi:10.1007/978-1-0716-1597-3_10 · Cited by 12
Self-citationNott, A., Holtman, I., Coufal, N., Schlachetzki, J., Yu, M., Hu, R., Han, C. Z., Pena, M., Xiao, J., Wu, Y., et al. (2019) · bioRxiv (Cold Spring Harbor Laboratory) · doi:10.1101/778183 · Cited by 11
“MAPS was used to call chromatin loops between H3K4me3 peaks and distal regulatory regions from PLAC-seq datasets in microglia, neurons and oligodendrocytes (58).”
MethodSelf-citationGlucocorticoids unmask silent non-coding genetic risk variants for common diseases
Nguyen, T. T. L., Gao, H., Liu, D., Philips, T. J., Ye, Z., Lee, J., Shi, G., Copenhaver, K. M., Zhang, L., Wei, L., et al. (2022) · Nucleic Acids Research · doi:10.1093/nar/gkac1045 · Cited by 10
Kubo, N., Ishii, H., Xiong, X., Bianco, S., Meitinger, F., Hu, R., Hocker, J. D., Conte, M., Gorkin, D. U., Yu, M., et al. (2020) · bioRxiv · doi:10.1101/2020.03.21.001693 · Cited by 10
Self-citationLee, L., Yu, M., Li, X., Zhu, C., Zhang, Y.-X., Yu, H.-Y., Chen, Z.-Y., Mishra, S., Ren, B., Li, Y., et al. (2022) · bioRxiv · doi:10.1101/2022.08.05.502991 · Cited by 9
Self-citationMachine Learning and Deep Learning in Genetics and Genomics
Wu, D., Karhade, D. S., Pillai, M., Jiang, M.-Z., Huang, L., Li, G., Cho, H., Roach, J. M., Li, Y., & Divaris, K. (2021) · Springer eBooks · doi:10.1007/978-3-030-71881-7_13 · Cited by 15
Self-citationPioneer factor GATA6 promotes colorectal cancer through 3D genome regulation
Lyu, H., Chen, X., Cheng, Y., Zhang, T.-S., Wang, P., Wong, J. H.-Y., Wang, J., Stasiak, L. A., Sun, L., Yang, G., et al. (2025) · Science Advances · doi:10.1126/sciadv.ads4985 · Cited by 9
Extensive folding variability between homologous chromosomes in mammalian cells
Irastorza-Azcarate, I., Kukalev, A., Kempfer, R., Thieme, C. J., Mastrobuoni, G., Markowski, J., Loof, G., Sparks, T. M., Brookes, E., Natarajan, K., et al. (2024) · bioRxiv · doi:10.1101/2024.05.08.591087 · Cited by 8
Self-citationTang, L., Hill, M., Ellinor, P., & Li, M. (2022) · Genome Biology · doi:10.1186/s13059-021-02597-4 · Cited by 8
“MAPS [29] adopted a zero-truncated Poisson regression framework to explicitly remove the biases of HiChIP/PLAC-seq data, and then identifies the chromatin interactions by the normalized contact frequencies.”
MethodLam, D. D., Nikolić, A., Zhao, C., Mirza-Schreiber, N., Krężel, W., Oexle, K., & Winkelmann, J. (2021) · bioRxiv · doi:10.1101/2021.09.03.458823 · Cited by 8
HPRep: Quantifying Reproducibility in HiChIP and PLAC-Seq Datasets
Rosen, J. D., Yang, Y.-C., Abnousi, A., Chen, J.-W., Song, M., Jones, I. R., Shen, Y., Hu, M., & Li, Y. (2020) · bioRxiv · doi:10.3390/cimb43020082 · Cited by 8
Self-citationWang, L., Taylor, T., Rathnakumar, K., Khyzha, N., Liang, M.-G., Alizada, A., Campitelli, L., Pour, S. E., Patel, Z. M., Antounians, L., et al. (2024) · bioRxiv · doi:10.1101/gr.280357.124 · Cited by 7
“processed using the MAPS pipeline (Juric et al. 2019) with default parameters.”
Sun, T., Xu, Y., Angel, N., Chen, L., Zhang, K., Hoffman, B. D., Ou, J., Meng, Z., Varghese, S., & Diao, Y. (2025) · Nature Cell Biology · doi:10.1038/s41556-025-01770-2 · Cited by 12
“Using HiCAR data from hES cells on stiff matrices, we identified 7,638 chromatin interactions anchored to the 4,981 YAP/CTCF co-occupied TE regions (10 kb loop calling using MAPS 68 , false discovery rate (FDR) <0.01; Supplementary Table 10).”
InfluentialHuang, Q., Sim, S., Geib, S., Childers, A. K., Liu, J.-F., Wei, X., Han, W.-S., Posada-Flórez, F., Xue, A. Z., Li, Z., et al. (2022) · GigaScience · doi:10.1093/gigascience/giad056 · Cited by 6
SnapHiC: a computational pipeline to map chromatin contacts from single cell Hi-C dataPreprint
Yu, M., Abnousi, A., Zhang, Y.-X., Li, G., Lee, L., Chen, Z.-Y., Fang, R.-X., Wen, J., Sun, Q., Li, Y., et al. (2020) · bioRxiv · doi:10.1101/2020.12.13.422543 · Cited by 6
Self-citationSong, M., Pebworth, M., Yang, X.-Y., Abnousi, A., Fan, C.-X., Wen, J., Rosen, J. D., Choudhary, M. N. K., Cui, X.-K., Jones, I. R., et al. (2020) · bioRxiv · doi:10.1101/2020.02.24.963652 · Cited by 6
Self-citationTsiakanikas, P., Athanasopoulou, K., Darioti, I. A., Agiassoti, V. T., Theocharis, S., Scorilas, A., & Adamopoulos, P. (2024) · Life · doi:10.3390/life14080922 · Cited by 5
Liu, W., Zhong, W., Giusti‐Rodríguez, P., Jiang, Z., Wang, G. W., Sun, H., Hu, M., & Li, Y. (2024) · Briefings in Bioinformatics · doi:10.1093/bib/bbae426 · Cited by 3
Self-citationWen, J., Lagler, T. M., Sun, Q., Yang, Y., Chen, J., Harigaya, Y., Sankaran, V. G., Hu, M., Reiner, A. P., Raffield, L. M., et al. (2022) · PLoS Genetics · doi:10.1371/journal.pgen.1009984 · Cited by 5
“We then used the -log10 (MAPS q-value) from the MAPS [8] calls as the interaction score for each promoter-PIR interaction, and took the cumulative sum of all interaction scores per promoter bait.”
MethodSelf-citationExtensive folding variability between homologous chromosomes in mammalian cells
Irastorza-Azcárate, I., Kukalev, A., Kempfer, R., Thieme, C. J., Mastrobuoni, G., Markowski, J., Loof, G., Sparks, T. M., Brookes, E., Natarajan, K. N., et al. (2025) · Molecular Systems Biology · doi:10.1038/s44320-025-00107-3 · Cited by 10
Self-citationFan, S., Dang, D., Gao, L., & Zhang, S. (2024) · Advanced Science · doi:10.1002/advs.202406364 · Cited by 4
Buka, K., Parteka-Tojek, Z., Agarwal, A., Denkiewicz, M., Korsak, S., Chiliński, M., Banecki, K. H., & Plewczyński, D. (2025) · Communications Biology · doi:10.1038/s42003-025-07847-w · Cited by 4
“Using HiChIP-speci fi c tools such as MAPS 28 , we identi fi ed interactions that are undetectable when using KR-https normalised interaction maps for loop calling.”
InfluentialHalder, A. K., Agarwal, A., Jodkowska, K., & Plewczyński, D. (2024) · Briefings in Functional Genomics · doi:10.1093/bfgp/elae009 · Cited by 5
Chromatin activity identifies differential gene regulation across human ancestries
Pettie, K. P., Mumbach, M. R., Lea, A. J., Ayroles, J. F., Chang, H. Y., Kasowski, M. M., & Fraser, H. B. (2024) · Genome biology · doi:10.1186/s13059-024-03165-2 · Cited by 3
Integrative analysis of the 3D genome and epigenome in mouse embryonic tissues
Yu, M., Zemke, N. R., Chen, Z., Jurić, I., Hu, R., Raviram, R., Abnousi, A., Fang, R., Zhang, Y., Gorkin, D. U., et al. (2024) · Nature Structural & Molecular Biology · doi:10.1038/s41594-024-01431-2 · Cited by 9
Self-citationHiC-DC+: systematic 3D interaction calls and differential analysis for Hi-C and HiChIP
Sahin, M., Wong, W., Zhan, Y.-Q. A., Deynze, K. V., Koche, R., & Leslie, C. (2020) · bioRxiv · doi:10.1101/2020.10.11.335273 · Cited by 4
“Similarly, we ranked candidate interactions using three other published methods: Fit-HiChIP 11 , an adaptation of Fit-Hi-C for HiChIP; MAPS 13 , another approach based on fitting a generalized linear model to estimate a background distribution; and hichipper 10 , a method that models the background…”
MethodInfluentialJenkinson, H. (2017) · JAMA dermatology · doi:10.1001/jamadermatol.2017.2923 · Cited by 4
Ding, Y., He, B., Bogush, D., Schramm, J., Singh, C., Dovat, K., Randazzo, J., Tukaramrao, D., Hengst, J., Annageldiyev, C., et al. (2024) · bioRxiv · doi:10.1038/s41375-025-02651-1 · Cited by 3
“There is a dynamic shift in the function of the genes regulated by H3K27me3 LOCKs: in day #1 following IKAROS re-expression, H3K27me3 LOCKs regulate mostly pathways in cancer and cellular proliferation, while in day #2, H3K27me3 LOCKs mostly regulate genes involved in immune response (Fig.”
Ng, H.-L., Robinson, M. E., May, P. C., Innes, A. J., Hiemeyer, C., & Feldhahn, N. (2024) · British Journal of Haematology · doi:10.1111/bjh.19322 · Cited by 3
MMCT-Loop: a mix model-based pipeline for calling targeted 3D chromatin loops
Tang, L., Liao, J., Hill, M., Hu, J., Zhao, Y.-C., Ellinor, P., & Li, M. (2024) · Nucleic Acids Research · doi:10.1093/nar/gkae029 · Cited by 3
“Up to now, there are 10 peak-based methods called ChIA-PET Tool ( 11 ), MICC ( 12 ), ChIA-PET2 ( 13 ), ChIA-PET Tool V3 ( 14 ), ChIAPoP ( 15 ), ChiaSig ( 16 ), Mango ( 17 ), Hichipper ( 18 ), MAPS ( 19 ), FitHiChIP ( 20 ) and HiCCUPS ( 21 ) (see Supplementary Table S1 ).”
Self-citationCatta-Preta, R., Lindtner, S., Ypsilanti, A., Price, J. D., Abnousi, A., Su-Feher, L., Wang, Y.-R., Juric, I., Jones, I. R., Akiyama, J., et al. (2023) · bioRxiv · doi:10.1101/2023.06.28.546894 · Cited by 3
Self-citationComputational methods for identifying enhancer‐promoter interactions
Gong, H., Chen, Z., Tang, Y., Li, M., Zhang, S., Zhang, X., & Chen, Y. (2023) · Quantitative Biology · doi:10.15302/j-qb-022-0322 · Cited by 3
Mohammed, J., Arora, N., Matthews, H., Hansen, K. L., Bader, M., Walsh, S., Shaffer, J., Weinberg, S., Swigut, T., Claes, P., et al. (2022) · bioRxiv · doi:10.1101/2022.09.05.506587 · Cited by 3
“To call significant 3D interactions, MAPS requires precomputed 1-dimensional (1D) ChIP peaks, ideally called from independent ChIP-seq experiments.”
MethodInfluentialDiscovery and Functional Characterization of Pro-growth Enhancers in Human Cancer CellsPreprint
Chen, P.-S. B., Fiaux, P. C., Li, B., Zhang, K., Kubo, N., Jiang, S., Hu, R., Wu, S.-H., Wang, M.-C., Wang, W., et al. (2021) · bioRxiv · doi:10.1101/2021.02.04.429675 · Cited by 3
“Supplementary Materials: Materials and Methods Figures S1-S9 Tables S1-S11 References (1-81)”
BackgroundMethodInfluentialSelf-citationEpigenetic regulation in osteoarthritis: recent updates and emerging mechanisms
Zhao, Y., & Liu, X. (2026) · Frontiers in Genetics · doi:10.3389/fgene.2026.1862466 · Cited by 2
“…(HiChIP), and proximity ligation-assisted chromatin immunoprecipitation sequencing (PLAC-seq) to systematically characterize chromatin interaction landscapes in OA chondrocytes, subchondral bone cells, and synovial cells (Juric et al., 2019; Bittner et al., 2024; Roberts and Rice, 2024).”
Self-citationPickering, S. H., Galigniana, N. M., Abdelhalim, M., Sørensen, A. L., Madsen‐Østerbye, J., Zucknick, M., Collas, P., & Briand, N. (2026) · Communications Biology · doi:10.1038/s42003-025-09469-8 · Cited by 3
“When calling chromatin interactions (loops) using the MAPs pipeline 14 , we found a similar number of loops across conditions (counts ≥ 6; Supplementary Fig.”
Accurate and robust 3D genome feature discovery from multiplexed DNA FISHPreprint
Yu, H., Zhou, L., Xie, L., Strambio‐De‐Castillia, C., Hu, M., & Li, Y. (2025) · bioRxiv (Cold Spring Harbor Laboratory) · doi:10.1101/2025.11.26.690837 · Cited by 1
“As a working ground truth, we collected six reference loop lists identified from mESCs: MAPS-identified loops from CTCF PLAC-seq data 48 , MAPS-identified loops from H3K4me3 PLAC-seq data 48 , CTCF ChIA-PET loops 49 , POLR2A ChIA-PET loops 49 , HiCExplorer 50 and FitHiC2 51 loops from bulk Hi-C 14 .”
Self-citationLoop Catalog: a comprehensive HiChIP database of human and mouse samples
Reyna, J., Fetter, K., Ignacio, R., Marandi, C. C. A., Ma, A., Rao, N., Jiang, Z., Figueroa, D. S., Bhattacharyya, S., & Ay, F. (2025) · Genome biology · doi:10.1186/s13059-025-03615-5 · Cited by 9
“For the identification of loops from HiChIP data, there again are a number of computational methods available, including those originally designed for Hi-C (e.g., HiCCUPS) and others specifically for HiChIP (e.g., FitHiChIP, hichipper, MAPS) [59, 88, 89].”
Rosen, J. D., Lee, L., Abnousi, A., Chen, J.-W., Wen, J., Hu, M., & Li, Y. (2023) · Computational and Structural Biotechnology Journal · doi:10.1016/j.csbj.2023.01.003 · Cited by 2
“HPTAD starts from the processed HP data, following our previous work [42].”
InfluentialSelf-citationGlotov, O., Chernov, A., Fedyakov, M., Larionova, V., Zaretsky, A., Donnikov, M., & Glotov, A. (2022) · Biological Communications · doi:10.21638/spbu03.2022.403 · Cited by 2
Kubo, N., Hu, R., Ye, Z., & Ren, B. (2021) · bioRxiv · doi:10.1101/2021.03.17.435905 · Cited by 2
“, Takahashi, Y.H., Mickey, K., Voets, O., 536 Verrijzer, C.P., and Shilatifard, A. (2012). Enhancer-associated H3K4 monomethylation by 537 Trithorax-related, the Drosophila homolog of mammalian Mll3/Mll4. Genes Dev 26, 2604-2620. 538 Hu, D., Gao, X., Cao, K., Morgan, M.A., Mas, G., Smith, E.R., Volk, A.G., Bartom, E.T…”
InfluentialSelf-citationWikumpriya, G. C. (2026) · International Journal of Biological Macromolecules · doi:10.1016/j.ijbiomac.2026.152499 · Cited by 1
Ou, J., & Poss, K. D. (2024) · Bioinformatics Advances · doi:10.1093/bioadv/vbaf299 · Cited by 1
Choppavarapu, L., Nosirov, B., Kahn, M., & Jin, V. X. (2026) · Cancers · doi:10.3390/cancers18213416
Zhou, L.-B., Chen, C., Zhao, J. Z., Hu, M., & Li, Y. (2026) · Methods and Protocols · doi:10.3390/mps9050135
“For mESC, we used ChIP-seq peaks for CTCF, H3K4me1, H3K4me3, H3K27ac [31–33], ATAC-seq peaks [33], super-enhancer annotations from dbSUPER [34], and active enhancer annotations from FANTOM5 [35].”
Self-citation3D epigenome of glial cell types in developing human cortex
Jones, I. R., Wang, L., Kosicki, M., Battle, S. L., Narayan, V. J., Bi, Q., Gemenes, K., Liu, Y., Zhou, L., Song, M., et al. (2026) · Nature · doi:10.1038/s41586-026-10987-6
“87.”
Self-citationA Microglial Regulatory Program Linked to Neuropsychiatric DisordersPreprint
Tränkner, D., Johnson, A. P., Williams, M. E., & Rothenfluh, A. (2026) · bioRxiv (Cold Spring Harbor Laboratory) · doi:10.64898/2026.08.27.747643
“Reproducible interactions involving Hoxb8-bound loci were identified using MAPS at 5-kb resolution and a maximum interaction distance of 5 Mb (Juric et al., 2019).”
Agarwal, A., Bkhetan, Z. A., & Plewczyński, D. (2026) · Bioinformatics · doi:10.1093/bioinformatics/btag636
“Tools such as HiC-Pro (Servant et al. 2015), MAPS (Juric et al. 2019), and FitHiChIP (Bhattacharyya et al. 2019) have introduced workflows for detecting chromatin loops.”
InfluentialBaruri, S., Batra, L., Adhikari, S., & El-Baz, A. S. (2026) · Epigenomes · doi:10.3390/epigenomes10030053 · Cited by 1
Metadata
- Authors
- Juric, I., Yu, M., Abnousi, A., Raviram, R., Fang, R., Zhao, Y., Zhang, Y., Qiu, Y., Yang, Y., Li, Y., Ren, B., & Hu, M.
- Affiliations
- Ludwig Cancer Research (US)
- Cleveland Clinic (US)
- University of California San Diego (US)
- University of North Carolina at Chapel Hill (US)
- Corresponding author
- Ren, Bing
- Hu, Ming
- ORCID
- Venue
- PLOS Computational Biology
- Publisher
- Public Library of Science (PLoS)
- Published
- 2019-04-15
- Volume
- 15
- Issue
- 4
- Pages
- e1006982
- ISSN
- 1553-734X (ISSN-L)
- 1553-7358
- PMC
- PMC6483256
- OpenAlex
- W2951448241
- Cited by
- 121
- References
- 35
- Citations by year
- 2026: 11 · 2025: 10 · 2024: 22 · 2023: 12 · 2022: 23 · 2021: 22 · 2020: 10 · 2019: 10
- FWCI
- 5.62
- Type
- journal article
- Language
- en
- Update notices
- new_version (2019-04-25)
- Open access
- gold
- doi.org
- Licence
- Locations
- PLoS Computational Biology (publishedVersion, cc-by)
- bioRxiv (Cold Spring Harbor Laboratory) (acceptedVersion, cc-by-nc-nd)
- PubMed Central (publishedVersion, cc-by)
- PubMed (publishedVersion)
- Carolina Digital Repository (University of North Carolina at Chapel Hill) (submittedVersion, other-oa)
- DOAJ (DOAJ: Directory of Open Access Journals) (submittedVersion, cc-by-sa)
- Figshare (submittedVersion, cc-by)
- UNC Libraries
- Funders
- Foundation for the National Institutes of Health (U54DK107977, R01HL129132)
- Topics
- Life Sciences › Biochemistry, Genetics and Molecular Biology › Molecular Biology › Genomics and Chromatin Dynamics
- Life Sciences › Biochemistry, Genetics and Molecular Biology › Molecular Biology › Chromatin Remodeling and Cancer
- Life Sciences › Biochemistry, Genetics and Molecular Biology › Molecular Biology › Bioinformatics and Genomic Networks
- Keywords
- long-range chromatin interactions, HiChIP, Hi-C, transcription factor binding sites, histone modifications, model-based analysis, maps
- MeSH terms
- Chromatin, Chromosome Mapping, Computer Simulation, Humans, Software, Genome, Sequence Analysis, DNA, Computational Biology, Genomics, Chromatin Assembly and Disassembly, Histone Code, Chromatin Immunoprecipitation, High-Throughput Nucleotide Sequencing
About these checks
Registry, retraction, Cites and statistics results are computed, not judged, with one exception: a printed reference that no index lists is read once by a model before it counts as a citation error. Claims are extracted by a model and kept only when their quote appears verbatim in the text; each cited source is then checked, with a model’s help, for whether it says what the claim relies on. Those verdicts can be wrong — read the claim’s quote and the cited source before relying on one.
Statistics and arithmetic are recomputed, not judged.
Confidence bands are shown only for fields calibrated on our annotated test set. None is calibrated yet, so no band is shown.
What counts as a claim ›How we measure confidence ›How we check this ›
Are you an author, or do you see a problem with this page? Request a review
