

The DOI matches its Crossref record; 67 of the 67 references it cites were found in a registry or an index.
Machine learning modeling of family wide enzyme-substrate specificity screens
Open accessAbstract
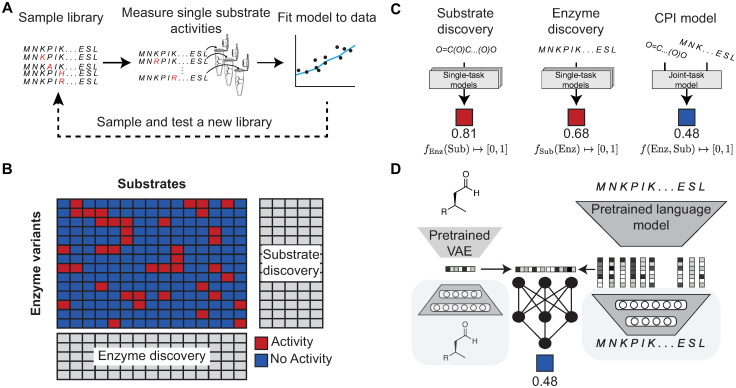
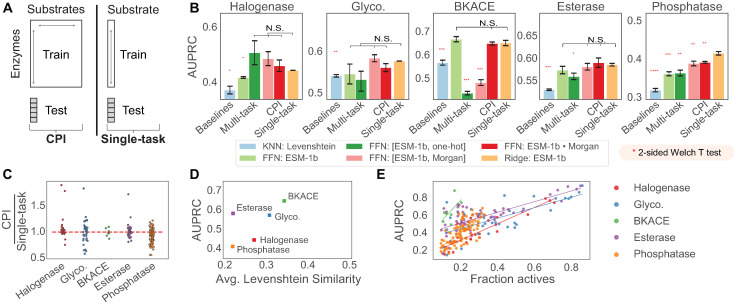
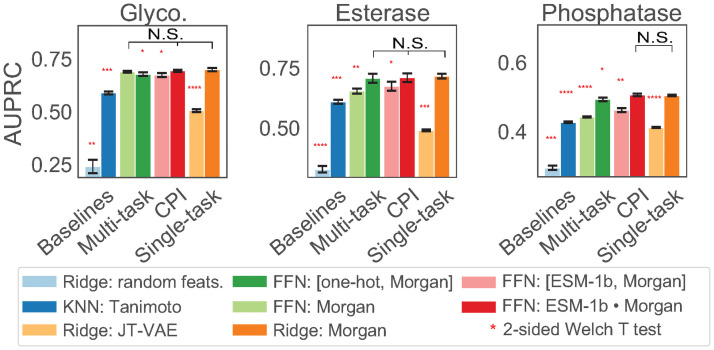
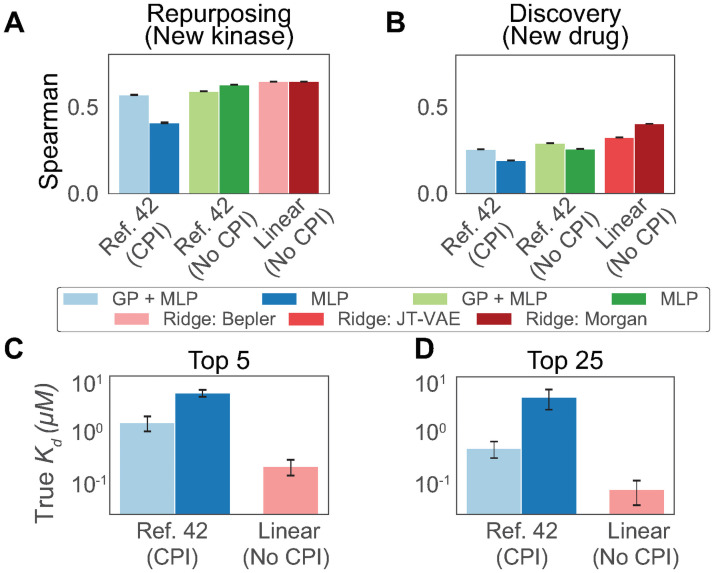
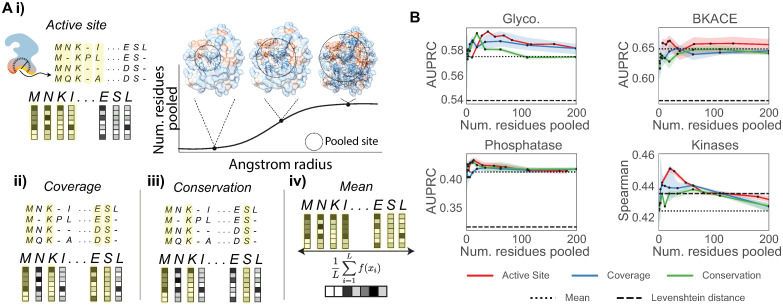
Biocatalysis is a promising approach to sustainably synthesize pharmaceuticals, complex natural products, and commodity chemicals at scale. However, the adoption of biocatalysis is limited by our ability to select enzymes that will catalyze their natural chemical transformation on non-natural substrates. While machine learning and in silico directed evolution are well-posed for this predictive modeling challenge, efforts to date have primarily aimed to increase activity against a single known substrate, rather than to identify enzymes capable of acting on new substrates of interest. To address this need, we curate 6 different high-quality enzyme family screens from the literature that each measure multiple enzymes against multiple substrates. We compare machine learning-based compound-protein interaction (CPI) modeling approaches from the literature used for predicting drug-target interactions. Surprisingly, comparing these interaction-based models against collections of independent (single task) enzyme-only or substrate-only models reveals that current CPI approaches are incapable of learning interactions between compounds and proteins in the current family level data regime. We further validate this observation by demonstrating that our no-interaction baseline can outperform CPI-based models from the literature used to guide the discovery of kinase inhibitors. Given the high performance of non-interaction based models, we introduce a new structure-based strategy for pooling residue representations across a protein sequence. Altogether, this work motivates a principled path forward in order to build and evaluate meaningful predictive models for biocatalysis and other drug discovery applications.
Overview
The claims and statistics of this paper haven’t been checked yet.
Run the check — free, no account needed. It reads the open-access text and checks the sources it cites.
Integrity signals
Registry
Cites
Statistics
Figures
Verification
Claims the paper makes
The claims and statistics of this paper haven’t been checked yet.
Run the check — free, no account needed. It reads the open-access text and checks the sources it cites.
Claims other papers make about this one
Each is checked against this paper’s own text: does it say what the citing paper says it does?
In the citing paper
“It has been shown that the resulting representations contain rich information about the structure and the function of the proteins 17 , 32 , 33 .”
From Turnover number predictions for kinetically uncharacterized enzymes using machine and deep learning (2023) · cites this paper as [33]
Self-check
Percentages, sums and reported differences re-computed from the paper’s own numbers.
The self-check needs the paper’s full text.
Citations
Cites
Scikit-learn: Machine Learning in Python
Pedregosa, F., Varoquaux, G., Gramfort, A., Michel, V., Thirion, B., Grisel, O., Blondel, M., Müller, A., Nothman, J., Louppe, G., et al. (2012) · arXiv · doi:10.48550/arxiv.1201.0490 · Cited by 71,016
BERT: Pre-training of Deep Bidirectional Transformers for Language Understanding
Devlin, J., Chang, M.-W., Lee, K., & Toutanova, K. (2019) · Proceedings of the 2019 Conference of the North American Chapter of the Association for Computational Linguistics: Human Language Technologies, Volume 1 (Long and Short Papers) · doi:10.18653/v1/n19-1423 · Cited by 54,325
UCSF Chimera—A visualization system for exploratory research and analysis
Pettersen, E. F., Goddard, T. D., Huang, C. C., Couch, G. S., Greenblatt, D. M., Meng, E. C., & Ferrin, T. E. (2004) · Journal of Computational Chemistry · doi:10.1002/jcc.20084 · Cited by 46,047
Highly accurate protein structure prediction with AlphaFold
Jumper, J., Evans, R., Pritzel, A., Green, T., Figurnov, M., Ronneberger, O., Tunyasuvunakool, K., Bates, R., Žídek, A., Potapenko, A., et al. (2021) · Nature · doi:10.1038/s41586-021-03819-2 · Cited by 43,764
Advances in neural information processing systems 7
(1996) · Computers & Mathematics with Applications · doi:10.1016/s0898-1221(96)90463-0 · Cited by 14,759
Larian Studios Dev Team (2024) · doi:10.1145/3292500.3330701 · Cited by 8,618
Biopython: freely available python tools for computational molecular biology and bioinformatics
Cock, P. J. A., Antao, T., Chang, J. T., Chapman, B. A., Cox, C. J., Dalke, A., Friedberg, I., Hamelryck, T., Kauff, F., Wilczynski, B., et al. (2009) · Bioinformatics · doi:10.1093/bioinformatics/btp163 · Cited by 6,080
Accurate prediction of protein structures and interactions using a 3-track network
Baek, M., DiMaio, F., Anishchenko, I., Dauparas, J., Ovchinnikov, S., Lee, G. R., Wang, J., Cong, Q., Kinch, L. N., Schaeffer, R. D., et al. (2021) · doi:10.1101/2021.06.14.448402 · Cited by 5,549
PubChem Substance and Compound databases
Kim, S., Thiessen, P. A., Bolton, E. E., Chen, J., Fu, G., Gindulyte, A., Han, L., He, J., He, S., Shoemaker, B. A., et al. (2016) · Nucleic Acids Research · doi:10.1093/nar/gkv951 · Cited by 5,436
Rives, A., Meier, J., Sercu, T., Goyal, S., Lin, Z., Liu, J., Guo, D., Ott, M., Zitnick, C. L., Ma, J., et al. (2021) · Proceedings of the National Academy of Sciences · doi:10.1073/pnas.2016239118 · Cited by 3,286
Research works printed but not linked: 8
- P Carbonell, 2018, Selenzyme: Enzyme selection tool for pathway design, Bioinformatics, 34, 2153, 10.1093/bioinformatics/bty065 · DOI
- BF Fisher, 2019, Site-Selective C–H Halogenation Using Flavin-Dependent Halogenases Identified via Family-Wide Activity Profiling, ACS Central Science, 5, 1844, 10.1021/acscentsci.9b00835 · DOI
- Huang K, Fu T, Gao W, Zhao Y, Roohani Y, Leskovec J, et al. Therapeutics data Commons: machine learning datasets and tasks for therapeutics. arXiv preprint arXiv:210209548. 2021.
- Shanehsazzadeh A, Belanger D, Dohan D. Is transfer learning necessary for protein landscape prediction? arXiv preprint arXiv:201103443. 2020.
- Lu T, Lu AX, Moses AM. Random Embeddings and Linear Regression can Predict Protein Function. arXiv preprint arXiv:210414661. 2021.
- Detlefsen NS, Hauberg S, Boomsma W. What is a meaningful representation of protein sequences? arXiv preprint arXiv:201202679. 2020.
- J Jumper, 2020, High accuracy protein structure prediction using deep learning, Fourteenth Critical Assessment of Techniques for Protein Structure Prediction (Abstract Book), 22, 24
- Paszke A, Gross S, Massa F, Lerer A, Bradbury J, Chanan G, et al. Pytorch: An imperative style, high-performance deep learning library. arXiv preprint arXiv:191201703. 2019.
Cited by
Sorted by citations
Items 101–121 of 121
Wan, X., Shahrear, S., Chew, S. W., Vilaplana, F., & Mäkelä, M. (2024) · Figshare · doi:10.6084/m9.figshare.27000688
Wan, X., Shahrear, S., Chew, S. W., Vilaplana, F., & Mäkelä, M. (2024) · Figshare · doi:10.6084/m9.figshare.27000685
Sequeiros-Borja, C. E., Škoda, P., & Brezovský, J. (2026) · ChemPhysChem · doi:10.1002/cphc.202500883
Valderruten-Cajiao, M., Nuñez, L. F. S., Rodríguez-Ararat, A. C., Caicedo, P. A., Barrera-Ocampo, A. A., Cortés, N., Osorio, E. H., Gamba-Sánchez, D. A., Barrios, A. F. G., & Villegas-Torres, M. F. (2026) · ACS Synthetic Biology · doi:10.1021/acssynbio.5c00779
Accurate and task-agnostic modeling of enzymatic reactions through multimodal relational learning
Huang, Y., Li, L., Qian, W., Yu, J., Zhao, H., Wang, X., Zhang, O., Chen, G., Gu, S., Heng, P.-A., et al. (2026) · Acta Pharmaceutica Sinica B · doi:10.1016/j.apsb.2026.03.052
Tao, S., Liu, J., Xiang, M., Ma, X., Huo, T., & Ning, X. (2026) · Biomedical Signal Processing and Control · doi:10.1016/j.bspc.2026.110377
Unlocking Enzyme Discovery: Leveraging Multi-Omics, Machine Learning, and De Novo Design
Xia, H., Zhou, C., Fu, B., & Han, H. (2026) · Methods in molecular biology · doi:10.1007/978-1-0716-5264-0_7
A machine learning-based workflow for transaminase selection
Rago, A. J., Raghavan, P., Santiago-Capeles, L., Zhang, R., Wang, Y., & Coley, C. W. (2026) · Chemical Science · doi:10.1039/d6sc00852f
Self-citationData-Efficient Exploration of Enzyme Function Using Family-Specific Machine LearningPreprint
Ahmed, F. H., Bender, A., Wijesinghe, A., Zhu, A. Y., Zhang, L., Gebbie, L. K., Marsh, A., Ishitate, C., Holdsworth, W., Jones, C., et al. (2026) · bioRxiv (Cold Spring Harbor Laboratory) · doi:10.64898/2026.06.02.729712
Wang, Q., Pan, J., Wang, X., & Zhao, S. (2026) · Journal of Chemical Information and Modeling · doi:10.1021/acs.jcim.6c01212
Synzymes 2.0: Engineering catalytic function with artificial intelligence and advanced materials
Mohammad, S. F., Ali, F., & Shynara, M. (2026) · Biocatalysis and Biotransformation · doi:10.1080/10242422.2026.2688362
EPIC: A Machine-Learning Framework for Product-Dependent Behavior in β-Glucosidases
Malli, A., Vasyutyn, D., Majumder, A., & Kim, J. R. (2026) · ACS Omega · doi:10.1021/acsomega.6c04226
Shim, E., & Narayan, A. R. H. (2026) · Current Opinion in Green and Sustainable Chemistry · doi:10.1016/j.cogsc.2026.101088
Discovery of a phenazine–thiol conjugase from sparse data using genome-informed machine learning
Shan, X., Trindade, I. B., Glasser, N. R., Thalhammer, K. O., Scurria, M., Mora, A., Conway, S. J., & Newman, D. K. (2026) · Proceedings of the National Academy of Sciences · doi:10.1073/pnas.2607571123
Chen, R., Huang, L., Qiao, Y., Mandal, S., Mo, L., Li, L., Leshchiner, D., Zhang, X., Pu, J., Xie, Y., et al. (2026) · bioRxiv (Cold Spring Harbor Laboratory) · doi:10.64898/2026.08.25.746866
Gao, R., Duan, C., Qin, N., Liu, Y., Liu, K., Tsuboi, T., & Chen, Z. (2026) · ACS Omega · doi:10.1021/acsomega.5c11697
Robots and Minimal, Physics‐Informed Features: A Hybrid Framework for Enzyme Catalysis
Onishchenko, N. R., Larsen, E. S., Paneru, G., Lee, K., Kolygina, D. V., Jia, Y., Clarissa, E. M., Wong, W., & Grzybowski, B. A. (2026) · Advanced Science · doi:10.1002/advs.77474
Reframing enzyme function prediction as conditional generationPreprint
Rieger, W. J., Haeussermann, S., Herrmann, L., Li, Z., Frohn, B. P., Maluenda, M., Lobinska, G., Loomba, S., Reisenbauer, J. C., Mikael Bodén, A., et al. (2026) · bioRxiv (Cold Spring Harbor Laboratory) · doi:10.64898/2026.09.09.750355
Pockets to products: a data-driven approach for classification of monoterpene synthases
Raghallaigh, C. Ó., Scrutton, N. S., & Hay, S. (2026) · Digital Discovery · doi:10.1039/d6dd00312e
Zhao, Y., Peng, C., Xia, Y., Dong, T., Xu, J., Shan, X., Zhong, X., Xue, J., Bing, Z., Li, P., et al. (2026) · Cell Metabolism · doi:10.1016/j.cmet.2026.09.003 · Cited by 1
Predicting Functional Diversity Within Enzyme Families: A Practical Perspective
Sokolova, N., & Haslinger, K. (2026) · ChemBioChem · doi:10.1002/cbic.70568
Metadata
- Authors
- Goldman, S., Das, R., Yang, K. K., & Coley, C. W.
- Affiliations
- Massachusetts Institute of Technology (US)
- Microsoft Research New England (United States) (US)
- Corresponding author
- Coley, Connor W.
- Venue
- PLOS Computational Biology
- Publisher
- Public Library of Science (PLoS)
- Published
- 2022-02-10
- Volume
- 18
- Issue
- 2
- Pages
- e1009853
- ISSN
- 1553-734X (ISSN-L)
- 1553-7358
- PMC
- PMC8865696
- OpenAlex
- W3198646379
- Cited by
- 120
- References
- 62
- Citations by year
- 2026: 27 · 2025: 25 · 2024: 29 · 2023: 29 · 2022: 10
- FWCI
- 12.72
- Type
- journal article
- Language
- en
- Update notices
- new_version (2022-02-23)
- Open access
- gold
- doi.org
- Licence
- Locations
- PLoS Computational Biology (publishedVersion, cc-by)
- PubMed Central (publishedVersion, cc-by)
- PubMed (publishedVersion)
- arXiv (Cornell University) (submittedVersion)
- DOAJ (DOAJ: Directory of Open Access Journals) (submittedVersion, cc-by-sa)
- DSpace@MIT (Massachusetts Institute of Technology) (submittedVersion, cc-by-nc)
- arXiv (Cornell University)
- Funders
- Machine Learning for Pharmaceutical Discovery and Synthesis Consortium
- Topics
- Life Sciences › Pharmacology, Toxicology and Pharmaceutics › Drug Discovery › Computational Drug Discovery Methods
- Life Sciences › Biochemistry, Genetics and Molecular Biology › Molecular Biology › Machine Learning in Bioinformatics
- Life Sciences › Biochemistry, Genetics and Molecular Biology › Molecular Biology › Enzyme Catalysis and Immobilization
- Keywords
- enzyme substrate specificity, biocatalysis, compound-protein interaction prediction, kinase inhibitors, protein sequence representation, enzyme discovery, drug-target interactions, machine learning prediction models
- MeSH terms
- Machine Learning, Amino Acid Sequence, Proteins, Substrate Specificity, Drug Discovery
About these checks
Registry, retraction, Cites and statistics results are computed, not judged, with one exception: a printed reference that no index lists is read once by a model before it counts as a citation error. Claims are extracted by a model and kept only when their quote appears verbatim in the text; each cited source is then checked, with a model’s help, for whether it says what the claim relies on. Those verdicts can be wrong — read the claim’s quote and the cited source before relying on one.
Statistics and arithmetic are recomputed, not judged.
Confidence bands are shown only for fields calibrated on our annotated test set. None is calibrated yet, so no band is shown.
What counts as a claim ›How we measure confidence ›How we check this ›
Are you an author, or do you see a problem with this page? Request a review
